Rancho Tehama Reserve, CA Map & Demographics
Rancho Tehama Reserve Map
Rancho Tehama Reserve Overview
$20,617
PER CAPITA INCOME
$28,889
AVG HOUSEHOLD INCOME
0.41
INEQUALITY / GINI INDEX
793
TOTAL POPULATION
396
MALE POPULATION
397
FEMALE POPULATION
99.75
MALES / 100 FEMALES
100.25
FEMALES / 100 MALES
55.9
MEDIAN AGE
2.5
AVG FAMILY SIZE
2.0
AVG HOUSEHOLD SIZE
129
LABOR FORCE [ PEOPLE ]
19.9%
PERCENT IN LABOR FORCE
7.4%
UNEMPLOYMENT RATE
Income in Rancho Tehama Reserve
Income Overview in Rancho Tehama Reserve
| Characteristic | Number | Measure |
| Per Capita Income | 793 | $20,617 |
| Median Family Income | 204 | $0 |
| Mean Family Income | 204 | $35,992 |
| Median Household Income | 400 | $28,889 |
| Mean Household Income | 400 | $44,937 |
| Income Deficit | 204 | $0 |
| Wage / Income Gap (%) | 793 | 0.00% |
| Wage / Income Gap ($) | 793 | 100.00¢ per $1 |
| Gini / Inequality Index | 793 | 0.41 |
Earnings by Sex in Rancho Tehama Reserve
| Sex | Number | Average Earnings |
| Male | 117 (80.1%) | $0 |
| Female | 29 (19.9%) | $0 |
| Total | 146 (100.0%) | $0 |
Earnings by Sex by Income Bracket in Rancho Tehama Reserve
The most common earnings brackets in Rancho Tehama Reserve are $75,000 to $99,999 for men (52 | 44.4%) and $50,000 to $54,999 for women (12 | 41.4%).
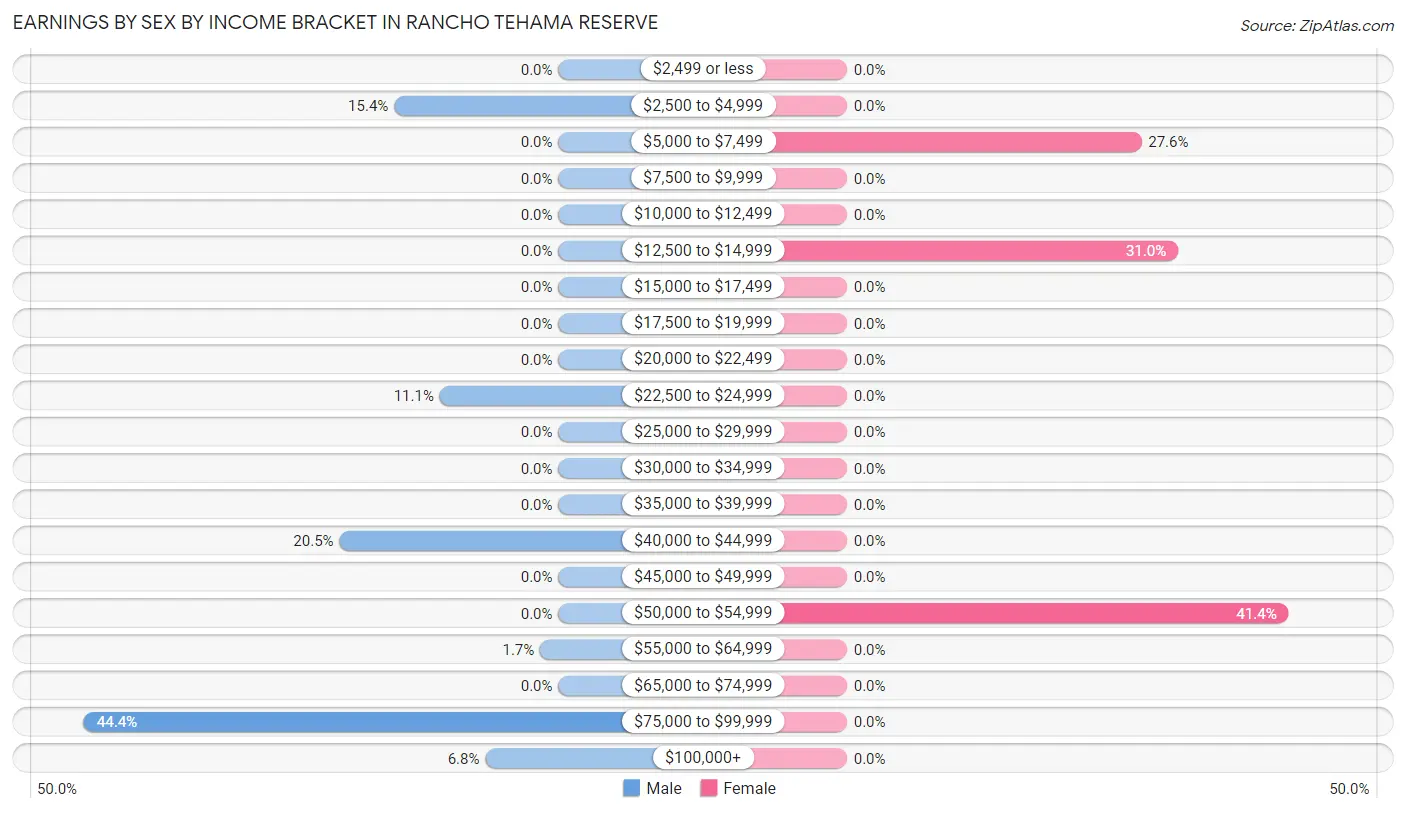
| Income | Male | Female |
| $2,499 or less | 0 (0.0%) | 0 (0.0%) |
| $2,500 to $4,999 | 18 (15.4%) | 0 (0.0%) |
| $5,000 to $7,499 | 0 (0.0%) | 8 (27.6%) |
| $7,500 to $9,999 | 0 (0.0%) | 0 (0.0%) |
| $10,000 to $12,499 | 0 (0.0%) | 0 (0.0%) |
| $12,500 to $14,999 | 0 (0.0%) | 9 (31.0%) |
| $15,000 to $17,499 | 0 (0.0%) | 0 (0.0%) |
| $17,500 to $19,999 | 0 (0.0%) | 0 (0.0%) |
| $20,000 to $22,499 | 0 (0.0%) | 0 (0.0%) |
| $22,500 to $24,999 | 13 (11.1%) | 0 (0.0%) |
| $25,000 to $29,999 | 0 (0.0%) | 0 (0.0%) |
| $30,000 to $34,999 | 0 (0.0%) | 0 (0.0%) |
| $35,000 to $39,999 | 0 (0.0%) | 0 (0.0%) |
| $40,000 to $44,999 | 24 (20.5%) | 0 (0.0%) |
| $45,000 to $49,999 | 0 (0.0%) | 0 (0.0%) |
| $50,000 to $54,999 | 0 (0.0%) | 12 (41.4%) |
| $55,000 to $64,999 | 2 (1.7%) | 0 (0.0%) |
| $65,000 to $74,999 | 0 (0.0%) | 0 (0.0%) |
| $75,000 to $99,999 | 52 (44.4%) | 0 (0.0%) |
| $100,000+ | 8 (6.8%) | 0 (0.0%) |
| Total | 117 (100.0%) | 29 (100.0%) |
Earnings by Sex by Educational Attainment in Rancho Tehama Reserve
| Educational Attainment | Male Income | Female Income |
| Less than High School | - | - |
| High School Diploma | - | - |
| College or Associate's Degree | - | - |
| Bachelor's Degree | - | - |
| Graduate Degree | - | - |
| Total | - | - |
Family Income in Rancho Tehama Reserve
Family Income Brackets in Rancho Tehama Reserve
According to the Rancho Tehama Reserve family income data, there are 81 families falling into the less than $10,000 income range, which is the most common income bracket and makes up 39.7% of all families.
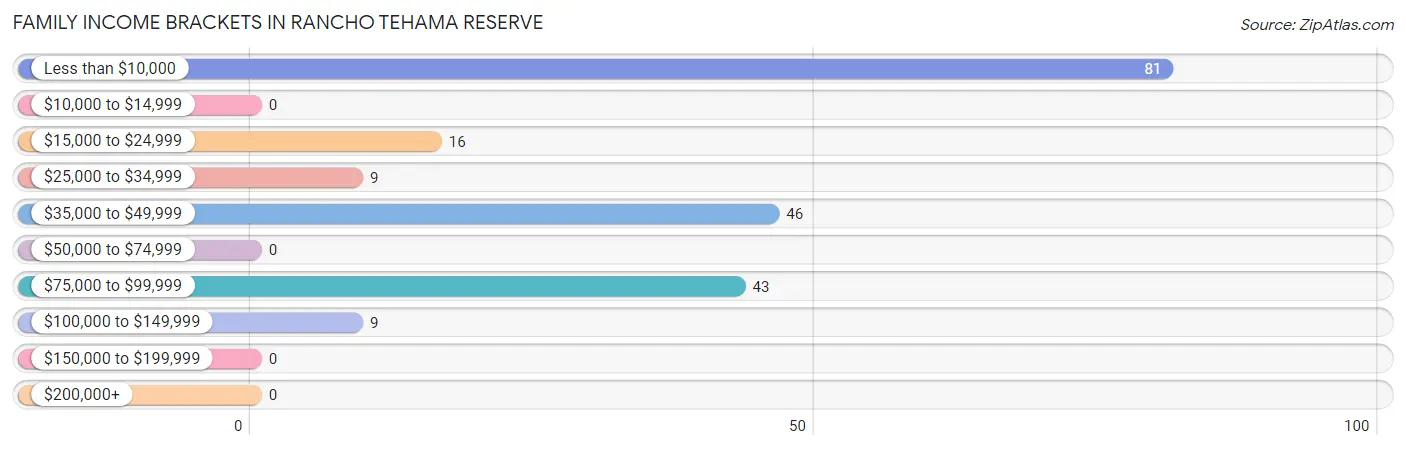
| Income Bracket | # Families | % Families |
| Less than $10,000 | 81 | 39.7% |
| $10,000 to $14,999 | 0 | 0.0% |
| $15,000 to $24,999 | 16 | 7.8% |
| $25,000 to $34,999 | 9 | 4.4% |
| $35,000 to $49,999 | 46 | 22.5% |
| $50,000 to $74,999 | 0 | 0.0% |
| $75,000 to $99,999 | 43 | 21.1% |
| $100,000 to $149,999 | 9 | 4.4% |
| $150,000 to $199,999 | 0 | 0.0% |
| $200,000+ | 0 | 0.0% |
Family Income by Famaliy Size in Rancho Tehama Reserve
2-person families (119 | 58.3%) account for the highest median family income in Rancho Tehama Reserve with $48,578 per family, while 2-person families (119 | 58.3%) have the highest median income of $24,289 per family member.
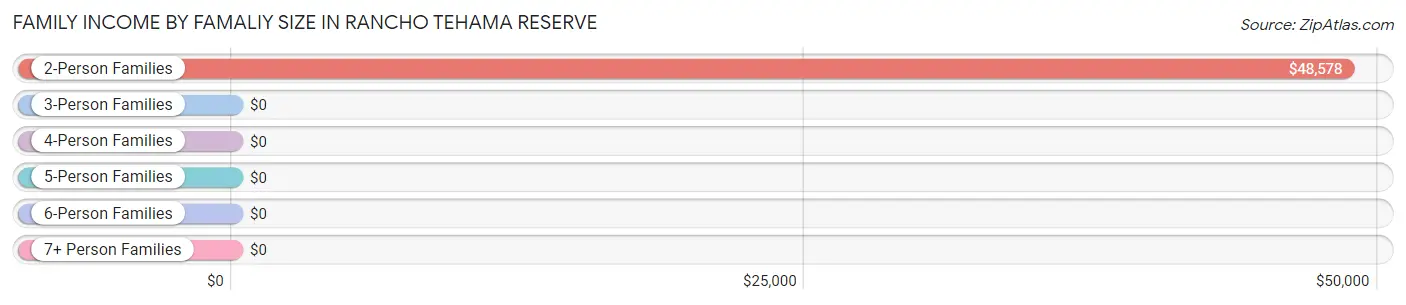
| Income Bracket | # Families | Median Income |
| 2-Person Families | 119 (58.3%) | $48,578 |
| 3-Person Families | 68 (33.3%) | $0 |
| 4-Person Families | 17 (8.3%) | $0 |
| 5-Person Families | 0 (0.0%) | $0 |
| 6-Person Families | 0 (0.0%) | $0 |
| 7+ Person Families | 0 (0.0%) | $0 |
| Total | 204 (100.0%) | $0 |
Family Income by Number of Earners in Rancho Tehama Reserve
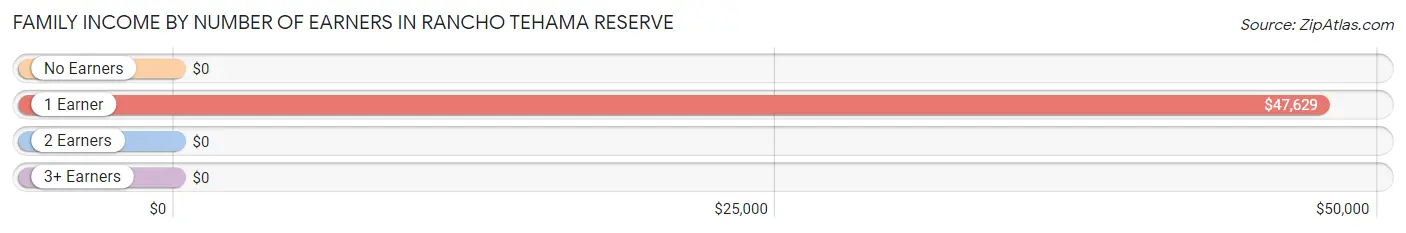
| Number of Earners | # Families | Median Income |
| No Earners | 140 (68.6%) | $0 |
| 1 Earner | 55 (27.0%) | $47,629 |
| 2 Earners | 9 (4.4%) | $0 |
| 3+ Earners | 0 (0.0%) | $0 |
| Total | 204 (100.0%) | $0 |
Household Income in Rancho Tehama Reserve
Household Income Brackets in Rancho Tehama Reserve
With 111 households falling in the category, the $75,000 to $99,999 income range is the most frequent in Rancho Tehama Reserve, accounting for 27.8% of all households.
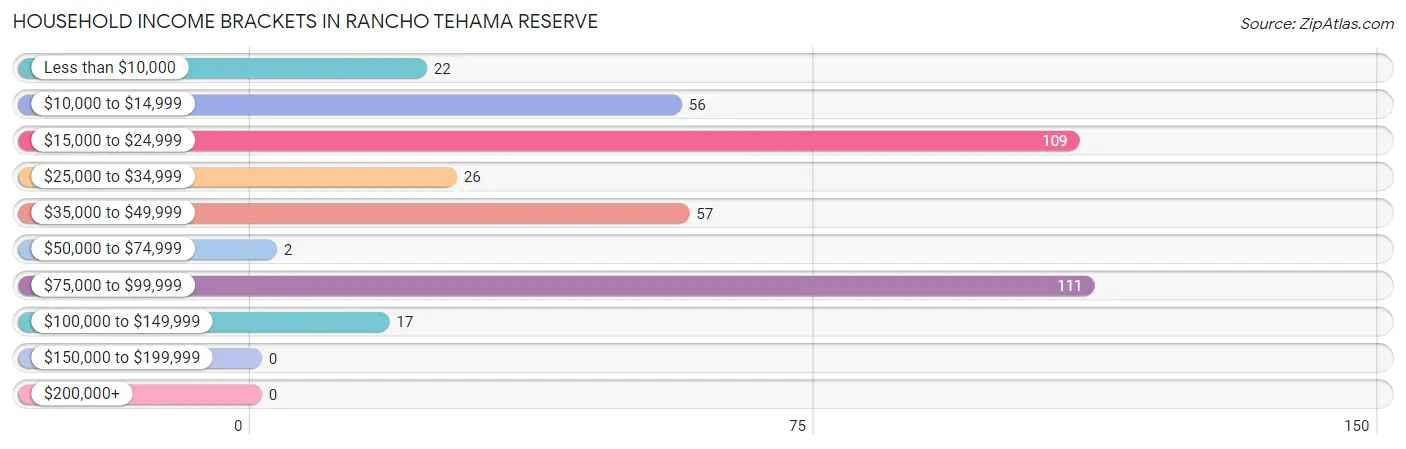
| Income Bracket | # Households | % Households |
| Less than $10,000 | 22 | 5.5% |
| $10,000 to $14,999 | 56 | 14.0% |
| $15,000 to $24,999 | 109 | 27.3% |
| $25,000 to $34,999 | 26 | 6.5% |
| $35,000 to $49,999 | 57 | 14.3% |
| $50,000 to $74,999 | 2 | 0.5% |
| $75,000 to $99,999 | 111 | 27.8% |
| $100,000 to $149,999 | 17 | 4.3% |
| $150,000 to $199,999 | 0 | 0.0% |
| $200,000+ | 0 | 0.0% |
Household Income by Householder Age in Rancho Tehama Reserve
The median household income in Rancho Tehama Reserve is $28,889, with the highest median household income of $19,973 found in the 65+ years age bracket for the primary householder. A total of 207 households (51.7%) fall into this category. Meanwhile, the 15 to 24 years age bracket for the primary householder has the lowest median household income of $0, with 97 households (24.2%) in this group.
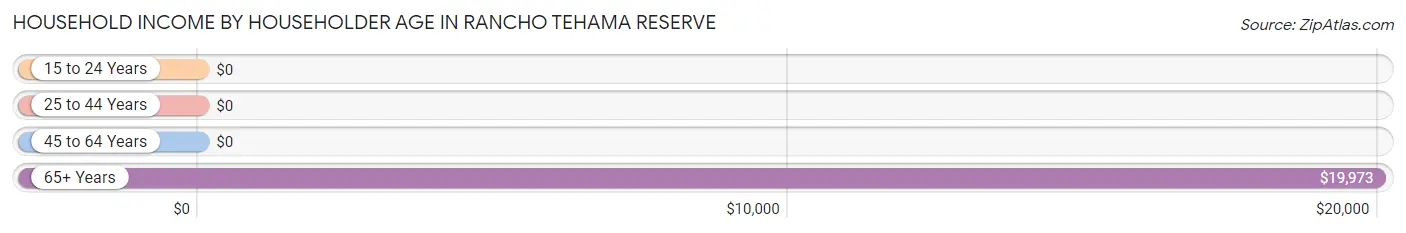
| Income Bracket | # Households | Median Income |
| 15 to 24 Years | 97 (24.2%) | $0 |
| 25 to 44 Years | 8 (2.0%) | $0 |
| 45 to 64 Years | 88 (22.0%) | $0 |
| 65+ Years | 207 (51.7%) | $19,973 |
| Total | 400 (100.0%) | $28,889 |
Poverty in Rancho Tehama Reserve
Income Below Poverty by Sex and Age in Rancho Tehama Reserve
With 37.9% poverty level for males and 45.3% for females among the residents of Rancho Tehama Reserve, under 5 year old males and under 5 year old females are the most vulnerable to poverty, with 41 males (100.0%) and 71 females (100.0%) in their respective age groups living below the poverty level.
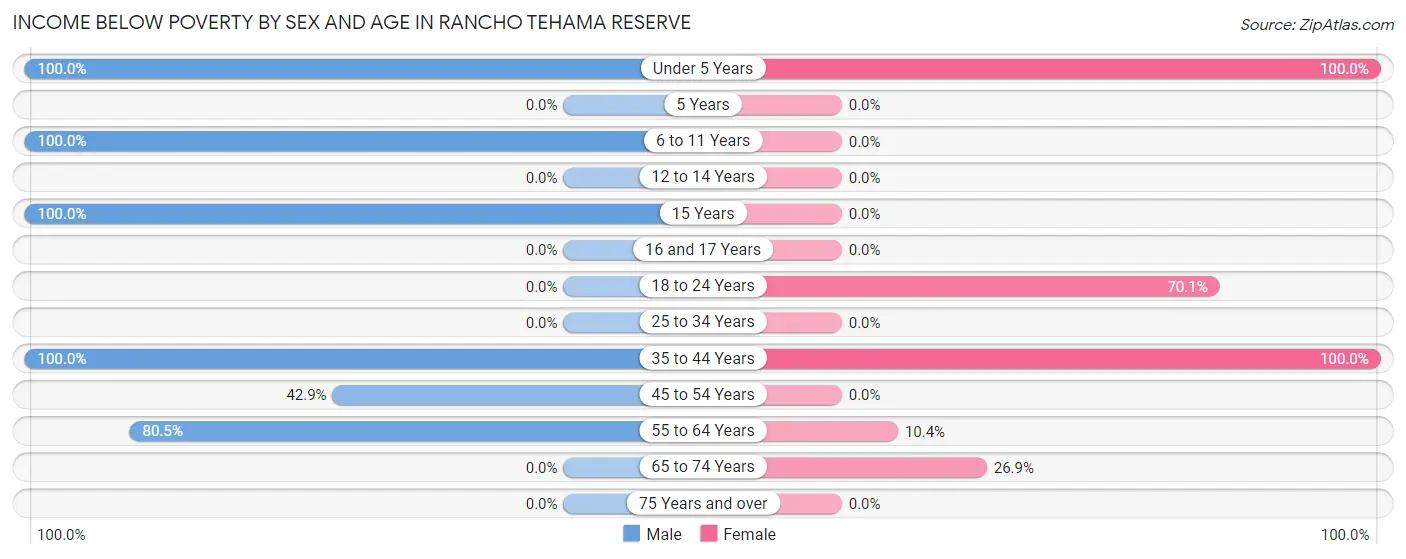
| Age Bracket | Male | Female |
| Under 5 Years | 41 (100.0%) | 71 (100.0%) |
| 5 Years | 0 (0.0%) | 0 (0.0%) |
| 6 to 11 Years | 22 (100.0%) | 0 (0.0%) |
| 12 to 14 Years | 0 (0.0%) | 0 (0.0%) |
| 15 Years | 10 (100.0%) | 0 (0.0%) |
| 16 and 17 Years | 0 (0.0%) | 0 (0.0%) |
| 18 to 24 Years | 0 (0.0%) | 68 (70.1%) |
| 25 to 34 Years | 0 (0.0%) | 0 (0.0%) |
| 35 to 44 Years | 6 (100.0%) | 8 (100.0%) |
| 45 to 54 Years | 9 (42.9%) | 0 (0.0%) |
| 55 to 64 Years | 62 (80.5%) | 5 (10.4%) |
| 65 to 74 Years | 0 (0.0%) | 28 (26.9%) |
| 75 Years and over | 0 (0.0%) | 0 (0.0%) |
| Total | 150 (37.9%) | 180 (45.3%) |
Income Above Poverty by Sex and Age in Rancho Tehama Reserve
According to the poverty statistics in Rancho Tehama Reserve, males aged 25 to 34 years and females aged 25 to 34 years are the age groups that are most secure financially, with 100.0% of males and 100.0% of females in these age groups living above the poverty line.
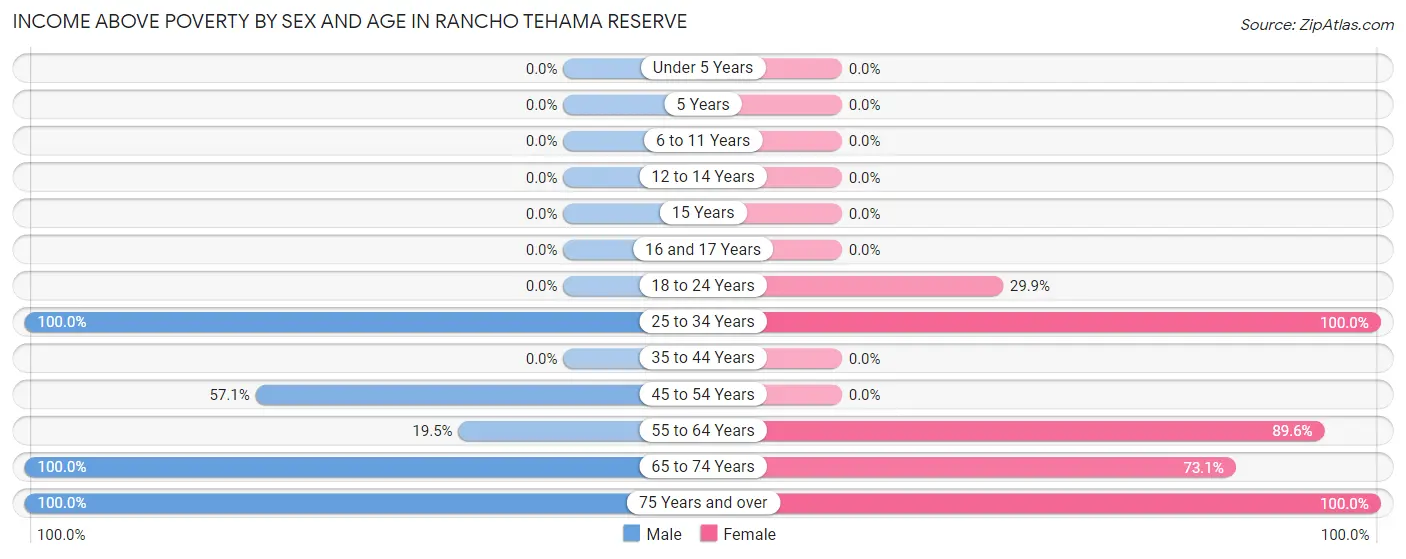
| Age Bracket | Male | Female |
| Under 5 Years | 0 (0.0%) | 0 (0.0%) |
| 5 Years | 0 (0.0%) | 0 (0.0%) |
| 6 to 11 Years | 0 (0.0%) | 0 (0.0%) |
| 12 to 14 Years | 0 (0.0%) | 0 (0.0%) |
| 15 Years | 0 (0.0%) | 0 (0.0%) |
| 16 and 17 Years | 0 (0.0%) | 0 (0.0%) |
| 18 to 24 Years | 0 (0.0%) | 29 (29.9%) |
| 25 to 34 Years | 89 (100.0%) | 24 (100.0%) |
| 35 to 44 Years | 0 (0.0%) | 0 (0.0%) |
| 45 to 54 Years | 12 (57.1%) | 0 (0.0%) |
| 55 to 64 Years | 15 (19.5%) | 43 (89.6%) |
| 65 to 74 Years | 98 (100.0%) | 76 (73.1%) |
| 75 Years and over | 32 (100.0%) | 45 (100.0%) |
| Total | 246 (62.1%) | 217 (54.7%) |
Income Below Poverty Among Married-Couple Families in Rancho Tehama Reserve
The poverty statistics for married-couple families in Rancho Tehama Reserve show that 10.9% or 12 of the total 110 families live below the poverty line. Families with 1 or 2 children have the highest poverty rate of 100.0%, comprising of 8 families. On the other hand, families with no children have the lowest poverty rate of 3.9%, which includes 4 families.
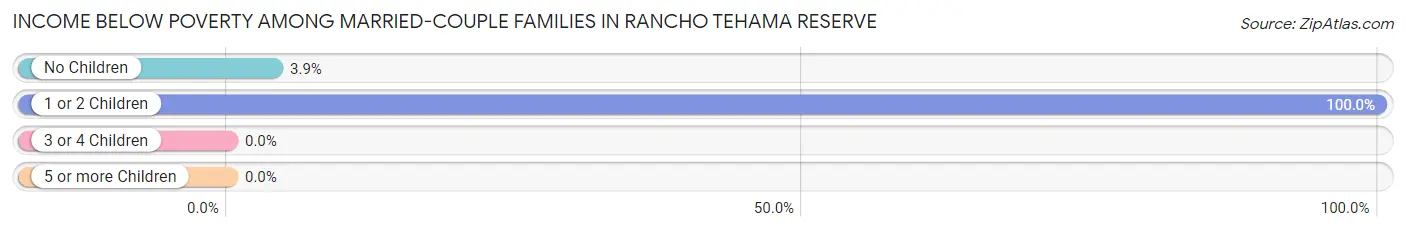
| Children | Above Poverty | Below Poverty |
| No Children | 98 (96.1%) | 4 (3.9%) |
| 1 or 2 Children | 0 (0.0%) | 8 (100.0%) |
| 3 or 4 Children | 0 (0.0%) | 0 (0.0%) |
| 5 or more Children | 0 (0.0%) | 0 (0.0%) |
| Total | 98 (89.1%) | 12 (10.9%) |
Income Below Poverty Among Single-Parent Households in Rancho Tehama Reserve
According to the poverty data in Rancho Tehama Reserve, 50.0% or 9 single-father households and 89.5% or 68 single-mother households are living below the poverty line. Among single-father households, those with 1 or 2 children have the highest poverty rate, with 9 households (100.0%) experiencing poverty. Likewise, among single-mother households, those with 1 or 2 children have the highest poverty rate, with 68 households (100.0%) falling below the poverty line.
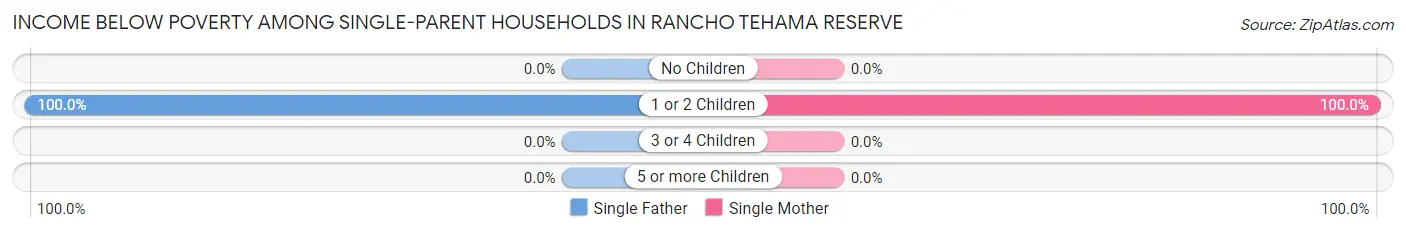
| Children | Single Father | Single Mother |
| No Children | 0 (0.0%) | 0 (0.0%) |
| 1 or 2 Children | 9 (100.0%) | 68 (100.0%) |
| 3 or 4 Children | 0 (0.0%) | 0 (0.0%) |
| 5 or more Children | 0 (0.0%) | 0 (0.0%) |
| Total | 9 (50.0%) | 68 (89.5%) |
Income Below Poverty Among Married-Couple vs Single-Parent Households in Rancho Tehama Reserve
The poverty data for Rancho Tehama Reserve shows that 12 of the married-couple family households (10.9%) and 77 of the single-parent households (81.9%) are living below the poverty level. Within the married-couple family households, those with 1 or 2 children have the highest poverty rate, with 8 households (100.0%) falling below the poverty line. Among the single-parent households, those with 1 or 2 children have the highest poverty rate, with 77 household (100.0%) living below poverty.
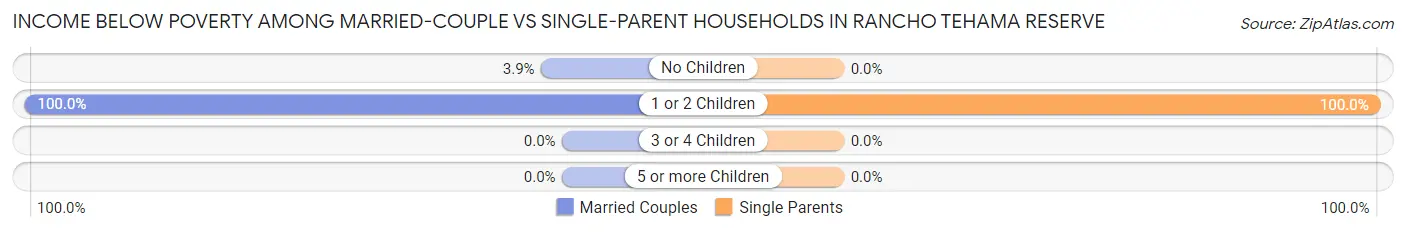
| Children | Married-Couple Families | Single-Parent Households |
| No Children | 4 (3.9%) | 0 (0.0%) |
| 1 or 2 Children | 8 (100.0%) | 77 (100.0%) |
| 3 or 4 Children | 0 (0.0%) | 0 (0.0%) |
| 5 or more Children | 0 (0.0%) | 0 (0.0%) |
| Total | 12 (10.9%) | 77 (81.9%) |
Race in Rancho Tehama Reserve
The most populous races in Rancho Tehama Reserve are White / Caucasian (633 | 79.8%), Two or more Races (133 | 16.8%), and Hispanic or Latino (75 | 9.5%).
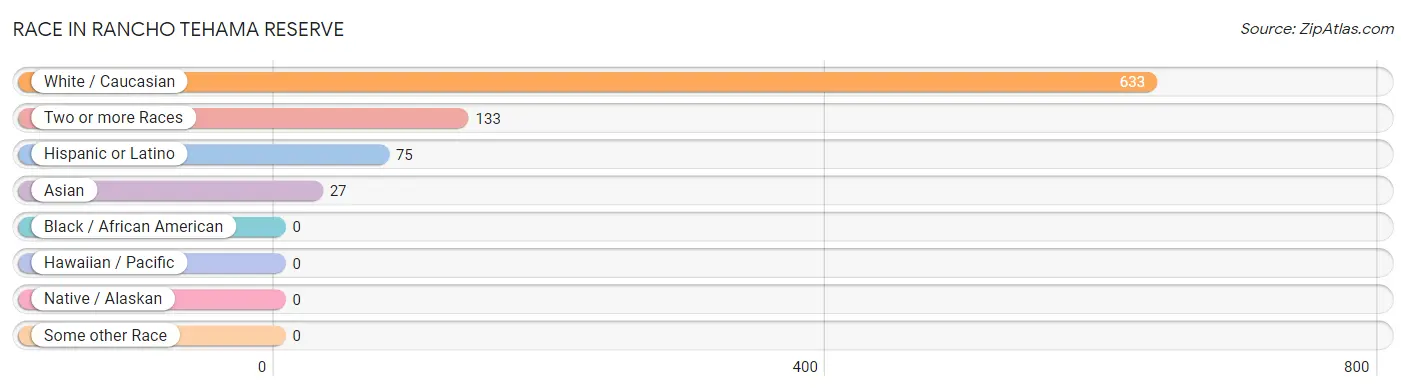
| Race | # Population | % Population |
| Asian | 27 | 3.4% |
| Black / African American | 0 | 0.0% |
| Hawaiian / Pacific | 0 | 0.0% |
| Hispanic or Latino | 75 | 9.5% |
| Native / Alaskan | 0 | 0.0% |
| White / Caucasian | 633 | 79.8% |
| Two or more Races | 133 | 16.8% |
| Some other Race | 0 | 0.0% |
| Total | 793 | 100.0% |
Ancestry in Rancho Tehama Reserve
The most populous ancestries reported in Rancho Tehama Reserve are German (311 | 39.2%), Irish (289 | 36.4%), Norwegian (80 | 10.1%), English (79 | 10.0%), and Mexican (63 | 7.9%), together accounting for 103.6% of all Rancho Tehama Reserve residents.
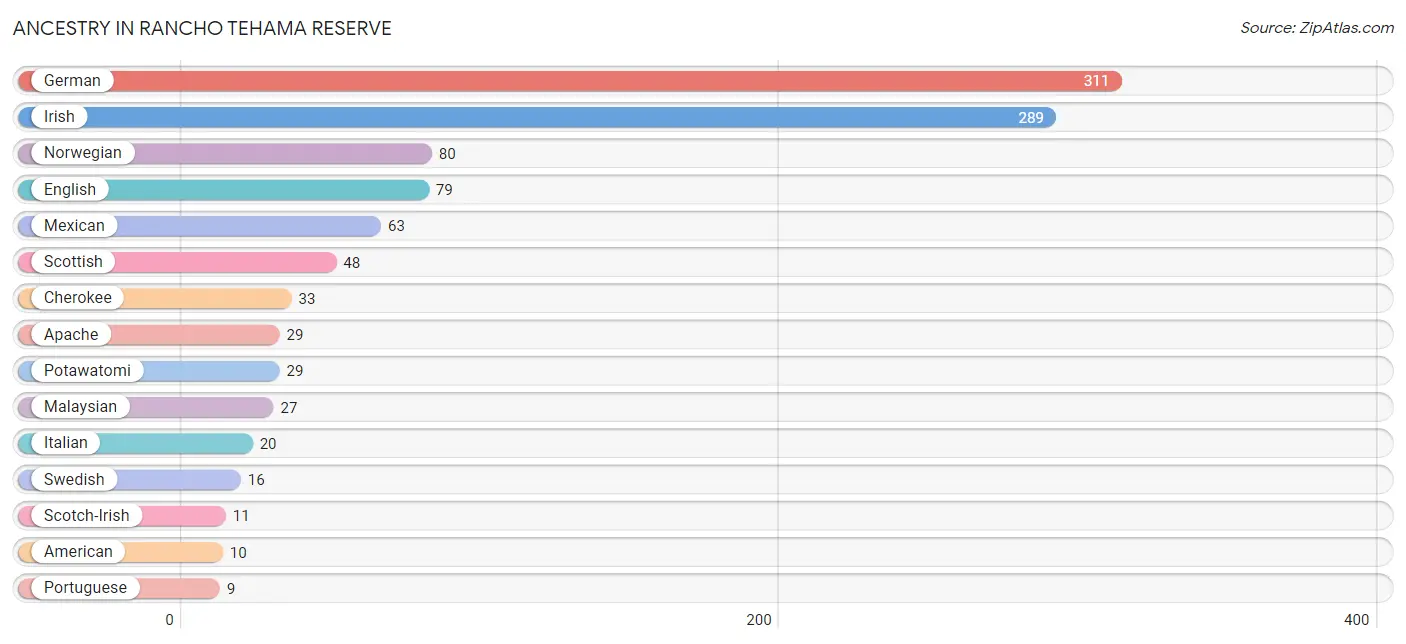
| Ancestry | # Population | % Population |
| Alaska Native | 1 | 0.1% |
| American | 10 | 1.3% |
| Apache | 29 | 3.7% |
| Cherokee | 33 | 4.2% |
| English | 79 | 10.0% |
| German | 311 | 39.2% |
| Irish | 289 | 36.4% |
| Italian | 20 | 2.5% |
| Malaysian | 27 | 3.4% |
| Mexican | 63 | 7.9% |
| Mexican American Indian | 8 | 1.0% |
| Norwegian | 80 | 10.1% |
| Portuguese | 9 | 1.1% |
| Potawatomi | 29 | 3.7% |
| Scotch-Irish | 11 | 1.4% |
| Scottish | 48 | 6.0% |
| Sioux | 9 | 1.1% |
| Swedish | 16 | 2.0% | View All 18 Rows |
Immigrants in Rancho Tehama Reserve
The most numerous immigrant groups reported in Rancho Tehama Reserve came from Central America (53 | 6.7%), Latin America (53 | 6.7%), Mexico (53 | 6.7%), Asia (27 | 3.4%), and Laos (27 | 3.4%), together accounting for 26.8% of all Rancho Tehama Reserve residents.
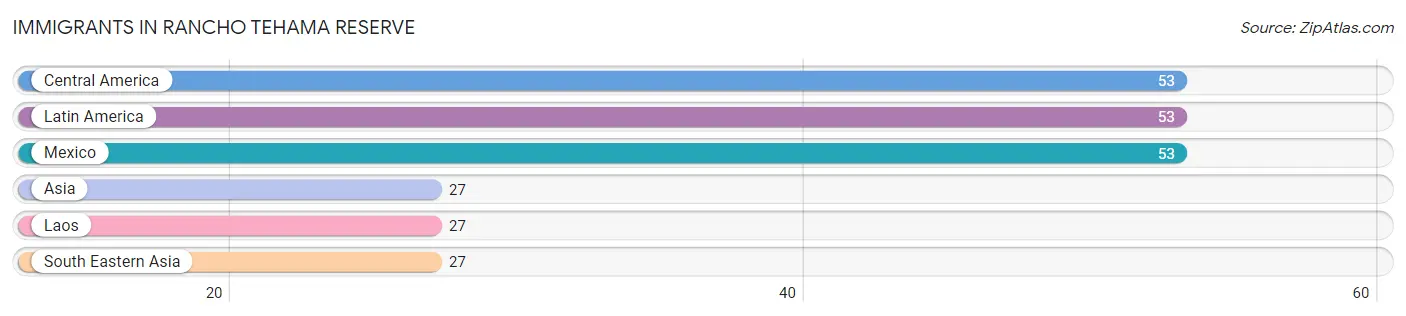
| Immigration Origin | # Population | % Population |
| Asia | 27 | 3.4% |
| Central America | 53 | 6.7% |
| Laos | 27 | 3.4% |
| Latin America | 53 | 6.7% |
| Mexico | 53 | 6.7% |
| South Eastern Asia | 27 | 3.4% | View All 6 Rows |
Sex and Age in Rancho Tehama Reserve
Sex and Age in Rancho Tehama Reserve
The most populous age groups in Rancho Tehama Reserve are 30 to 34 Years (65 | 16.4%) for men and 20 to 24 Years (97 | 24.4%) for women.
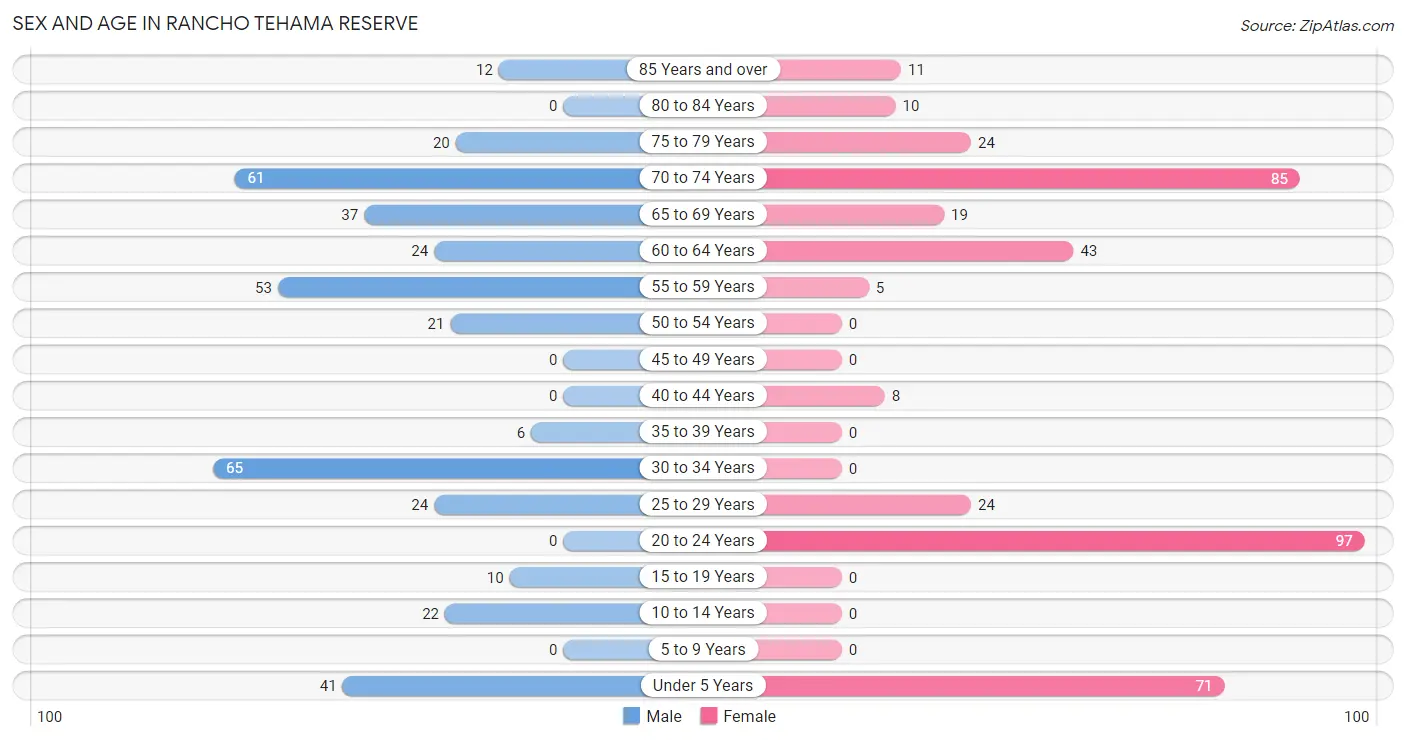
| Age Bracket | Male | Female |
| Under 5 Years | 41 (10.3%) | 71 (17.9%) |
| 5 to 9 Years | 0 (0.0%) | 0 (0.0%) |
| 10 to 14 Years | 22 (5.6%) | 0 (0.0%) |
| 15 to 19 Years | 10 (2.5%) | 0 (0.0%) |
| 20 to 24 Years | 0 (0.0%) | 97 (24.4%) |
| 25 to 29 Years | 24 (6.1%) | 24 (6.0%) |
| 30 to 34 Years | 65 (16.4%) | 0 (0.0%) |
| 35 to 39 Years | 6 (1.5%) | 0 (0.0%) |
| 40 to 44 Years | 0 (0.0%) | 8 (2.0%) |
| 45 to 49 Years | 0 (0.0%) | 0 (0.0%) |
| 50 to 54 Years | 21 (5.3%) | 0 (0.0%) |
| 55 to 59 Years | 53 (13.4%) | 5 (1.3%) |
| 60 to 64 Years | 24 (6.1%) | 43 (10.8%) |
| 65 to 69 Years | 37 (9.3%) | 19 (4.8%) |
| 70 to 74 Years | 61 (15.4%) | 85 (21.4%) |
| 75 to 79 Years | 20 (5.1%) | 24 (6.0%) |
| 80 to 84 Years | 0 (0.0%) | 10 (2.5%) |
| 85 Years and over | 12 (3.0%) | 11 (2.8%) |
| Total | 396 (100.0%) | 397 (100.0%) |
Families and Households in Rancho Tehama Reserve
Median Family Size in Rancho Tehama Reserve
The median family size in Rancho Tehama Reserve is 2.47 persons per family, with single male/father families (18 | 8.8%) accounting for the largest median family size of 3.44 persons per family. On the other hand, married-couple families (110 | 53.9%) represent the smallest median family size with 2.19 persons per family.
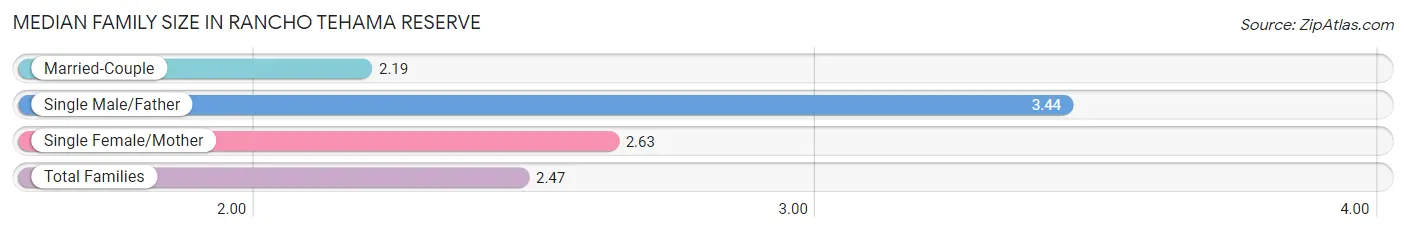
| Family Type | # Families | Family Size |
| Married-Couple | 110 (53.9%) | 2.19 |
| Single Male/Father | 18 (8.8%) | 3.44 |
| Single Female/Mother | 76 (37.2%) | 2.63 |
| Total Families | 204 (100.0%) | 2.47 |
Median Household Size in Rancho Tehama Reserve
The median household size in Rancho Tehama Reserve is 1.98 persons per household, with single male/father households (18 | 4.5%) accounting for the largest median household size of 3.44 persons per household. non-family households (196 | 49.0%) represent the smallest median household size with 1.05 persons per household.
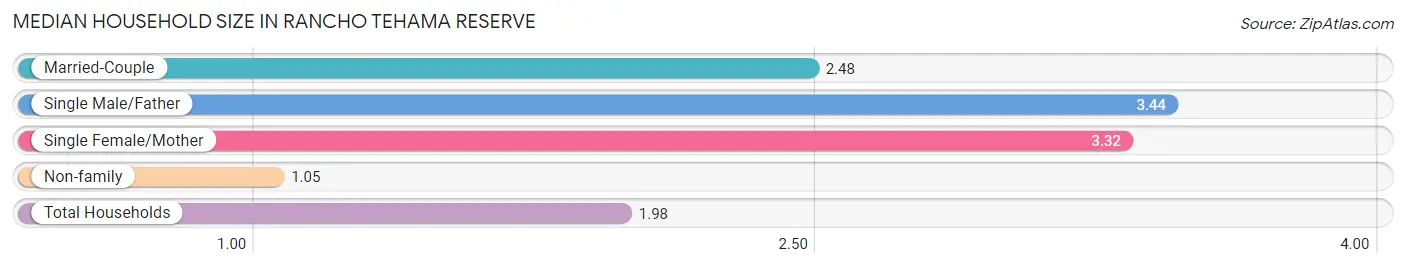
| Household Type | # Households | Household Size |
| Married-Couple | 110 (27.5%) | 2.48 |
| Single Male/Father | 18 (4.5%) | 3.44 |
| Single Female/Mother | 76 (19.0%) | 3.32 |
| Non-family | 196 (49.0%) | 1.05 |
| Total Households | 400 (100.0%) | 1.98 |
Household Size by Marriage Status in Rancho Tehama Reserve
Out of a total of 400 households in Rancho Tehama Reserve, 204 (51.0%) are family households, while 196 (49.0%) are nonfamily households. The most numerous type of family households are 2-person households, comprising 87, and the most common type of nonfamily households are 1-person households, comprising 183.
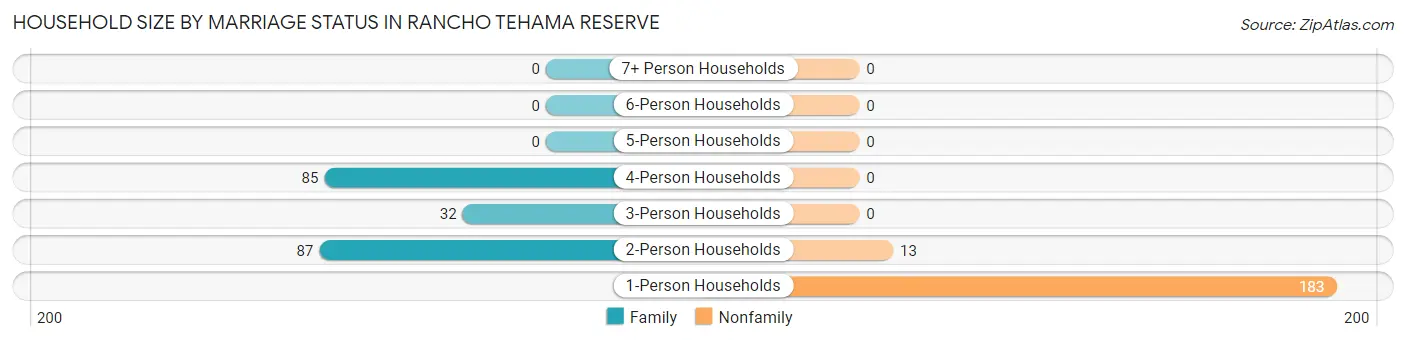
| Household Size | Family Households | Nonfamily Households |
| 1-Person Households | - | 183 (45.8%) |
| 2-Person Households | 87 (21.7%) | 13 (3.3%) |
| 3-Person Households | 32 (8.0%) | 0 (0.0%) |
| 4-Person Households | 85 (21.2%) | 0 (0.0%) |
| 5-Person Households | 0 (0.0%) | 0 (0.0%) |
| 6-Person Households | 0 (0.0%) | 0 (0.0%) |
| 7+ Person Households | 0 (0.0%) | 0 (0.0%) |
| Total | 204 (51.0%) | 196 (49.0%) |
Female Fertility in Rancho Tehama Reserve
Fertility by Age in Rancho Tehama Reserve
Average fertility rate in Rancho Tehama Reserve is 527.0 births per 1,000 women. Women in the age bracket of 20 to 34 years have the highest fertility rate with 562.0 births per 1,000 women. Women in the age bracket of 20 to 34 years acount for 100.0% of all women with births.
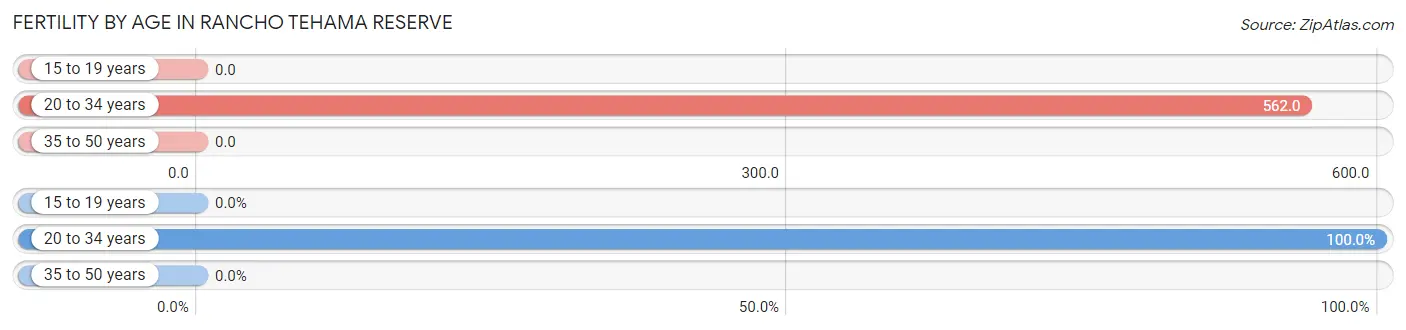
| Age Bracket | Women with Births | Births / 1,000 Women |
| 15 to 19 years | 0 (0.0%) | 0.0 |
| 20 to 34 years | 68 (100.0%) | 562.0 |
| 35 to 50 years | 0 (0.0%) | 0.0 |
| Total | 68 (100.0%) | 527.0 |
Fertility by Age by Marriage Status in Rancho Tehama Reserve
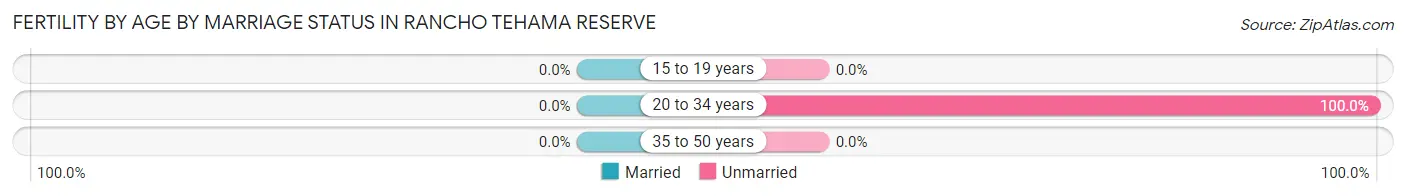
| Age Bracket | Married | Unmarried |
| 15 to 19 years | 0 (0.0%) | 0 (0.0%) |
| 20 to 34 years | 0 (0.0%) | 68 (100.0%) |
| 35 to 50 years | 0 (0.0%) | 0 (0.0%) |
| Total | 0 (0.0%) | 68 (100.0%) |
Fertility by Education in Rancho Tehama Reserve
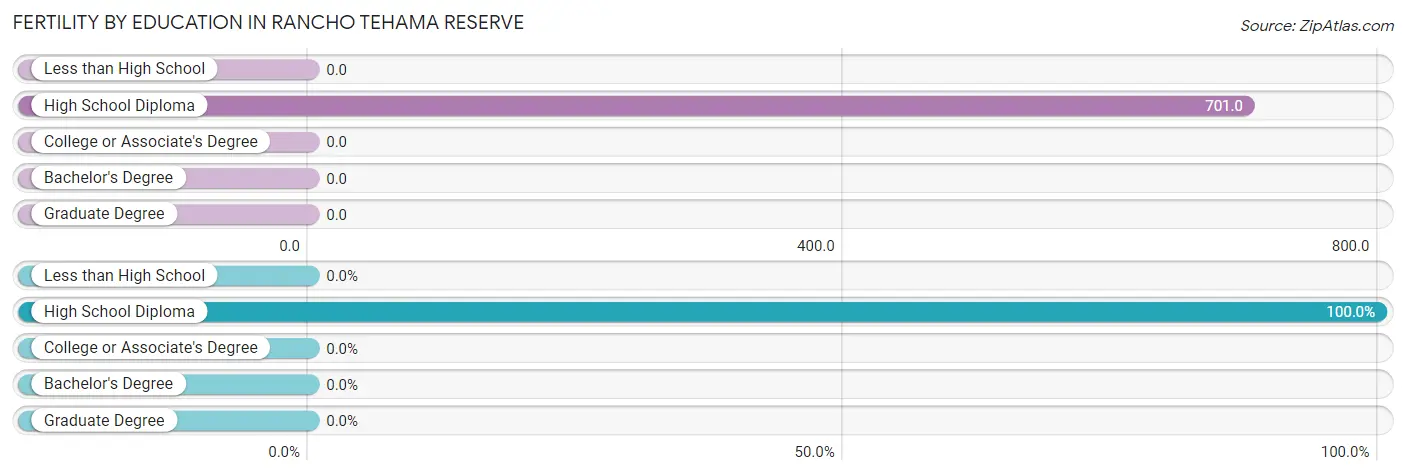
| Educational Attainment | Women with Births | Births / 1,000 Women |
| Less than High School | 0 (0.0%) | 0.0 |
| High School Diploma | 68 (100.0%) | 701.0 |
| College or Associate's Degree | 0 (0.0%) | 0.0 |
| Bachelor's Degree | 0 (0.0%) | 0.0 |
| Graduate Degree | 0 (0.0%) | 0.0 |
| Total | 68 (100.0%) | 527.0 |
Fertility by Education by Marriage Status in Rancho Tehama Reserve
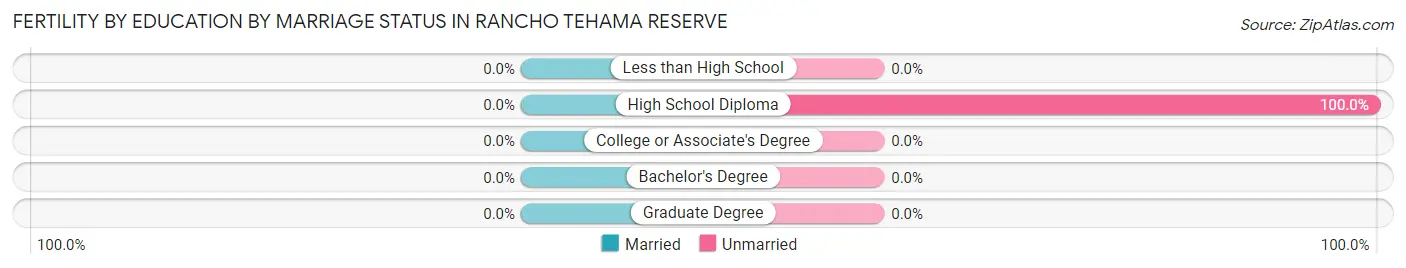
| Educational Attainment | Married | Unmarried |
| Less than High School | 0 (0.0%) | 0 (0.0%) |
| High School Diploma | 0 (0.0%) | 68 (100.0%) |
| College or Associate's Degree | 0 (0.0%) | 0 (0.0%) |
| Bachelor's Degree | 0 (0.0%) | 0 (0.0%) |
| Graduate Degree | 0 (0.0%) | 0 (0.0%) |
| Total | 0 (0.0%) | 68 (100.0%) |
Employment Characteristics in Rancho Tehama Reserve
Employment by Class of Employer in Rancho Tehama Reserve
Among the 120 employed individuals in Rancho Tehama Reserve, private company employees (103 | 85.8%), state government employees (9 | 7.5%), and federal government employees (8 | 6.7%) make up the most common classes of employment.
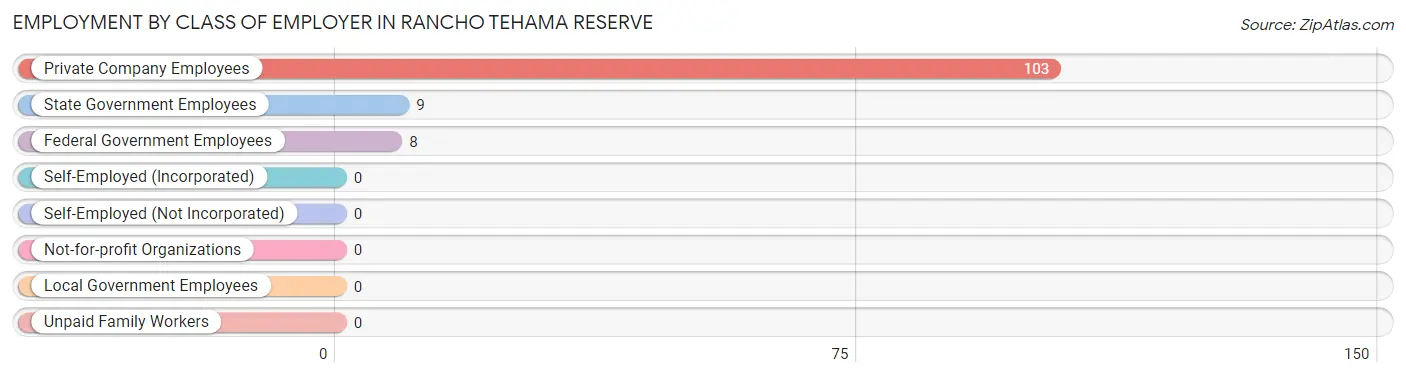
| Employer Class | # Employees | % Employees |
| Private Company Employees | 103 | 85.8% |
| Self-Employed (Incorporated) | 0 | 0.0% |
| Self-Employed (Not Incorporated) | 0 | 0.0% |
| Not-for-profit Organizations | 0 | 0.0% |
| Local Government Employees | 0 | 0.0% |
| State Government Employees | 9 | 7.5% |
| Federal Government Employees | 8 | 6.7% |
| Unpaid Family Workers | 0 | 0.0% |
| Total | 120 | 100.0% |
Employment Status by Age in Rancho Tehama Reserve
According to the labor force statistics for Rancho Tehama Reserve, out of the total population over 16 years of age (649), 19.9% or 129 individuals are in the labor force, with 7.4% or 10 of them unemployed. The age group with the highest labor force participation rate is 30 to 34 years, with 100.0% or 65 individuals in the labor force. Within the labor force, the 45 to 54 years age range has the highest percentage of unemployed individuals, with 100.0% or 9 of them being unemployed.
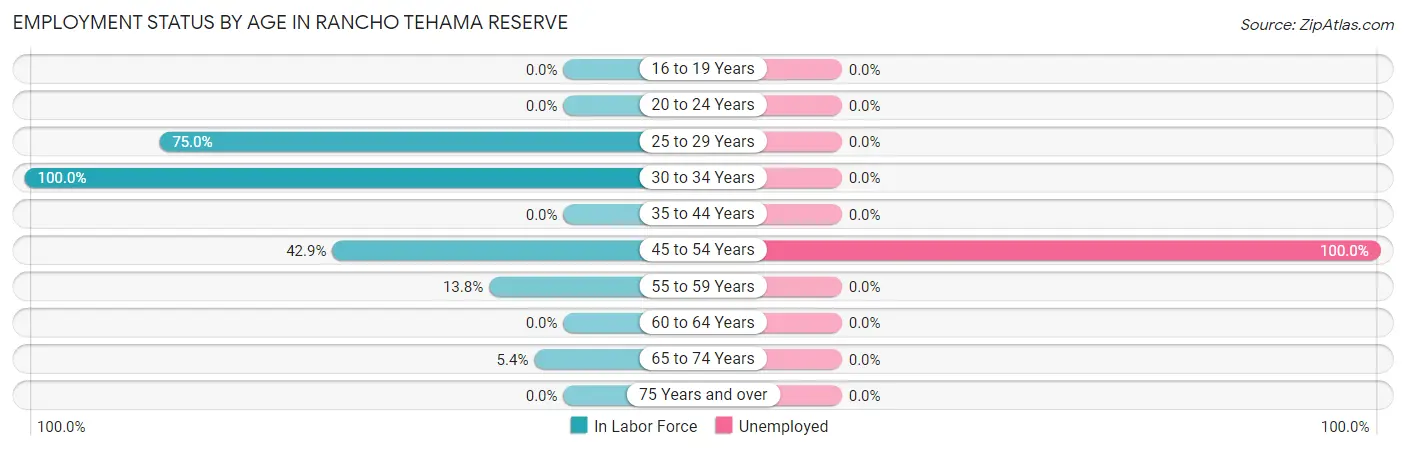
| Age Bracket | In Labor Force | Unemployed |
| 16 to 19 Years | 0 (0.0%) | 0 (0.0%) |
| 20 to 24 Years | 0 (0.0%) | 0 (0.0%) |
| 25 to 29 Years | 36 (75.0%) | 0 (0.0%) |
| 30 to 34 Years | 65 (100.0%) | 0 (0.0%) |
| 35 to 44 Years | 0 (0.0%) | 0 (0.0%) |
| 45 to 54 Years | 9 (42.9%) | 9 (100.0%) |
| 55 to 59 Years | 8 (13.8%) | 0 (0.0%) |
| 60 to 64 Years | 0 (0.0%) | 0 (0.0%) |
| 65 to 74 Years | 11 (5.4%) | 0 (0.0%) |
| 75 Years and over | 0 (0.0%) | 0 (0.0%) |
| Total | 129 (19.9%) | 10 (7.4%) |
Employment Status by Educational Attainment in Rancho Tehama Reserve
According to labor force statistics for Rancho Tehama Reserve, 43.2% of individuals (118) out of the total population between 25 and 64 years of age (273) are in the labor force, with 8.2% or 10 of them being unemployed. The group with the highest labor force participation rate are those with the educational attainment of high school diploma, with 70.5% or 98 individuals in the labor force. Within the labor force, individuals with high school diploma education have the highest percentage of unemployment, with 9.2% or 9 of them being unemployed.
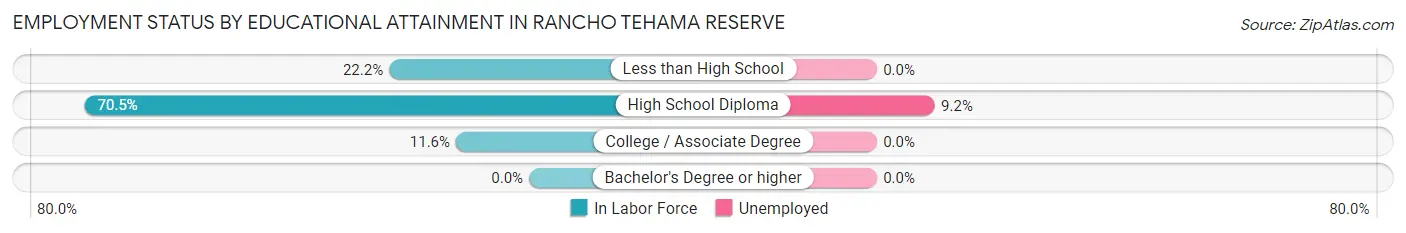
| Educational Attainment | In Labor Force | Unemployed |
| Less than High School | 12 (22.2%) | 0 (0.0%) |
| High School Diploma | 98 (70.5%) | 13 (9.2%) |
| College / Associate Degree | 8 (11.6%) | 0 (0.0%) |
| Bachelor's Degree or higher | 0 (0.0%) | 0 (0.0%) |
| Total | 118 (43.2%) | 22 (8.2%) |
Employment Occupations by Sex in Rancho Tehama Reserve
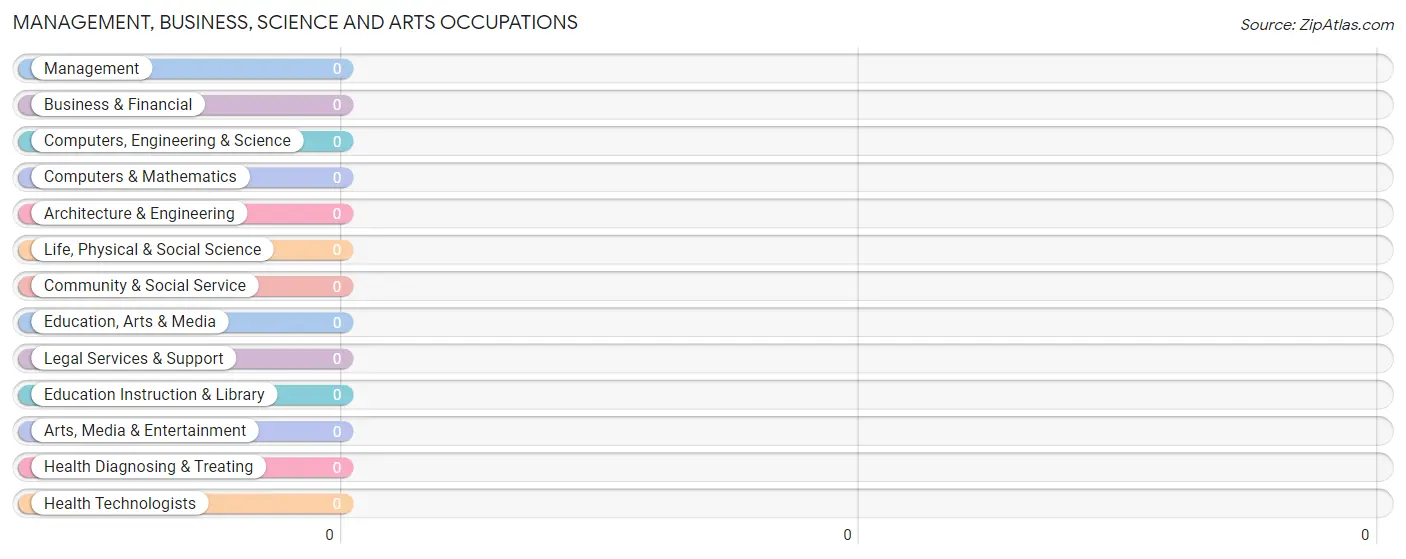
Management, Business, Science and Arts Occupations
Management, Business, Science and Arts Occupations by Sex
| Occupation | Male | Female |
| Management | 0 (0.0%) | 0 (0.0%) |
| Business & Financial | 0 (0.0%) | 0 (0.0%) |
| Computers, Engineering & Science | 0 (0.0%) | 0 (0.0%) |
| Computers & Mathematics | 0 (0.0%) | 0 (0.0%) |
| Architecture & Engineering | 0 (0.0%) | 0 (0.0%) |
| Life, Physical & Social Science | 0 (0.0%) | 0 (0.0%) |
| Community & Social Service | 0 (0.0%) | 0 (0.0%) |
| Education, Arts & Media | 0 (0.0%) | 0 (0.0%) |
| Legal Services & Support | 0 (0.0%) | 0 (0.0%) |
| Education Instruction & Library | 0 (0.0%) | 0 (0.0%) |
| Arts, Media & Entertainment | 0 (0.0%) | 0 (0.0%) |
| Health Diagnosing & Treating | 0 (0.0%) | 0 (0.0%) |
| Health Technologists | 0 (0.0%) | 0 (0.0%) |
| Total (Category) | 0 (0.0%) | 0 (0.0%) |
| Total (Overall) | 91 (81.2%) | 21 (18.8%) |
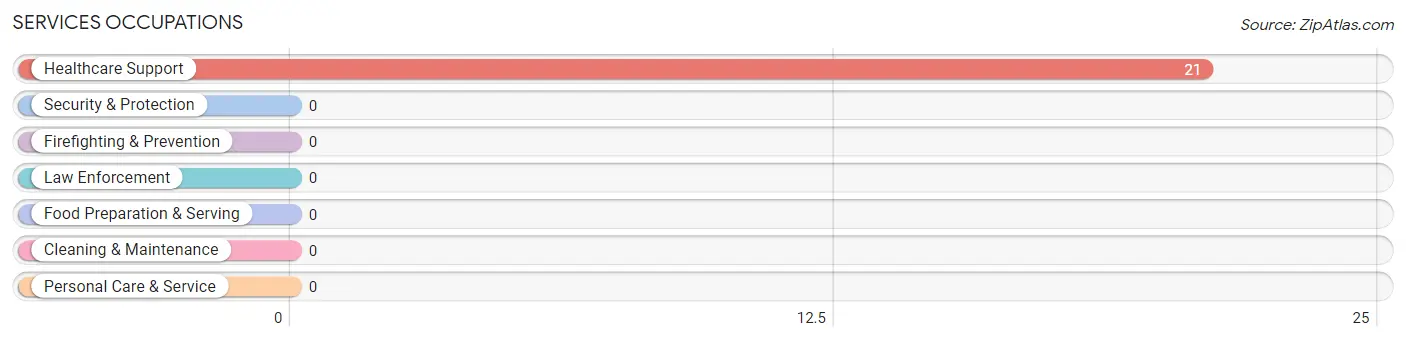
Services Occupations
The most common Services occupations in Rancho Tehama Reserve are , and Healthcare Support (21 | 18.8%).
Services Occupations by Sex
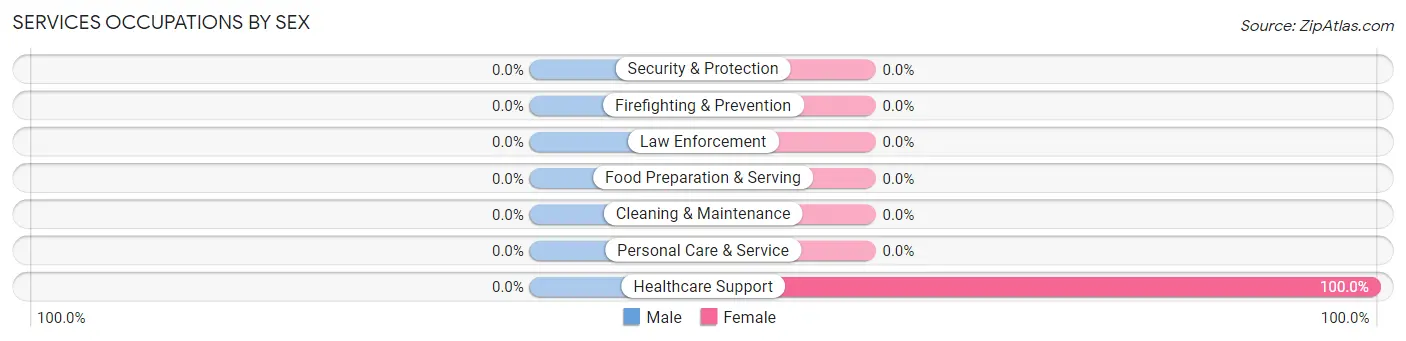
| Occupation | Male | Female |
| Healthcare Support | 0 (0.0%) | 21 (100.0%) |
| Security & Protection | 0 (0.0%) | 0 (0.0%) |
| Firefighting & Prevention | 0 (0.0%) | 0 (0.0%) |
| Law Enforcement | 0 (0.0%) | 0 (0.0%) |
| Food Preparation & Serving | 0 (0.0%) | 0 (0.0%) |
| Cleaning & Maintenance | 0 (0.0%) | 0 (0.0%) |
| Personal Care & Service | 0 (0.0%) | 0 (0.0%) |
| Total (Category) | 0 (0.0%) | 21 (100.0%) |
| Total (Overall) | 91 (81.2%) | 21 (18.8%) |
Sales and Office Occupations
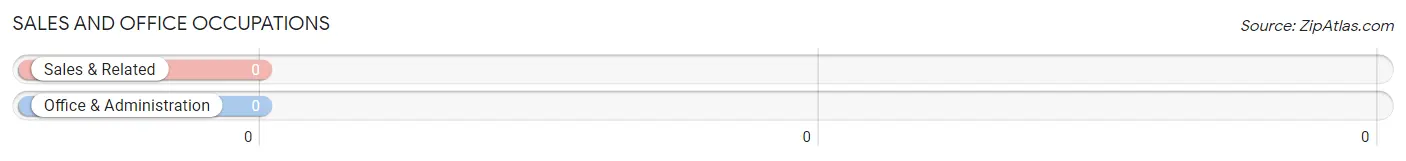
Sales and Office Occupations by Sex
| Occupation | Male | Female |
| Sales & Related | 0 (0.0%) | 0 (0.0%) |
| Office & Administration | 0 (0.0%) | 0 (0.0%) |
| Total (Category) | 0 (0.0%) | 0 (0.0%) |
| Total (Overall) | 91 (81.2%) | 21 (18.8%) |
Natural Resources, Construction and Maintenance Occupations
The most common Natural Resources, Construction and Maintenance occupations in Rancho Tehama Reserve are , and Construction & Extraction (26 | 23.2%).
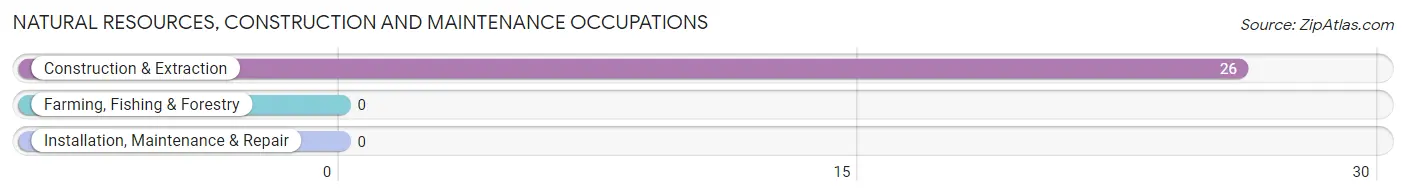
Natural Resources, Construction and Maintenance Occupations by Sex
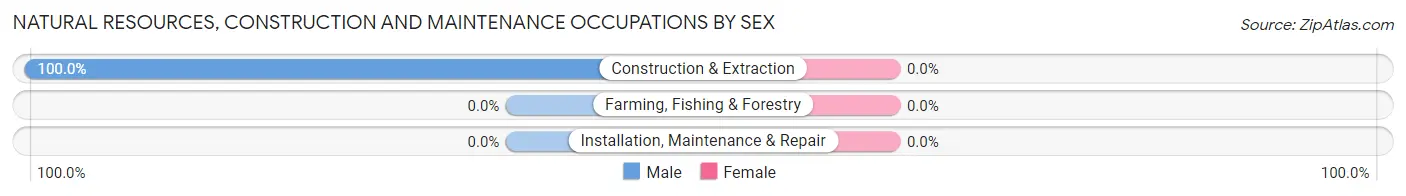
| Occupation | Male | Female |
| Farming, Fishing & Forestry | 0 (0.0%) | 0 (0.0%) |
| Construction & Extraction | 26 (100.0%) | 0 (0.0%) |
| Installation, Maintenance & Repair | 0 (0.0%) | 0 (0.0%) |
| Total (Category) | 26 (100.0%) | 0 (0.0%) |
| Total (Overall) | 91 (81.2%) | 21 (18.8%) |
Production, Transportation and Moving Occupations
The most common Production, Transportation and Moving occupations in Rancho Tehama Reserve are , and Production (65 | 58.0%).
Production, Transportation and Moving Occupations by Sex
| Occupation | Male | Female |
| Production | 65 (100.0%) | 0 (0.0%) |
| Transportation | 0 (0.0%) | 0 (0.0%) |
| Material Moving | 0 (0.0%) | 0 (0.0%) |
| Total (Category) | 65 (100.0%) | 0 (0.0%) |
| Total (Overall) | 91 (81.2%) | 21 (18.8%) |
Employment Industries by Sex in Rancho Tehama Reserve
Employment Industries in Rancho Tehama Reserve
The major employment industries in Rancho Tehama Reserve include Wholesale Trade (52 | 46.4%), Construction (26 | 23.2%), Manufacturing (13 | 11.6%), Health Care & Social Assistance (12 | 10.7%), and Public Administration (9 | 8.0%).
Employment Industries by Sex in Rancho Tehama Reserve
The Rancho Tehama Reserve industries that see more men than women are Construction (100.0%), Manufacturing (100.0%), and Wholesale Trade (100.0%), whereas the industries that tend to have a higher number of women are Health Care & Social Assistance (100.0%), and Public Administration (100.0%).
| Industry | Male | Female |
| Agriculture, Fishing & Hunting | 0 (0.0%) | 0 (0.0%) |
| Mining, Quarrying, & Extraction | 0 (0.0%) | 0 (0.0%) |
| Construction | 26 (100.0%) | 0 (0.0%) |
| Manufacturing | 13 (100.0%) | 0 (0.0%) |
| Wholesale Trade | 52 (100.0%) | 0 (0.0%) |
| Retail Trade | 0 (0.0%) | 0 (0.0%) |
| Transportation & Warehousing | 0 (0.0%) | 0 (0.0%) |
| Utilities | 0 (0.0%) | 0 (0.0%) |
| Information | 0 (0.0%) | 0 (0.0%) |
| Finance & Insurance | 0 (0.0%) | 0 (0.0%) |
| Real Estate, Rental & Leasing | 0 (0.0%) | 0 (0.0%) |
| Professional & Scientific | 0 (0.0%) | 0 (0.0%) |
| Enterprise Management | 0 (0.0%) | 0 (0.0%) |
| Administrative & Support | 0 (0.0%) | 0 (0.0%) |
| Educational Services | 0 (0.0%) | 0 (0.0%) |
| Health Care & Social Assistance | 0 (0.0%) | 12 (100.0%) |
| Arts, Entertainment & Recreation | 0 (0.0%) | 0 (0.0%) |
| Accommodation & Food Services | 0 (0.0%) | 0 (0.0%) |
| Public Administration | 0 (0.0%) | 9 (100.0%) |
| Total | 91 (81.2%) | 21 (18.8%) |
Education in Rancho Tehama Reserve
School Enrollment in Rancho Tehama Reserve
The most common levels of schooling among the 40 students in Rancho Tehama Reserve are middle school (15 | 37.5%), high school (10 | 25.0%), and college / undergraduate (8 | 20.0%).
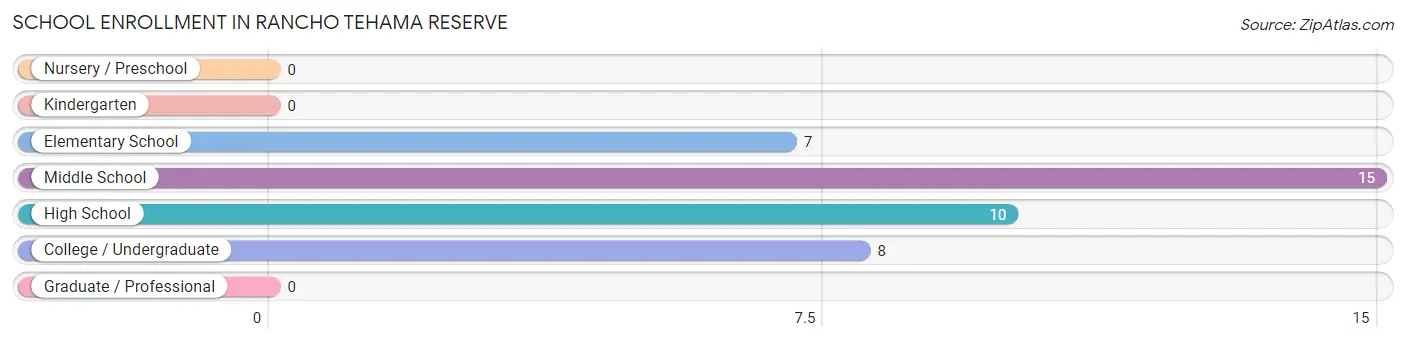
| School Level | # Students | % Students |
| Nursery / Preschool | 0 | 0.0% |
| Kindergarten | 0 | 0.0% |
| Elementary School | 7 | 17.5% |
| Middle School | 15 | 37.5% |
| High School | 10 | 25.0% |
| College / Undergraduate | 8 | 20.0% |
| Graduate / Professional | 0 | 0.0% |
| Total | 40 | 100.0% |
School Enrollment by Age by Funding Source in Rancho Tehama Reserve
Out of a total of 40 students who are enrolled in schools in Rancho Tehama Reserve, 25 (62.5%) attend a private institution, while the remaining 15 (37.5%) are enrolled in public schools. The age group of 15 to 17 year olds has the highest likelihood of being enrolled in private schools, with 10 (100.0% in the age bracket) enrolled. Conversely, the age group of 35 years and over has the lowest likelihood of being enrolled in a private school, with 8 (100.0% in the age bracket) attending a public institution.
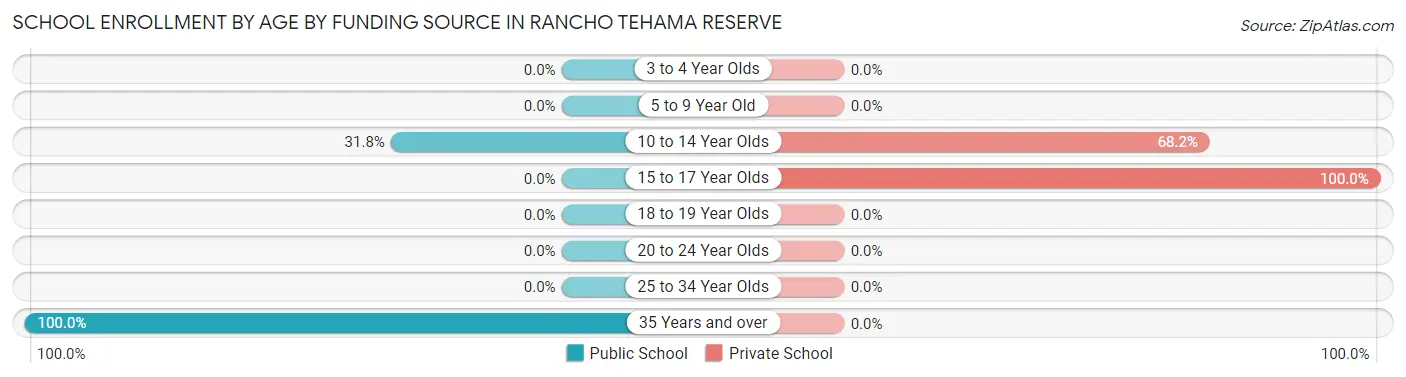
| Age Bracket | Public School | Private School |
| 3 to 4 Year Olds | 0 (0.0%) | 0 (0.0%) |
| 5 to 9 Year Old | 0 (0.0%) | 0 (0.0%) |
| 10 to 14 Year Olds | 7 (31.8%) | 15 (68.2%) |
| 15 to 17 Year Olds | 0 (0.0%) | 10 (100.0%) |
| 18 to 19 Year Olds | 0 (0.0%) | 0 (0.0%) |
| 20 to 24 Year Olds | 0 (0.0%) | 0 (0.0%) |
| 25 to 34 Year Olds | 0 (0.0%) | 0 (0.0%) |
| 35 Years and over | 8 (100.0%) | 0 (0.0%) |
| Total | 15 (37.5%) | 25 (62.5%) |
Educational Attainment by Field of Study in Rancho Tehama Reserve
Science & technology (11 | 37.9%), business (10 | 34.5%), and computers & mathematics (8 | 27.6%) are the most common fields of study among 29 individuals in Rancho Tehama Reserve who have obtained a bachelor's degree or higher.
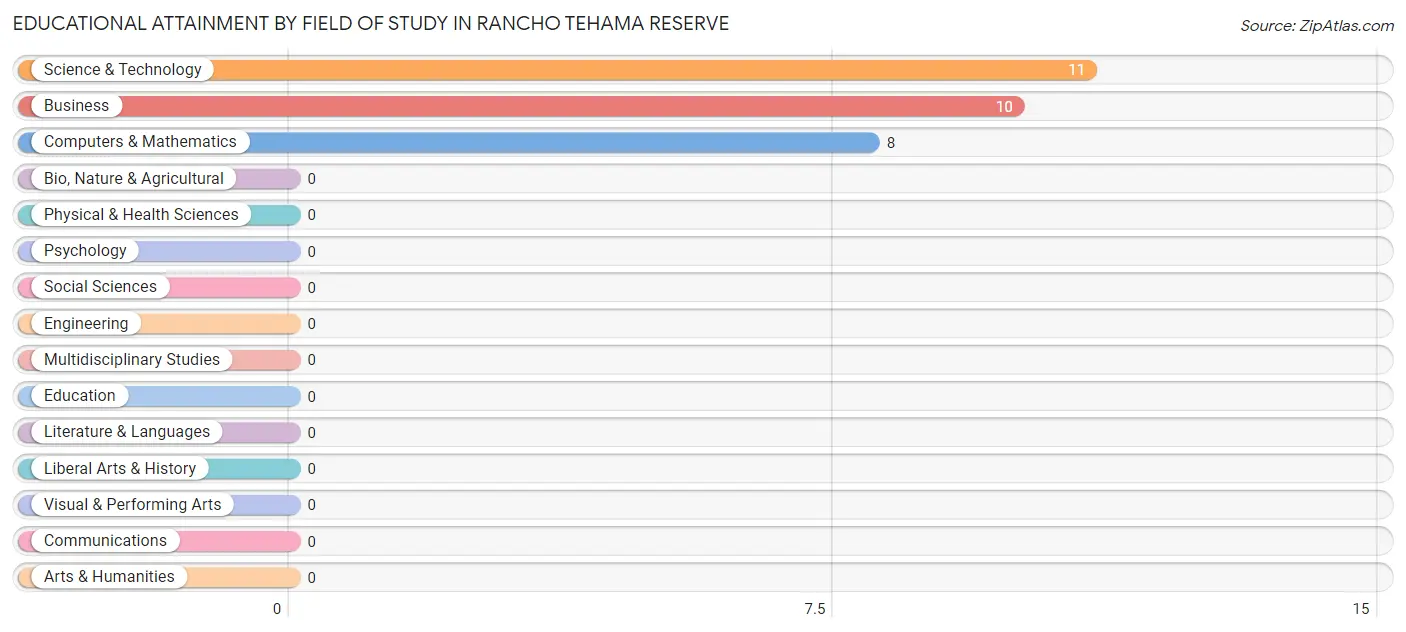
| Field of Study | # Graduates | % Graduates |
| Computers & Mathematics | 8 | 27.6% |
| Bio, Nature & Agricultural | 0 | 0.0% |
| Physical & Health Sciences | 0 | 0.0% |
| Psychology | 0 | 0.0% |
| Social Sciences | 0 | 0.0% |
| Engineering | 0 | 0.0% |
| Multidisciplinary Studies | 0 | 0.0% |
| Science & Technology | 11 | 37.9% |
| Business | 10 | 34.5% |
| Education | 0 | 0.0% |
| Literature & Languages | 0 | 0.0% |
| Liberal Arts & History | 0 | 0.0% |
| Visual & Performing Arts | 0 | 0.0% |
| Communications | 0 | 0.0% |
| Arts & Humanities | 0 | 0.0% |
| Total | 29 | 100.0% |
Transportation & Commute in Rancho Tehama Reserve
Vehicle Availability by Sex in Rancho Tehama Reserve
The most prevalent vehicle ownership categories in Rancho Tehama Reserve are males with 2 vehicles (60, accounting for 60.6%) and females with 2 vehicles (9, making up 285.7%).
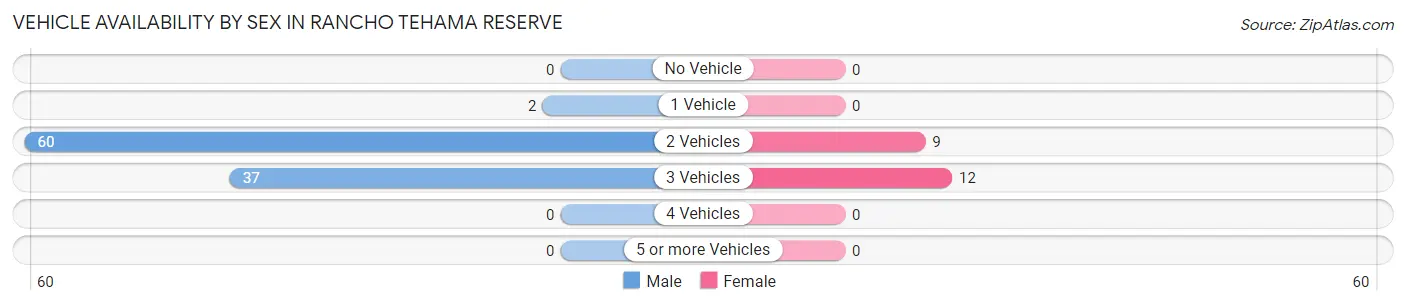
| Vehicles Available | Male | Female |
| No Vehicle | 0 (0.0%) | 0 (0.0%) |
| 1 Vehicle | 2 (2.0%) | 0 (0.0%) |
| 2 Vehicles | 60 (60.6%) | 9 (42.9%) |
| 3 Vehicles | 37 (37.4%) | 12 (57.1%) |
| 4 Vehicles | 0 (0.0%) | 0 (0.0%) |
| 5 or more Vehicles | 0 (0.0%) | 0 (0.0%) |
| Total | 99 (100.0%) | 21 (100.0%) |
Commute Time in Rancho Tehama Reserve
The most frequently occuring commute durations in Rancho Tehama Reserve are 40 to 44 minutes (60 commuters, 60.6%), 30 to 34 minutes (39 commuters, 39.4%), and less than 5 minutes (0 commuters, 0.0%).
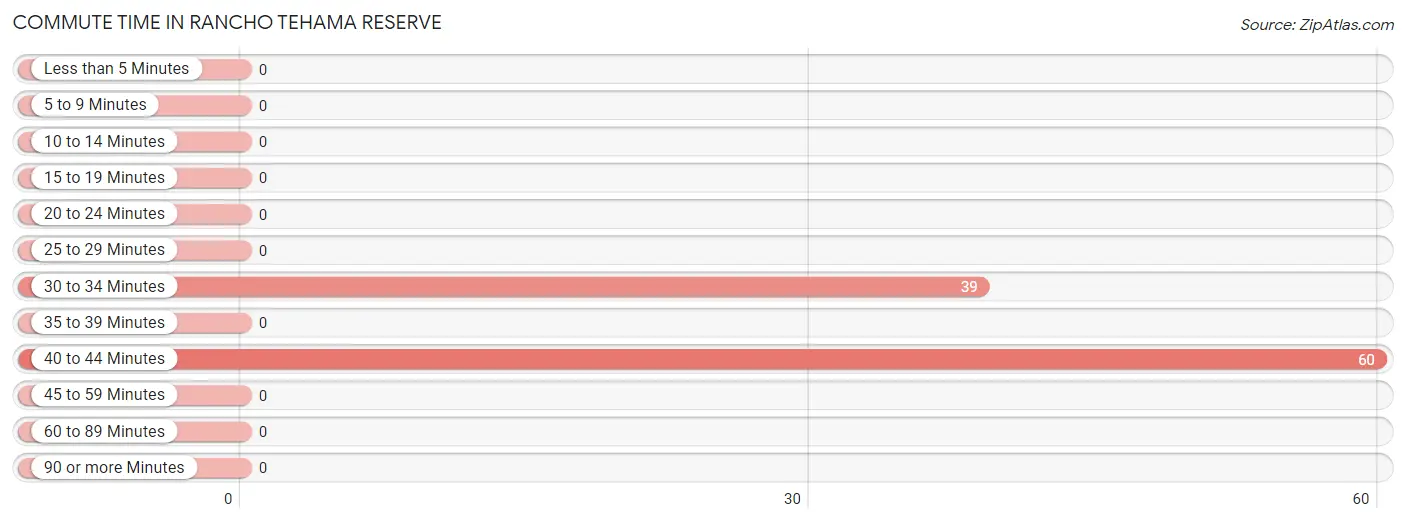
| Commute Time | # Commuters | % Commuters |
| Less than 5 Minutes | 0 | 0.0% |
| 5 to 9 Minutes | 0 | 0.0% |
| 10 to 14 Minutes | 0 | 0.0% |
| 15 to 19 Minutes | 0 | 0.0% |
| 20 to 24 Minutes | 0 | 0.0% |
| 25 to 29 Minutes | 0 | 0.0% |
| 30 to 34 Minutes | 39 | 39.4% |
| 35 to 39 Minutes | 0 | 0.0% |
| 40 to 44 Minutes | 60 | 60.6% |
| 45 to 59 Minutes | 0 | 0.0% |
| 60 to 89 Minutes | 0 | 0.0% |
| 90 or more Minutes | 0 | 0.0% |
Commute Time by Sex in Rancho Tehama Reserve
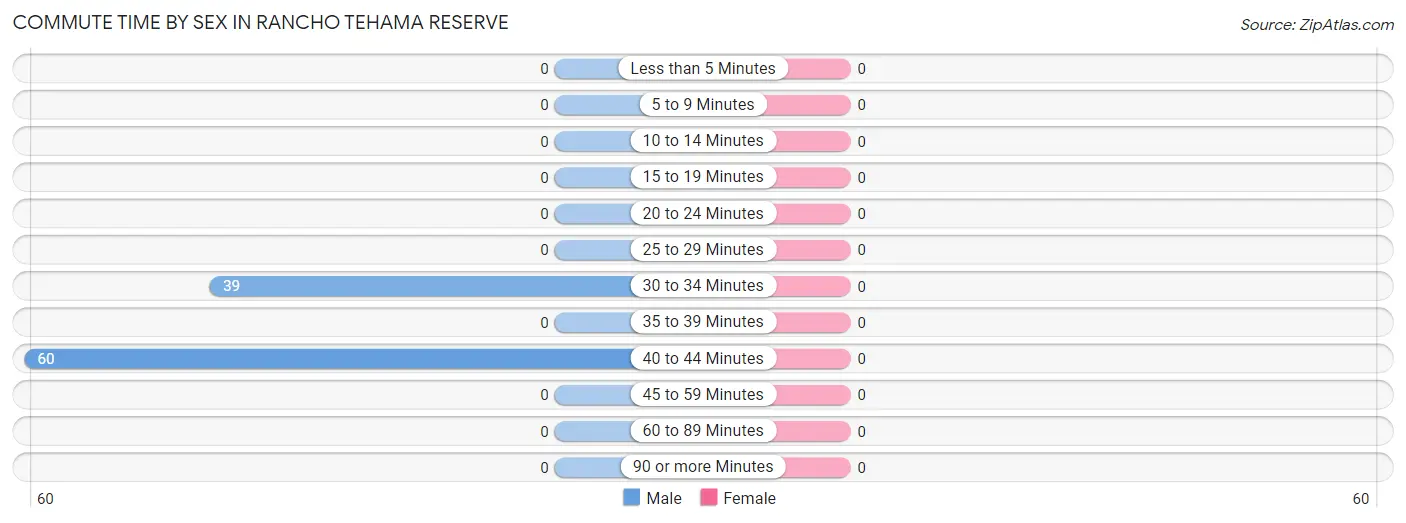
| Commute Time | Male | Female |
| Less than 5 Minutes | 0 (0.0%) | 0 (0.0%) |
| 5 to 9 Minutes | 0 (0.0%) | 0 (0.0%) |
| 10 to 14 Minutes | 0 (0.0%) | 0 (0.0%) |
| 15 to 19 Minutes | 0 (0.0%) | 0 (0.0%) |
| 20 to 24 Minutes | 0 (0.0%) | 0 (0.0%) |
| 25 to 29 Minutes | 0 (0.0%) | 0 (0.0%) |
| 30 to 34 Minutes | 39 (39.4%) | 0 (0.0%) |
| 35 to 39 Minutes | 0 (0.0%) | 0 (0.0%) |
| 40 to 44 Minutes | 60 (60.6%) | 0 (0.0%) |
| 45 to 59 Minutes | 0 (0.0%) | 0 (0.0%) |
| 60 to 89 Minutes | 0 (0.0%) | 0 (0.0%) |
| 90 or more Minutes | 0 (0.0%) | 0 (0.0%) |
Time of Departure to Work by Sex in Rancho Tehama Reserve
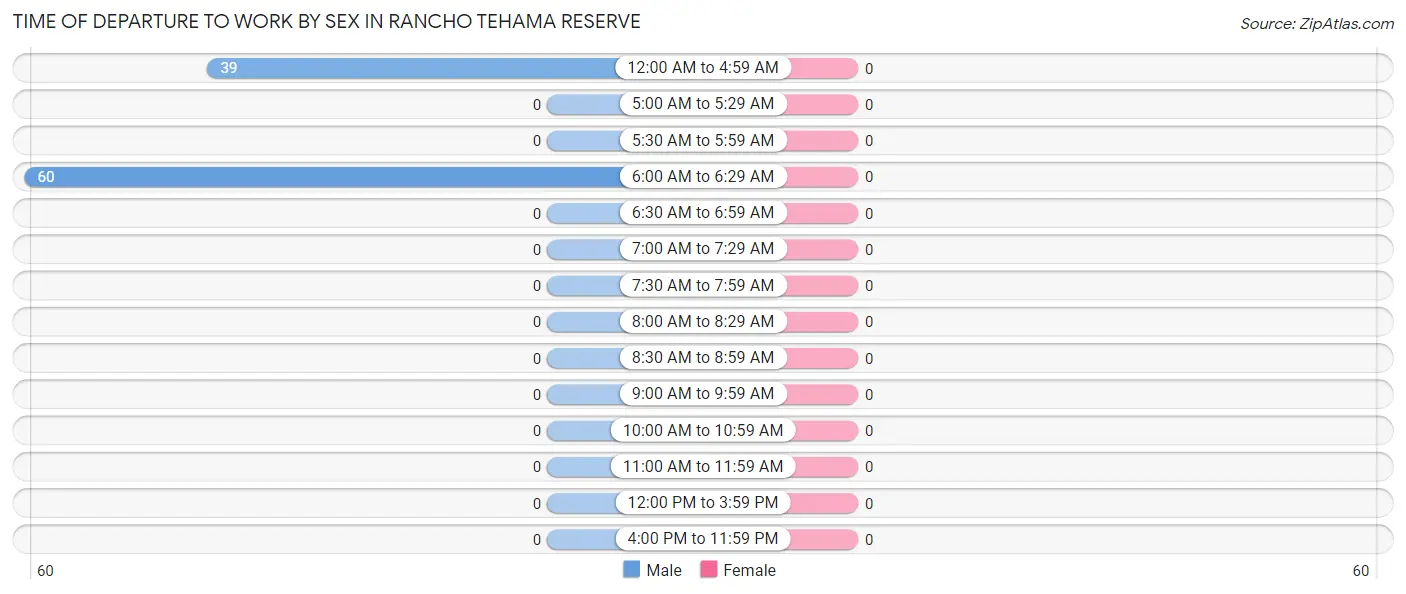
| Time of Departure | Male | Female |
| 12:00 AM to 4:59 AM | 39 (39.4%) | 0 (0.0%) |
| 5:00 AM to 5:29 AM | 0 (0.0%) | 0 (0.0%) |
| 5:30 AM to 5:59 AM | 0 (0.0%) | 0 (0.0%) |
| 6:00 AM to 6:29 AM | 60 (60.6%) | 0 (0.0%) |
| 6:30 AM to 6:59 AM | 0 (0.0%) | 0 (0.0%) |
| 7:00 AM to 7:29 AM | 0 (0.0%) | 0 (0.0%) |
| 7:30 AM to 7:59 AM | 0 (0.0%) | 0 (0.0%) |
| 8:00 AM to 8:29 AM | 0 (0.0%) | 0 (0.0%) |
| 8:30 AM to 8:59 AM | 0 (0.0%) | 0 (0.0%) |
| 9:00 AM to 9:59 AM | 0 (0.0%) | 0 (0.0%) |
| 10:00 AM to 10:59 AM | 0 (0.0%) | 0 (0.0%) |
| 11:00 AM to 11:59 AM | 0 (0.0%) | 0 (0.0%) |
| 12:00 PM to 3:59 PM | 0 (0.0%) | 0 (0.0%) |
| 4:00 PM to 11:59 PM | 0 (0.0%) | 0 (0.0%) |
| Total | 99 (100.0%) | 0 (0.0%) |
Housing Occupancy in Rancho Tehama Reserve
Occupancy by Ownership in Rancho Tehama Reserve
Of the total 400 dwellings in Rancho Tehama Reserve, owner-occupied units account for 272 (68.0%), while renter-occupied units make up 128 (32.0%).
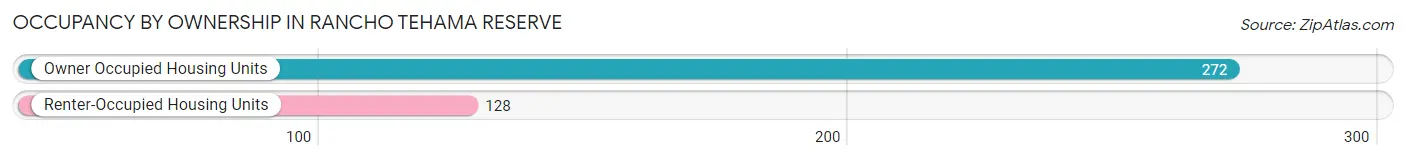
| Occupancy | # Housing Units | % Housing Units |
| Owner Occupied Housing Units | 272 | 68.0% |
| Renter-Occupied Housing Units | 128 | 32.0% |
| Total Occupied Housing Units | 400 | 100.0% |
Occupancy by Household Size in Rancho Tehama Reserve
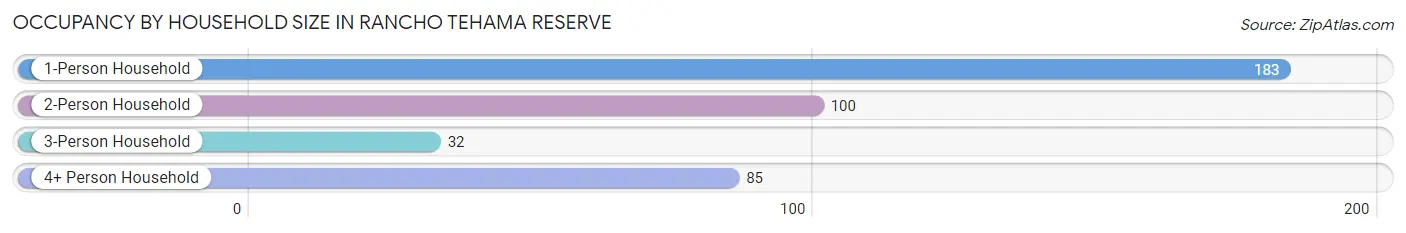
| Household Size | # Housing Units | % Housing Units |
| 1-Person Household | 183 | 45.8% |
| 2-Person Household | 100 | 25.0% |
| 3-Person Household | 32 | 8.0% |
| 4+ Person Household | 85 | 21.2% |
| Total Housing Units | 400 | 100.0% |
Occupancy by Ownership by Household Size in Rancho Tehama Reserve
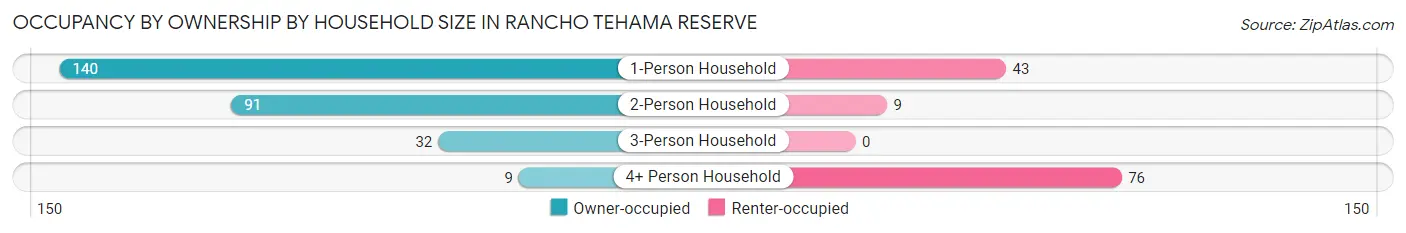
| Household Size | Owner-occupied | Renter-occupied |
| 1-Person Household | 140 (76.5%) | 43 (23.5%) |
| 2-Person Household | 91 (91.0%) | 9 (9.0%) |
| 3-Person Household | 32 (100.0%) | 0 (0.0%) |
| 4+ Person Household | 9 (10.6%) | 76 (89.4%) |
| Total Housing Units | 272 (68.0%) | 128 (32.0%) |
Occupancy by Educational Attainment in Rancho Tehama Reserve
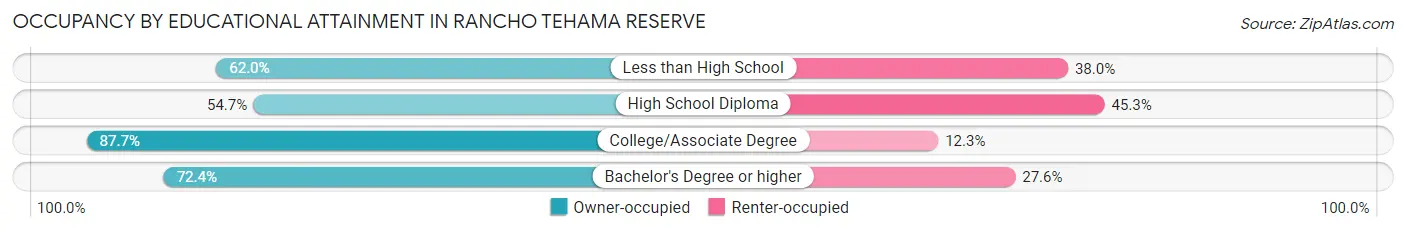
| Household Size | Owner-occupied | Renter-occupied |
| Less than High School | 44 (62.0%) | 27 (38.0%) |
| High School Diploma | 93 (54.7%) | 77 (45.3%) |
| College/Associate Degree | 114 (87.7%) | 16 (12.3%) |
| Bachelor's Degree or higher | 21 (72.4%) | 8 (27.6%) |
Occupancy by Age of Householder in Rancho Tehama Reserve
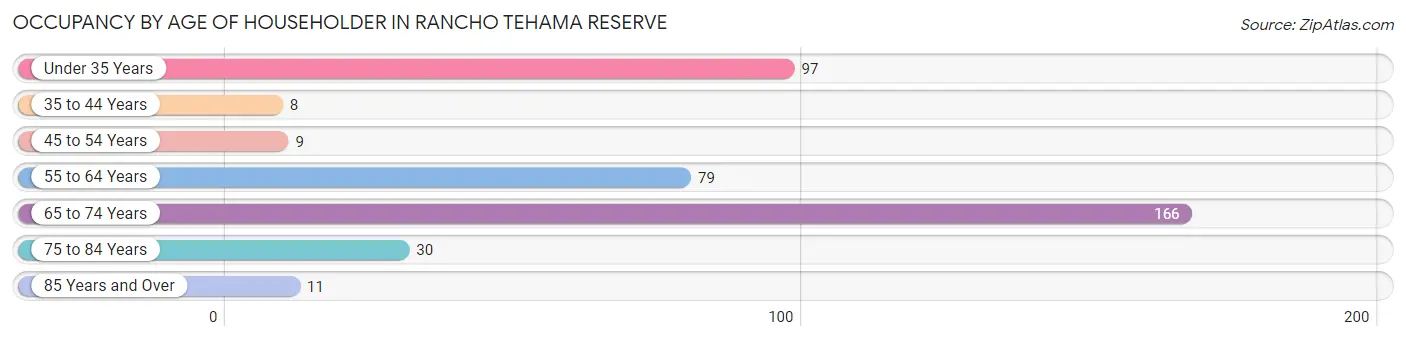
| Age Bracket | # Households | % Households |
| Under 35 Years | 97 | 24.2% |
| 35 to 44 Years | 8 | 2.0% |
| 45 to 54 Years | 9 | 2.2% |
| 55 to 64 Years | 79 | 19.8% |
| 65 to 74 Years | 166 | 41.5% |
| 75 to 84 Years | 30 | 7.5% |
| 85 Years and Over | 11 | 2.8% |
| Total | 400 | 100.0% |
Housing Finances in Rancho Tehama Reserve
Median Income by Occupancy in Rancho Tehama Reserve
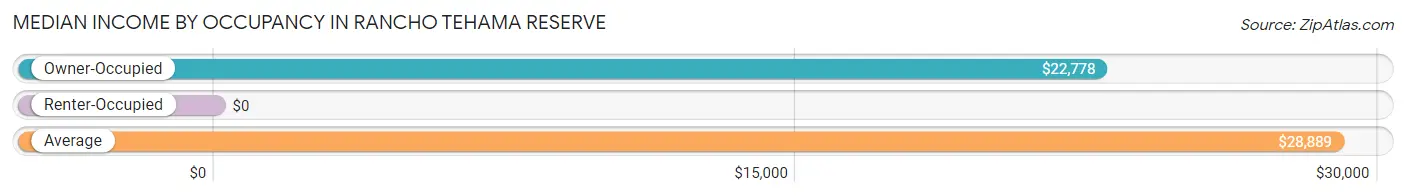
| Occupancy Type | # Households | Median Income |
| Owner-Occupied | 272 (68.0%) | $22,778 |
| Renter-Occupied | 128 (32.0%) | $0 |
| Average | 400 (100.0%) | $28,889 |
Occupancy by Householder Income Bracket in Rancho Tehama Reserve
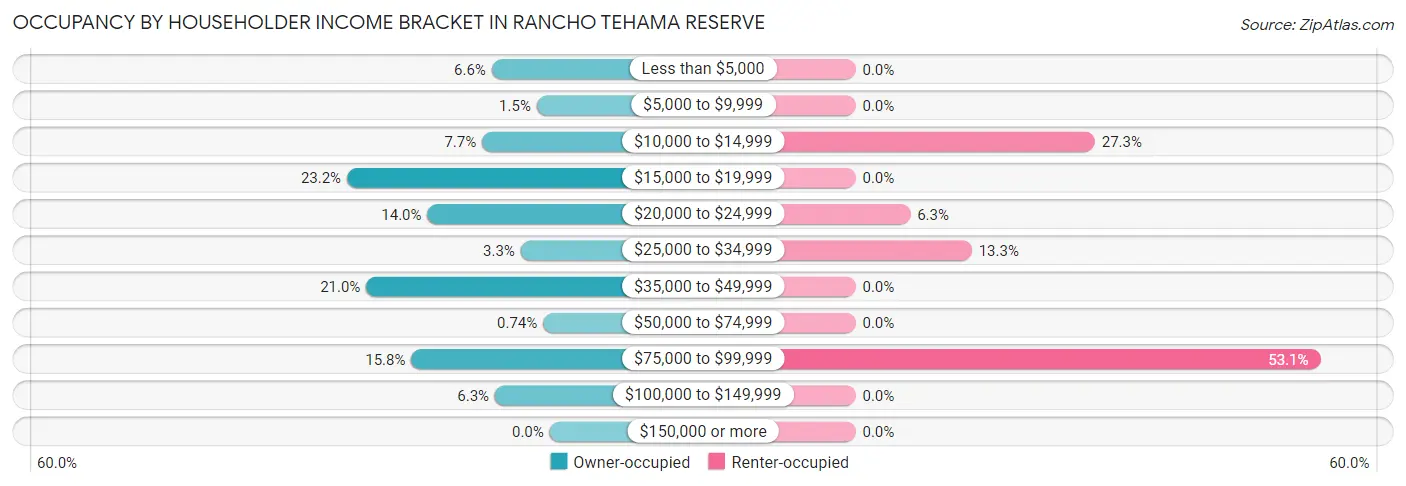
| Income Bracket | Owner-occupied | Renter-occupied |
| Less than $5,000 | 18 (6.6%) | 0 (0.0%) |
| $5,000 to $9,999 | 4 (1.5%) | 0 (0.0%) |
| $10,000 to $14,999 | 21 (7.7%) | 35 (27.3%) |
| $15,000 to $19,999 | 63 (23.2%) | 0 (0.0%) |
| $20,000 to $24,999 | 38 (14.0%) | 8 (6.2%) |
| $25,000 to $34,999 | 9 (3.3%) | 17 (13.3%) |
| $35,000 to $49,999 | 57 (21.0%) | 0 (0.0%) |
| $50,000 to $74,999 | 2 (0.7%) | 0 (0.0%) |
| $75,000 to $99,999 | 43 (15.8%) | 68 (53.1%) |
| $100,000 to $149,999 | 17 (6.2%) | 0 (0.0%) |
| $150,000 or more | 0 (0.0%) | 0 (0.0%) |
| Total | 272 (100.0%) | 128 (100.0%) |
Monthly Housing Cost Tiers in Rancho Tehama Reserve
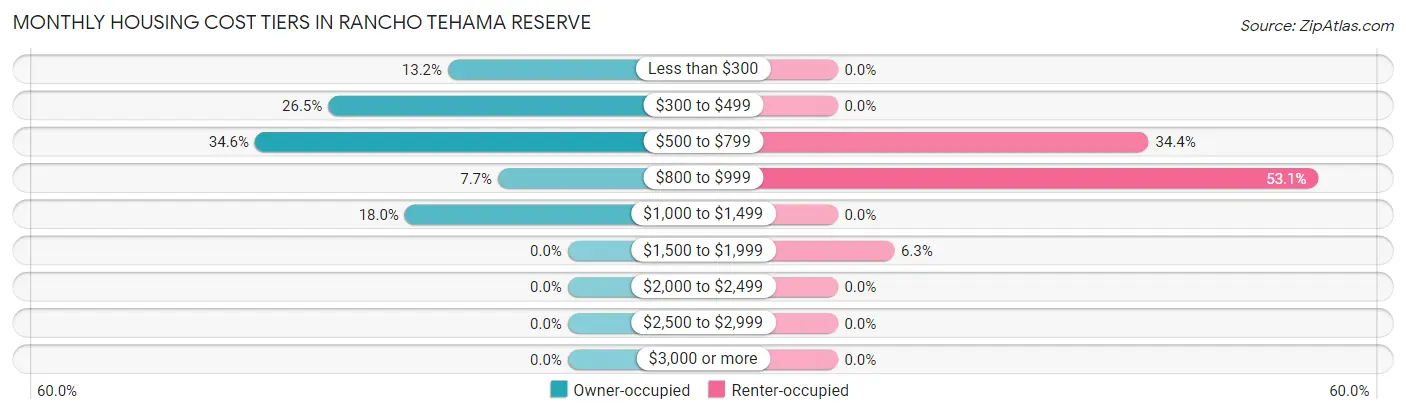
| Monthly Cost | Owner-occupied | Renter-occupied |
| Less than $300 | 36 (13.2%) | 0 (0.0%) |
| $300 to $499 | 72 (26.5%) | 0 (0.0%) |
| $500 to $799 | 94 (34.6%) | 44 (34.4%) |
| $800 to $999 | 21 (7.7%) | 68 (53.1%) |
| $1,000 to $1,499 | 49 (18.0%) | 0 (0.0%) |
| $1,500 to $1,999 | 0 (0.0%) | 8 (6.2%) |
| $2,000 to $2,499 | 0 (0.0%) | 0 (0.0%) |
| $2,500 to $2,999 | 0 (0.0%) | 0 (0.0%) |
| $3,000 or more | 0 (0.0%) | 0 (0.0%) |
| Total | 272 (100.0%) | 128 (100.0%) |
Physical Housing Characteristics in Rancho Tehama Reserve
Housing Structures in Rancho Tehama Reserve
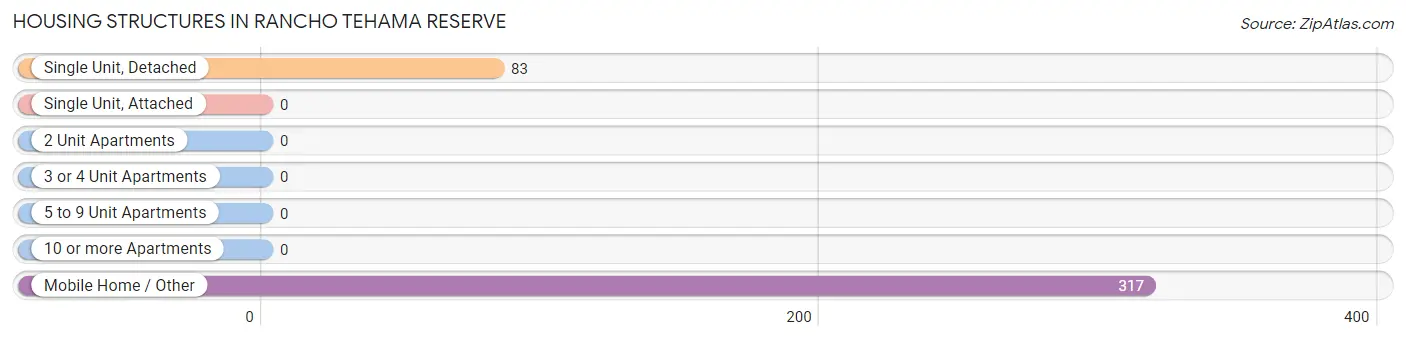
| Structure Type | # Housing Units | % Housing Units |
| Single Unit, Detached | 83 | 20.7% |
| Single Unit, Attached | 0 | 0.0% |
| 2 Unit Apartments | 0 | 0.0% |
| 3 or 4 Unit Apartments | 0 | 0.0% |
| 5 to 9 Unit Apartments | 0 | 0.0% |
| 10 or more Apartments | 0 | 0.0% |
| Mobile Home / Other | 317 | 79.2% |
| Total | 400 | 100.0% |
Housing Structures by Occupancy in Rancho Tehama Reserve

| Structure Type | Owner-occupied | Renter-occupied |
| Single Unit, Detached | 58 (69.9%) | 25 (30.1%) |
| Single Unit, Attached | 0 (0.0%) | 0 (0.0%) |
| 2 Unit Apartments | 0 (0.0%) | 0 (0.0%) |
| 3 or 4 Unit Apartments | 0 (0.0%) | 0 (0.0%) |
| 5 to 9 Unit Apartments | 0 (0.0%) | 0 (0.0%) |
| 10 or more Apartments | 0 (0.0%) | 0 (0.0%) |
| Mobile Home / Other | 214 (67.5%) | 103 (32.5%) |
| Total | 272 (68.0%) | 128 (32.0%) |
Housing Structures by Number of Rooms in Rancho Tehama Reserve
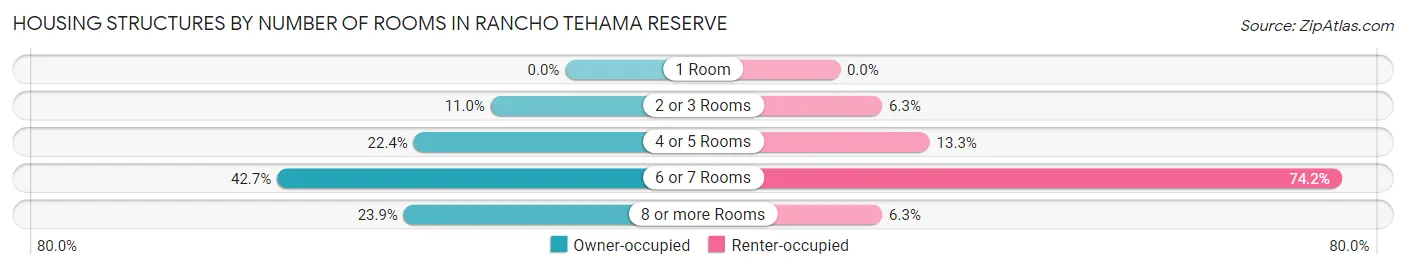
| Number of Rooms | Owner-occupied | Renter-occupied |
| 1 Room | 0 (0.0%) | 0 (0.0%) |
| 2 or 3 Rooms | 30 (11.0%) | 8 (6.2%) |
| 4 or 5 Rooms | 61 (22.4%) | 17 (13.3%) |
| 6 or 7 Rooms | 116 (42.6%) | 95 (74.2%) |
| 8 or more Rooms | 65 (23.9%) | 8 (6.2%) |
| Total | 272 (100.0%) | 128 (100.0%) |
Housing Structure by Heating Type in Rancho Tehama Reserve
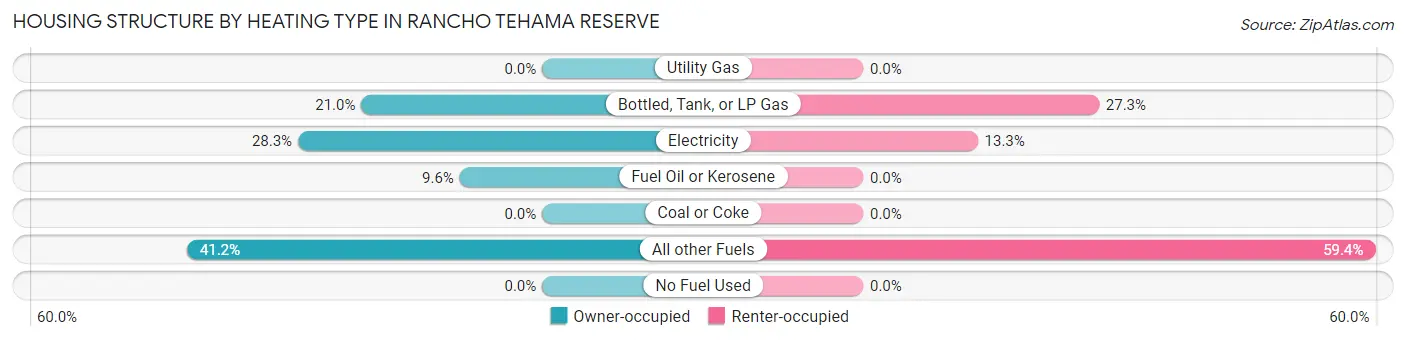
| Heating Type | Owner-occupied | Renter-occupied |
| Utility Gas | 0 (0.0%) | 0 (0.0%) |
| Bottled, Tank, or LP Gas | 57 (21.0%) | 35 (27.3%) |
| Electricity | 77 (28.3%) | 17 (13.3%) |
| Fuel Oil or Kerosene | 26 (9.6%) | 0 (0.0%) |
| Coal or Coke | 0 (0.0%) | 0 (0.0%) |
| All other Fuels | 112 (41.2%) | 76 (59.4%) |
| No Fuel Used | 0 (0.0%) | 0 (0.0%) |
| Total | 272 (100.0%) | 128 (100.0%) |
Household Vehicle Usage in Rancho Tehama Reserve
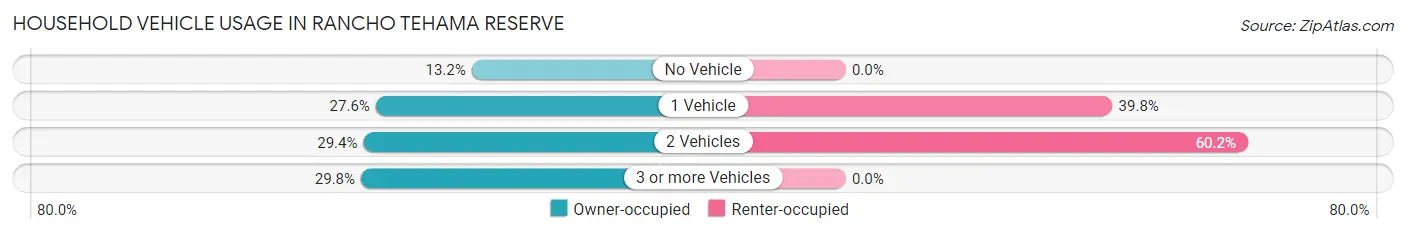
| Vehicles per Household | Owner-occupied | Renter-occupied |
| No Vehicle | 36 (13.2%) | 0 (0.0%) |
| 1 Vehicle | 75 (27.6%) | 51 (39.8%) |
| 2 Vehicles | 80 (29.4%) | 77 (60.2%) |
| 3 or more Vehicles | 81 (29.8%) | 0 (0.0%) |
| Total | 272 (100.0%) | 128 (100.0%) |
Real Estate & Mortgages in Rancho Tehama Reserve
Real Estate and Mortgage Overview in Rancho Tehama Reserve
| Characteristic | Without Mortgage | With Mortgage |
| Housing Units | 201 | 71 |
| Median Property Value | $137,500 | $0 |
| Median Household Income | $22,198 | $0 |
| Monthly Housing Costs | $458 | $0 |
| Real Estate Taxes | $696 | $0 |
Property Value by Mortgage Status in Rancho Tehama Reserve
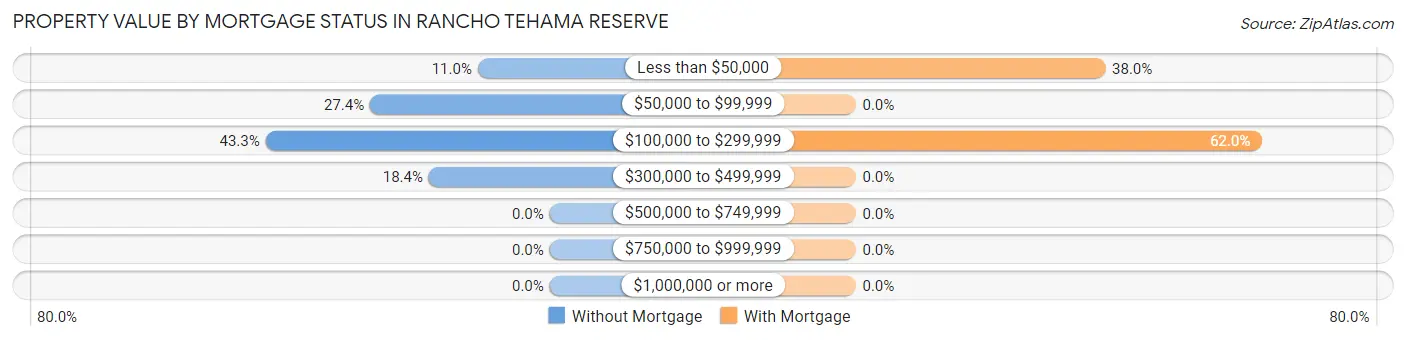
| Property Value | Without Mortgage | With Mortgage |
| Less than $50,000 | 22 (11.0%) | 27 (38.0%) |
| $50,000 to $99,999 | 55 (27.4%) | 0 (0.0%) |
| $100,000 to $299,999 | 87 (43.3%) | 44 (62.0%) |
| $300,000 to $499,999 | 37 (18.4%) | 0 (0.0%) |
| $500,000 to $749,999 | 0 (0.0%) | 0 (0.0%) |
| $750,000 to $999,999 | 0 (0.0%) | 0 (0.0%) |
| $1,000,000 or more | 0 (0.0%) | 0 (0.0%) |
| Total | 201 (100.0%) | 71 (100.0%) |
Household Income by Mortgage Status in Rancho Tehama Reserve
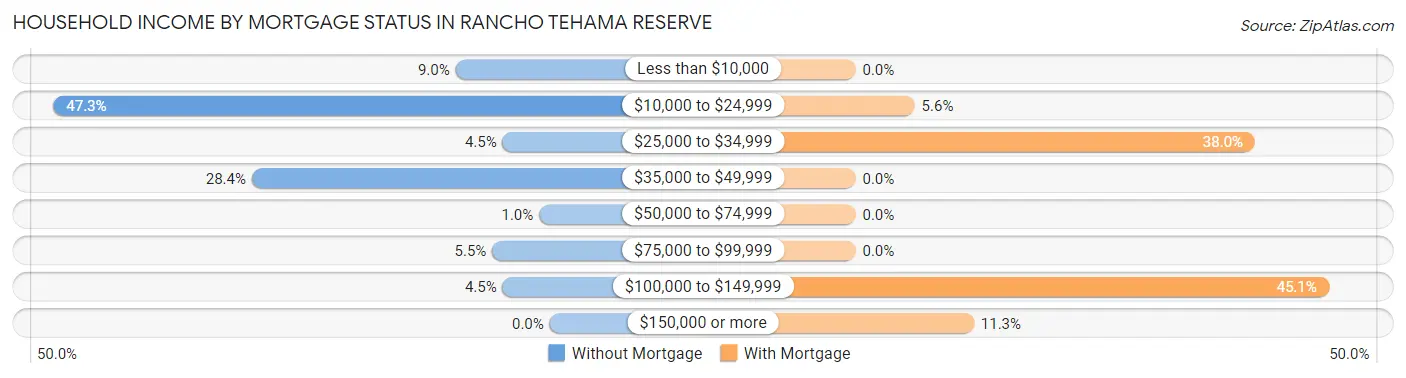
| Household Income | Without Mortgage | With Mortgage |
| Less than $10,000 | 18 (9.0%) | 0 (0.0%) |
| $10,000 to $24,999 | 95 (47.3%) | 4 (5.6%) |
| $25,000 to $34,999 | 9 (4.5%) | 27 (38.0%) |
| $35,000 to $49,999 | 57 (28.4%) | 0 (0.0%) |
| $50,000 to $74,999 | 2 (1.0%) | 0 (0.0%) |
| $75,000 to $99,999 | 11 (5.5%) | 0 (0.0%) |
| $100,000 to $149,999 | 9 (4.5%) | 32 (45.1%) |
| $150,000 or more | 0 (0.0%) | 8 (11.3%) |
| Total | 201 (100.0%) | 71 (100.0%) |
Property Value to Household Income Ratio in Rancho Tehama Reserve
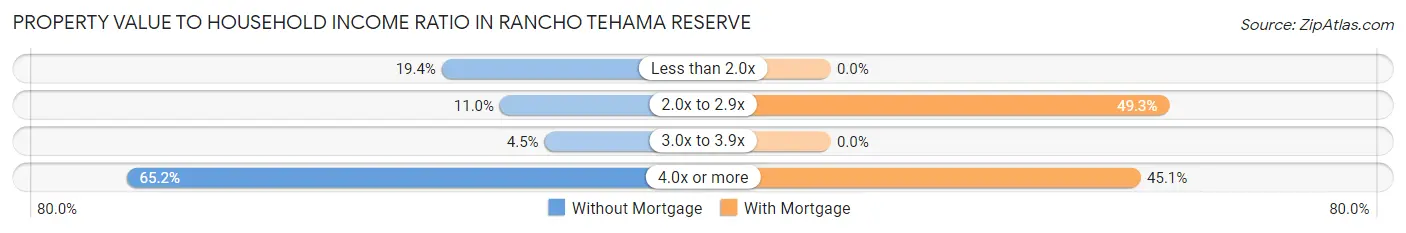
| Value-to-Income Ratio | Without Mortgage | With Mortgage |
| Less than 2.0x | 39 (19.4%) | 0 (0.0%) |
| 2.0x to 2.9x | 22 (11.0%) | 35 (49.3%) |
| 3.0x to 3.9x | 9 (4.5%) | 0 (0.0%) |
| 4.0x or more | 131 (65.2%) | 32 (45.1%) |
| Total | 201 (100.0%) | 71 (100.0%) |
Real Estate Taxes by Mortgage Status in Rancho Tehama Reserve
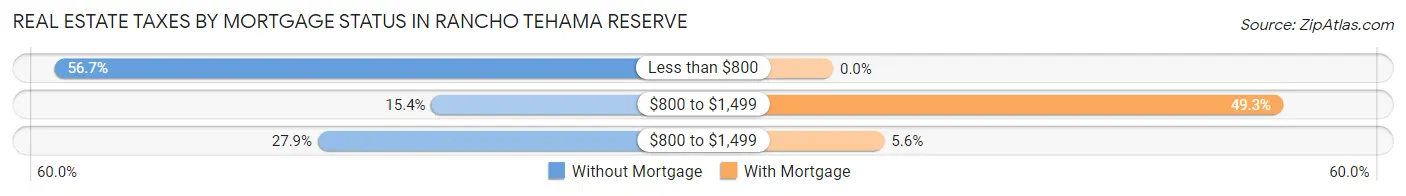
| Property Taxes | Without Mortgage | With Mortgage |
| Less than $800 | 114 (56.7%) | 0 (0.0%) |
| $800 to $1,499 | 31 (15.4%) | 35 (49.3%) |
| $800 to $1,499 | 56 (27.9%) | 4 (5.6%) |
| Total | 201 (100.0%) | 71 (100.0%) |
Health & Disability in Rancho Tehama Reserve
Health Insurance Coverage by Age in Rancho Tehama Reserve
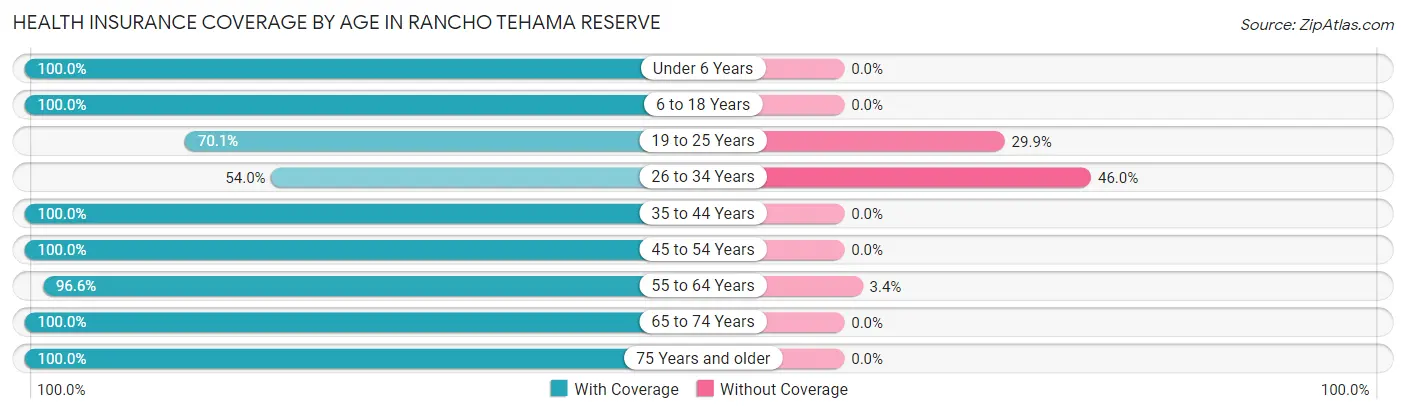
| Age Bracket | With Coverage | Without Coverage |
| Under 6 Years | 112 (100.0%) | 0 (0.0%) |
| 6 to 18 Years | 32 (100.0%) | 0 (0.0%) |
| 19 to 25 Years | 68 (70.1%) | 29 (29.9%) |
| 26 to 34 Years | 61 (54.0%) | 52 (46.0%) |
| 35 to 44 Years | 14 (100.0%) | 0 (0.0%) |
| 45 to 54 Years | 21 (100.0%) | 0 (0.0%) |
| 55 to 64 Years | 113 (96.6%) | 4 (3.4%) |
| 65 to 74 Years | 202 (100.0%) | 0 (0.0%) |
| 75 Years and older | 77 (100.0%) | 0 (0.0%) |
| Total | 700 (89.2%) | 85 (10.8%) |
Health Insurance Coverage by Citizenship Status in Rancho Tehama Reserve
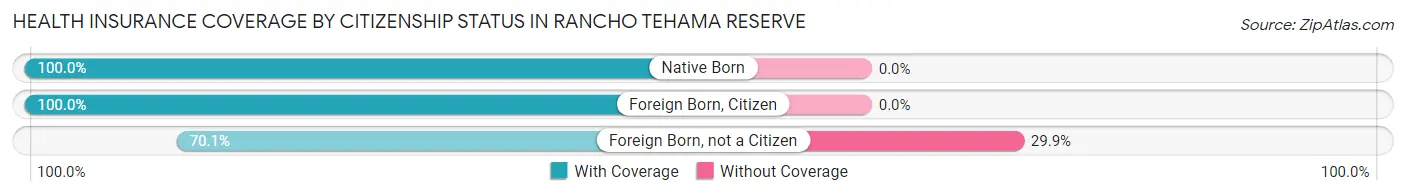
| Citizenship Status | With Coverage | Without Coverage |
| Native Born | 112 (100.0%) | 0 (0.0%) |
| Foreign Born, Citizen | 32 (100.0%) | 0 (0.0%) |
| Foreign Born, not a Citizen | 68 (70.1%) | 29 (29.9%) |
Health Insurance Coverage by Household Income in Rancho Tehama Reserve
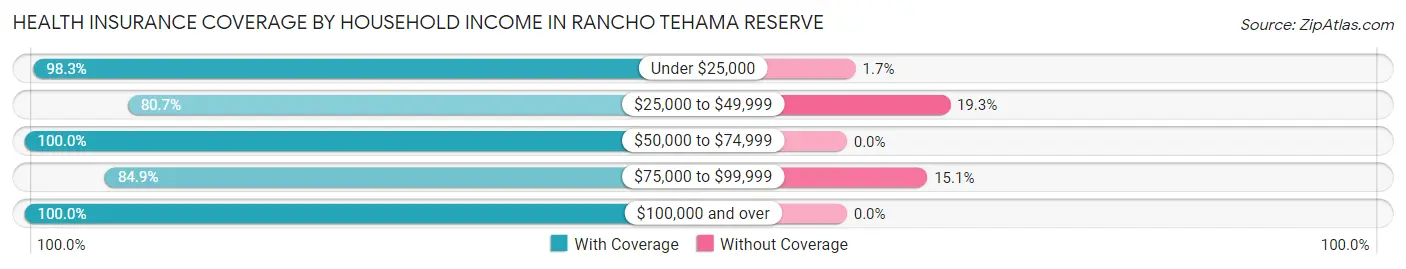
| Household Income | With Coverage | Without Coverage |
| Under $25,000 | 237 (98.3%) | 4 (1.7%) |
| $25,000 to $49,999 | 121 (80.7%) | 29 (19.3%) |
| $50,000 to $74,999 | 3 (100.0%) | 0 (0.0%) |
| $75,000 to $99,999 | 293 (84.9%) | 52 (15.1%) |
| $100,000 and over | 46 (100.0%) | 0 (0.0%) |
Public vs Private Health Insurance Coverage by Age in Rancho Tehama Reserve
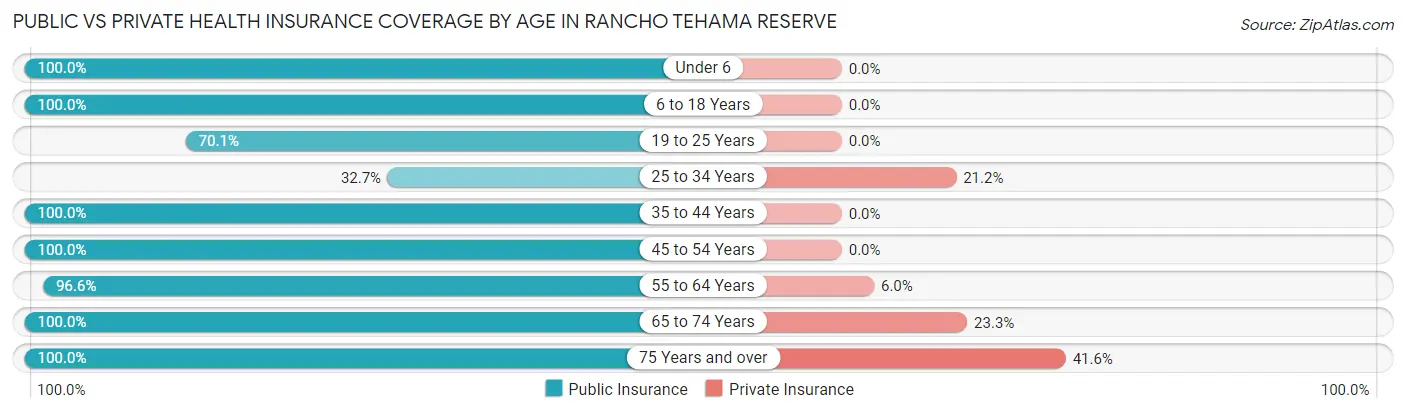
| Age Bracket | Public Insurance | Private Insurance |
| Under 6 | 112 (100.0%) | 0 (0.0%) |
| 6 to 18 Years | 32 (100.0%) | 0 (0.0%) |
| 19 to 25 Years | 68 (70.1%) | 0 (0.0%) |
| 25 to 34 Years | 37 (32.7%) | 24 (21.2%) |
| 35 to 44 Years | 14 (100.0%) | 0 (0.0%) |
| 45 to 54 Years | 21 (100.0%) | 0 (0.0%) |
| 55 to 64 Years | 113 (96.6%) | 7 (6.0%) |
| 65 to 74 Years | 202 (100.0%) | 47 (23.3%) |
| 75 Years and over | 77 (100.0%) | 32 (41.6%) |
| Total | 676 (86.1%) | 110 (14.0%) |
Disability Status by Sex by Age in Rancho Tehama Reserve
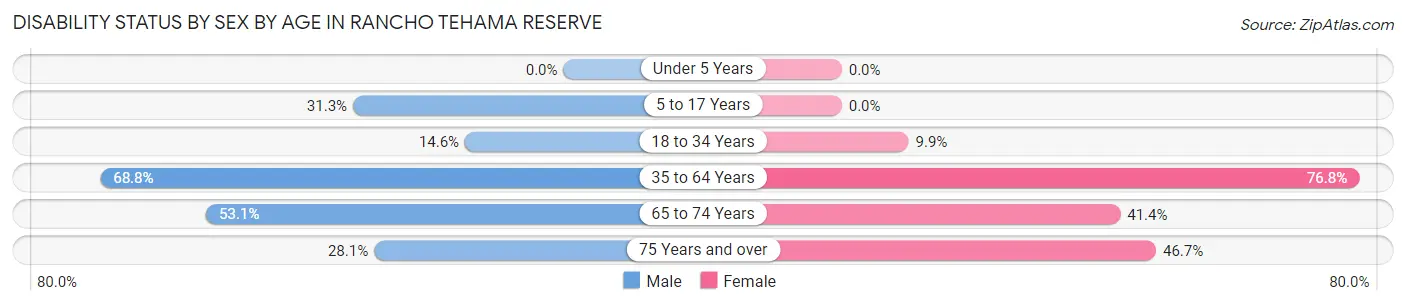
| Age Bracket | Male | Female |
| Under 5 Years | 0 (0.0%) | 0 (0.0%) |
| 5 to 17 Years | 10 (31.2%) | 0 (0.0%) |
| 18 to 34 Years | 13 (14.6%) | 12 (9.9%) |
| 35 to 64 Years | 66 (68.8%) | 43 (76.8%) |
| 65 to 74 Years | 52 (53.1%) | 43 (41.3%) |
| 75 Years and over | 9 (28.1%) | 21 (46.7%) |
Disability Class by Sex by Age in Rancho Tehama Reserve
Disability Class: Hearing Difficulty
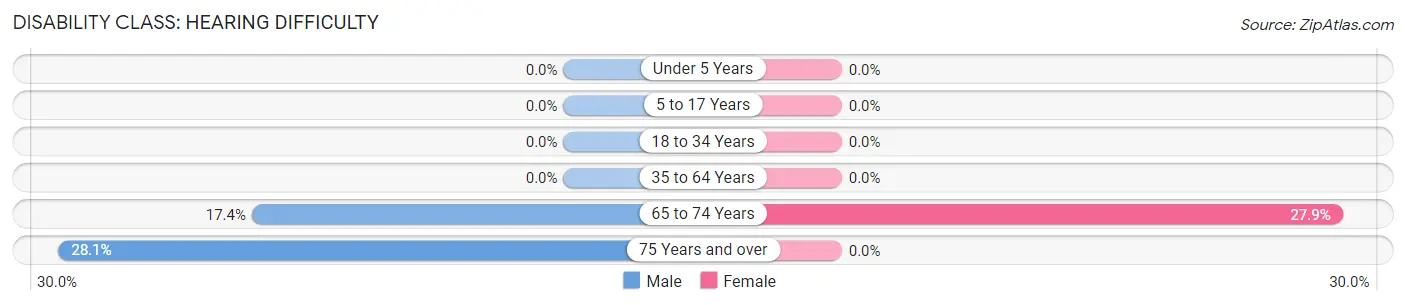
| Age Bracket | Male | Female |
| Under 5 Years | 0 (0.0%) | 0 (0.0%) |
| 5 to 17 Years | 0 (0.0%) | 0 (0.0%) |
| 18 to 34 Years | 0 (0.0%) | 0 (0.0%) |
| 35 to 64 Years | 0 (0.0%) | 0 (0.0%) |
| 65 to 74 Years | 17 (17.3%) | 29 (27.9%) |
| 75 Years and over | 9 (28.1%) | 0 (0.0%) |
Disability Class: Vision Difficulty
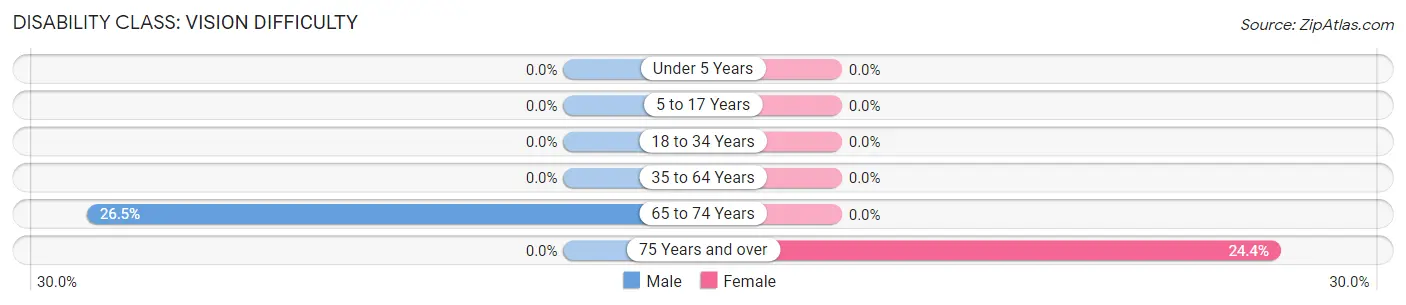
| Age Bracket | Male | Female |
| Under 5 Years | 0 (0.0%) | 0 (0.0%) |
| 5 to 17 Years | 0 (0.0%) | 0 (0.0%) |
| 18 to 34 Years | 0 (0.0%) | 0 (0.0%) |
| 35 to 64 Years | 0 (0.0%) | 0 (0.0%) |
| 65 to 74 Years | 26 (26.5%) | 0 (0.0%) |
| 75 Years and over | 0 (0.0%) | 11 (24.4%) |
Disability Class: Cognitive Difficulty
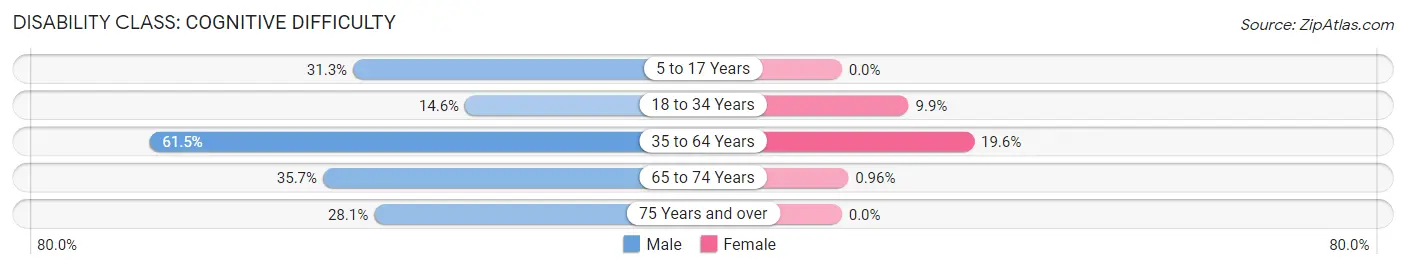
| Age Bracket | Male | Female |
| 5 to 17 Years | 10 (31.2%) | 0 (0.0%) |
| 18 to 34 Years | 13 (14.6%) | 12 (9.9%) |
| 35 to 64 Years | 59 (61.5%) | 11 (19.6%) |
| 65 to 74 Years | 35 (35.7%) | 1 (1.0%) |
| 75 Years and over | 9 (28.1%) | 0 (0.0%) |
Disability Class: Ambulatory Difficulty
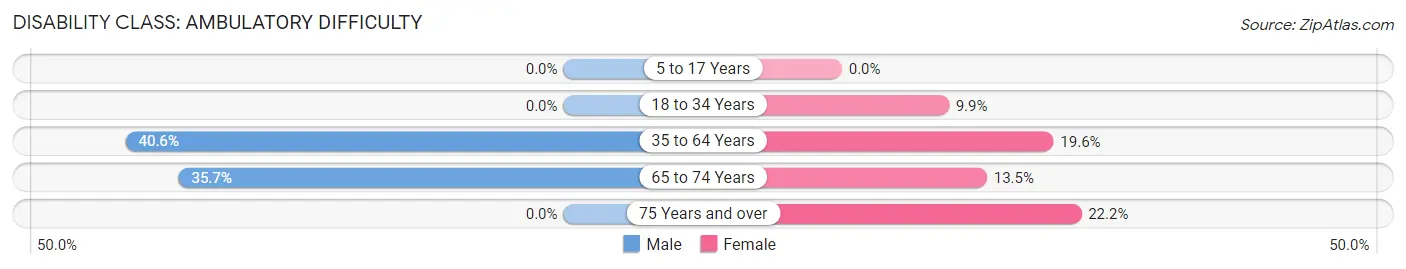
| Age Bracket | Male | Female |
| 5 to 17 Years | 0 (0.0%) | 0 (0.0%) |
| 18 to 34 Years | 0 (0.0%) | 12 (9.9%) |
| 35 to 64 Years | 39 (40.6%) | 11 (19.6%) |
| 65 to 74 Years | 35 (35.7%) | 14 (13.5%) |
| 75 Years and over | 0 (0.0%) | 10 (22.2%) |
Disability Class: Self-Care Difficulty
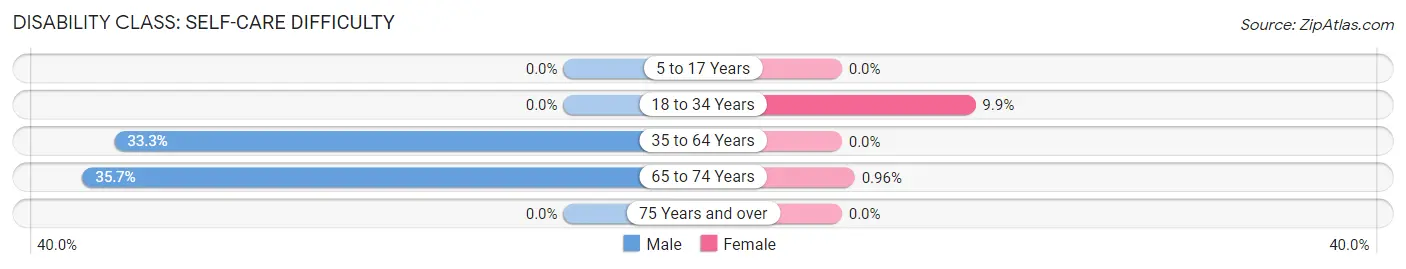
| Age Bracket | Male | Female |
| 5 to 17 Years | 0 (0.0%) | 0 (0.0%) |
| 18 to 34 Years | 0 (0.0%) | 12 (9.9%) |
| 35 to 64 Years | 32 (33.3%) | 0 (0.0%) |
| 65 to 74 Years | 35 (35.7%) | 1 (1.0%) |
| 75 Years and over | 0 (0.0%) | 0 (0.0%) |
Technology Access in Rancho Tehama Reserve
Computing Device Access in Rancho Tehama Reserve
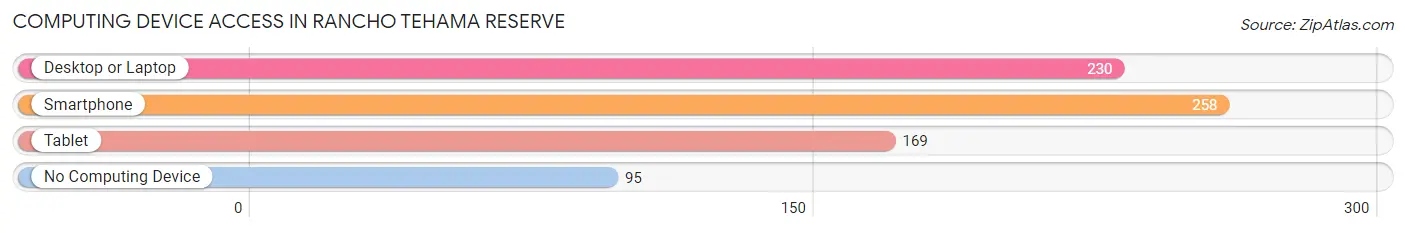
| Device Type | # Households | % Households |
| Desktop or Laptop | 230 | 57.5% |
| Smartphone | 258 | 64.5% |
| Tablet | 169 | 42.2% |
| No Computing Device | 95 | 23.7% |
| Total | 400 | 100.0% |
Internet Access in Rancho Tehama Reserve
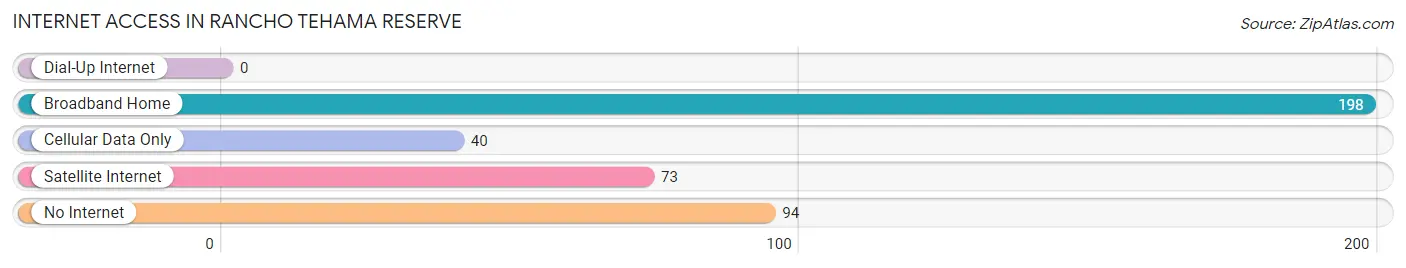
| Internet Type | # Households | % Households |
| Dial-Up Internet | 0 | 0.0% |
| Broadband Home | 198 | 49.5% |
| Cellular Data Only | 40 | 10.0% |
| Satellite Internet | 73 | 18.2% |
| No Internet | 94 | 23.5% |
| Total | 400 | 100.0% |
Rancho Tehama Reserve Summary
Rancho Tehama Reserve is a small unincorporated community located in Tehama County, California. It is situated in the foothills of the Sierra Nevada Mountains, approximately 25 miles northwest of Red Bluff. The community is home to a diverse population of Native Americans, ranchers, and other rural residents.
History
Rancho Tehama Reserve was originally part of the Rancho Tehama Mexican land grant, which was granted to the Tehama family in 1844. The Tehama family were of Mexican descent and had been living in the area since the early 1800s. The land grant encompassed over 25,000 acres of land, which included the present-day community of Rancho Tehama Reserve.
In the late 1800s, the Tehama family sold the land to a group of ranchers, who established the Rancho Tehama Cattle Company. The company operated a large cattle ranch in the area, which was used to raise cattle for the local market. The ranch was also used to raise horses and sheep.
In the early 1900s, the ranch was sold to the federal government, which established the Rancho Tehama Indian Reservation. The reservation was home to the Tehama, Pomo, and Wintu tribes, who were relocated to the area from other parts of California. The reservation was also home to a number of non-Native American settlers, who were allowed to remain on the land.
In the 1950s, the federal government began to reduce the size of the reservation, and in the 1960s, the remaining land was sold to private individuals. The land was divided into small parcels, and the community of Rancho Tehama Reserve was established.
Geography
Rancho Tehama Reserve is located in the foothills of the Sierra Nevada Mountains, approximately 25 miles northwest of Red Bluff. The community is situated at an elevation of 1,400 feet above sea level. The area is characterized by rolling hills, oak woodlands, and grassy meadows.
The climate in Rancho Tehama Reserve is mild and temperate, with hot summers and cool winters. The average annual temperature is around 60 degrees Fahrenheit, and the average annual precipitation is around 20 inches.
Economy
The economy of Rancho Tehama Reserve is largely based on agriculture and ranching. The area is home to a number of small farms and ranches, which produce a variety of crops and livestock. The community is also home to a number of small businesses, including a grocery store, a gas station, and a post office.
Demographics
As of the 2010 census, the population of Rancho Tehama Reserve was 1,265. The population is largely composed of Native Americans, with the Tehama, Pomo, and Wintu tribes making up the majority of the population. The community is also home to a number of non-Native American settlers, who make up a small portion of the population.
The median household income in Rancho Tehama Reserve is $35,000, and the median home value is $150,000. The unemployment rate is around 10%, and the poverty rate is around 20%. The majority of the population is employed in agriculture and ranching, and the community is home to a number of small businesses.
Common Questions
What is Per Capita Income in Rancho Tehama Reserve?
Per Capita income in Rancho Tehama Reserve is $20,617.
What is the Median Household income in Rancho Tehama Reserve?
Median Household Income in Rancho Tehama Reserve is $28,889.
What is Inequality or Gini Index in Rancho Tehama Reserve?
Inequality or Gini Index in Rancho Tehama Reserve is 0.41.
What is the Total Population of Rancho Tehama Reserve?
Total Population of Rancho Tehama Reserve is 793.
What is the Total Male Population of Rancho Tehama Reserve?
Total Male Population of Rancho Tehama Reserve is 396.
What is the Total Female Population of Rancho Tehama Reserve?
Total Female Population of Rancho Tehama Reserve is 397.
What is the Ratio of Males per 100 Females in Rancho Tehama Reserve?
There are 99.75 Males per 100 Females in Rancho Tehama Reserve.
What is the Ratio of Females per 100 Males in Rancho Tehama Reserve?
There are 100.25 Females per 100 Males in Rancho Tehama Reserve.
What is the Median Population Age in Rancho Tehama Reserve?
Median Population Age in Rancho Tehama Reserve is 55.9 Years.
What is the Average Family Size in Rancho Tehama Reserve
Average Family Size in Rancho Tehama Reserve is 2.5 People.
What is the Average Household Size in Rancho Tehama Reserve
Average Household Size in Rancho Tehama Reserve is 2.0 People.
How Large is the Labor Force in Rancho Tehama Reserve?
There are 129 People in the Labor Forcein in Rancho Tehama Reserve.
What is the Percentage of People in the Labor Force in Rancho Tehama Reserve?
19.9% of People are in the Labor Force in Rancho Tehama Reserve.
What is the Unemployment Rate in Rancho Tehama Reserve?
Unemployment Rate in Rancho Tehama Reserve is 7.4%.