Cities with the Highest Poverty Level Among Children Under the Age of 5 in Washington
RELATED REPORTS & OPTIONS
Highest Poverty | Child 0-5
Washington
Compare Cities
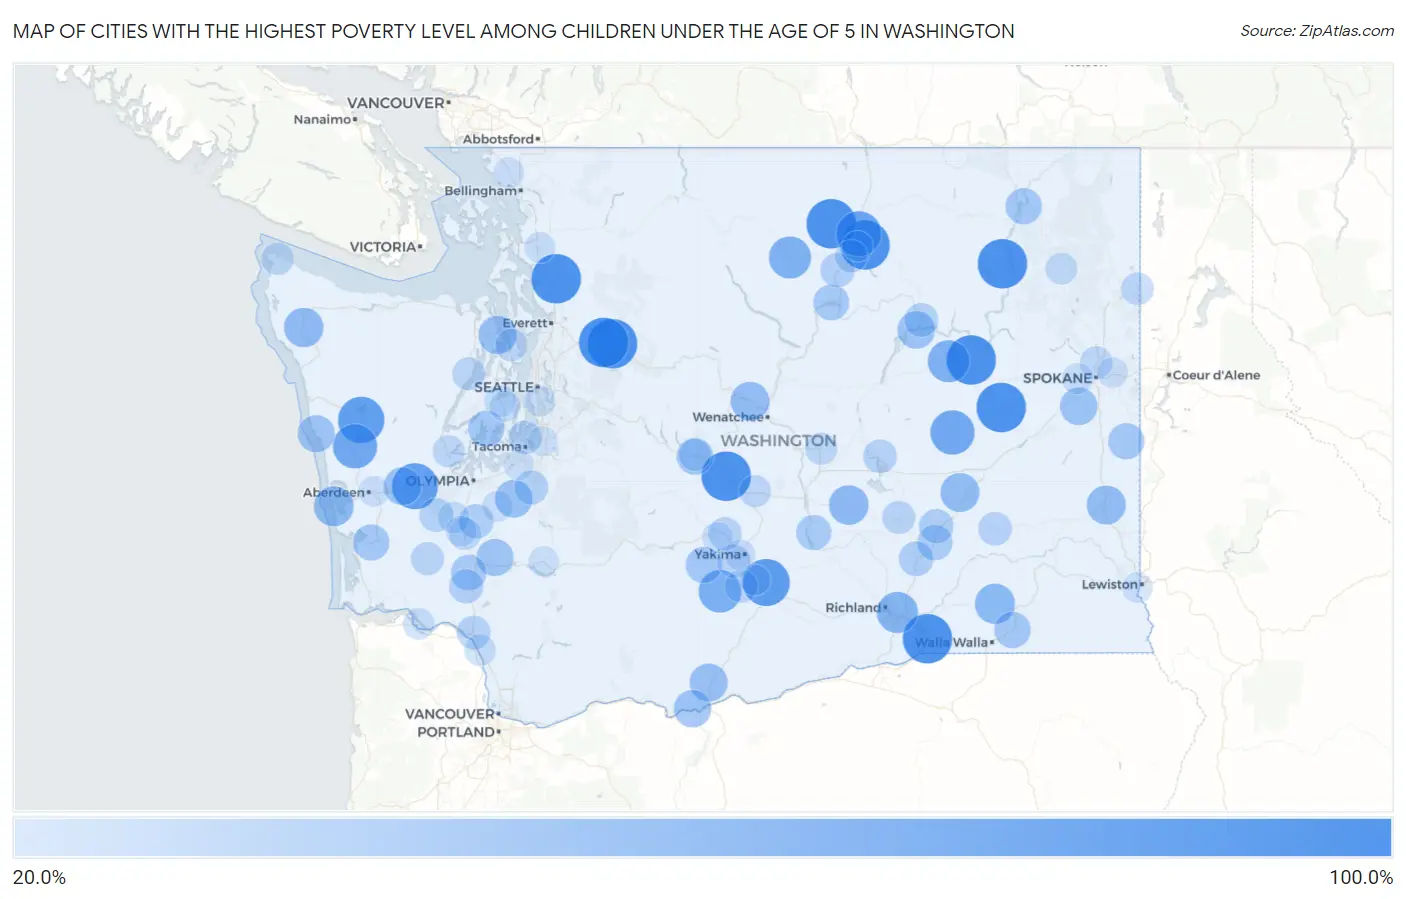
Map of Cities with the Highest Poverty Level Among Children Under the Age of 5 in Washington
0.0%
100.0%
Cities with the Highest Poverty Level Among Children Under the Age of 5 in Washington
| City | Child Poverty | vs State | vs National | |
| 1. | Bryant | 100.0% | 12.6%(+87.4)#1 | 18.1%(+81.9)#40 |
| 2. | May Creek | 100.0% | 12.6%(+87.4)#2 | 18.1%(+81.9)#197 |
| 3. | Startup | 100.0% | 12.6%(+87.4)#3 | 18.1%(+81.9)#258 |
| 4. | Harrington | 100.0% | 12.6%(+87.4)#4 | 18.1%(+81.9)#341 |
| 5. | North Omak | 100.0% | 12.6%(+87.4)#5 | 18.1%(+81.9)#372 |
| 6. | Inchelium | 100.0% | 12.6%(+87.4)#6 | 18.1%(+81.9)#414 |
| 7. | Creston | 100.0% | 12.6%(+87.4)#7 | 18.1%(+81.9)#558 |
| 8. | Conconully | 100.0% | 12.6%(+87.4)#8 | 18.1%(+81.9)#580 |
| 9. | Thorp | 100.0% | 12.6%(+87.4)#9 | 18.1%(+81.9)#785 |
| 10. | Wallula | 100.0% | 12.6%(+87.4)#10 | 18.1%(+81.9)#790 |
| 11. | Buena | 90.9% | 12.6%(+78.3)#11 | 18.1%(+72.8)#1,005 |
| 12. | Neilton | 88.0% | 12.6%(+75.4)#12 | 18.1%(+69.9)#1,063 |
| 13. | Elma | 87.0% | 12.6%(+74.4)#13 | 18.1%(+68.9)#1,100 |
| 14. | Riverside | 83.3% | 12.6%(+70.7)#14 | 18.1%(+65.3)#1,215 |
| 15. | Odessa | 80.0% | 12.6%(+67.4)#15 | 18.1%(+61.9)#1,320 |
| 16. | Humptulips | 80.0% | 12.6%(+67.4)#16 | 18.1%(+61.9)#1,345 |
| 17. | White Swan | 74.0% | 12.6%(+61.4)#17 | 18.1%(+55.9)#1,585 |
| 18. | Twisp | 71.4% | 12.6%(+58.8)#18 | 18.1%(+53.4)#1,694 |
| 19. | Wilbur | 71.4% | 12.6%(+58.8)#19 | 18.1%(+53.4)#1,695 |
| 20. | West Pasco | 68.1% | 12.6%(+55.5)#20 | 18.1%(+50.0)#1,892 |
| 21. | Prescott | 64.3% | 12.6%(+51.7)#21 | 18.1%(+46.2)#2,166 |
| 22. | Westport | 63.3% | 12.6%(+50.7)#22 | 18.1%(+45.3)#2,235 |
| 23. | Clear Lake Cdp Skagit County | 63.1% | 12.6%(+50.5)#23 | 18.1%(+45.0)#2,252 |
| 24. | Royal City | 62.5% | 12.6%(+49.9)#24 | 18.1%(+44.4)#2,289 |
| 25. | Forks | 61.9% | 12.6%(+49.3)#25 | 18.1%(+43.9)#2,344 |
| 26. | Colfax | 60.3% | 12.6%(+47.7)#26 | 18.1%(+42.2)#2,477 |
| 27. | Lind | 60.0% | 12.6%(+47.4)#27 | 18.1%(+41.9)#2,507 |
| 28. | Cashmere | 59.2% | 12.6%(+46.6)#28 | 18.1%(+41.1)#2,590 |
| 29. | Port Ludlow | 57.0% | 12.6%(+44.4)#29 | 18.1%(+38.9)#2,784 |
| 30. | Goldendale | 56.4% | 12.6%(+43.8)#30 | 18.1%(+38.4)#2,826 |
| 31. | Kitsap Lake | 56.1% | 12.6%(+43.5)#31 | 18.1%(+38.1)#2,852 |
| 32. | Brady | 55.6% | 12.6%(+42.9)#32 | 18.1%(+37.5)#2,904 |
| 33. | Mckenna | 55.4% | 12.6%(+42.7)#33 | 18.1%(+37.3)#2,943 |
| 34. | Cheney | 54.8% | 12.6%(+42.2)#34 | 18.1%(+36.8)#2,980 |
| 35. | Grand Coulee | 54.5% | 12.6%(+41.9)#35 | 18.1%(+36.5)#3,002 |
| 36. | Wishram | 54.2% | 12.6%(+41.5)#36 | 18.1%(+36.1)#3,026 |
| 37. | Taholah | 53.3% | 12.6%(+40.7)#37 | 18.1%(+35.3)#3,100 |
| 38. | Onalaska | 52.7% | 12.6%(+40.1)#38 | 18.1%(+34.7)#3,169 |
| 39. | South Cle Elum | 51.6% | 12.6%(+39.0)#39 | 18.1%(+33.6)#3,273 |
| 40. | Vaughn | 50.0% | 12.6%(+37.4)#40 | 18.1%(+31.9)#3,419 |
| 41. | Tampico | 50.0% | 12.6%(+37.4)#41 | 18.1%(+31.9)#3,470 |
| 42. | Marcus | 50.0% | 12.6%(+37.4)#42 | 18.1%(+31.9)#3,533 |
| 43. | Latah | 50.0% | 12.6%(+37.4)#43 | 18.1%(+31.9)#3,541 |
| 44. | Dixie | 50.0% | 12.6%(+37.4)#44 | 18.1%(+31.9)#3,545 |
| 45. | South Bend | 49.4% | 12.6%(+36.7)#45 | 18.1%(+31.3)#3,613 |
| 46. | Brewster | 48.2% | 12.6%(+35.6)#46 | 18.1%(+30.2)#3,725 |
| 47. | Winlock | 47.3% | 12.6%(+34.7)#47 | 18.1%(+29.3)#3,829 |
| 48. | Mattawa | 46.3% | 12.6%(+33.7)#48 | 18.1%(+28.2)#3,971 |
| 49. | Connell | 46.2% | 12.6%(+33.5)#49 | 18.1%(+28.1)#3,985 |
| 50. | Mesa | 44.2% | 12.6%(+31.6)#50 | 18.1%(+26.1)#4,268 |
| 51. | Hatton | 43.8% | 12.6%(+31.1)#51 | 18.1%(+25.7)#4,324 |
| 52. | Bucoda | 43.2% | 12.6%(+30.6)#52 | 18.1%(+25.2)#4,397 |
| 53. | Vader | 42.7% | 12.6%(+30.1)#53 | 18.1%(+24.7)#4,490 |
| 54. | Malott | 42.7% | 12.6%(+30.1)#54 | 18.1%(+24.6)#4,491 |
| 55. | South Creek | 41.7% | 12.6%(+29.0)#55 | 18.1%(+23.6)#4,627 |
| 56. | Oakville | 41.7% | 12.6%(+29.0)#56 | 18.1%(+23.6)#4,634 |
| 57. | Elmer City | 40.7% | 12.6%(+28.1)#57 | 18.1%(+22.7)#4,761 |
| 58. | Kelso | 40.3% | 12.6%(+27.7)#58 | 18.1%(+22.3)#4,816 |
| 59. | Moses Lake North | 40.3% | 12.6%(+27.7)#59 | 18.1%(+22.2)#4,820 |
| 60. | Washtucna | 40.0% | 12.6%(+27.4)#60 | 18.1%(+21.9)#4,915 |
| 61. | Browns Point | 39.4% | 12.6%(+26.8)#61 | 18.1%(+21.3)#5,000 |
| 62. | Ahtanum | 39.1% | 12.6%(+26.5)#62 | 18.1%(+21.0)#5,058 |
| 63. | Naches | 38.8% | 12.6%(+26.2)#63 | 18.1%(+20.7)#5,108 |
| 64. | Pe Ell | 38.6% | 12.6%(+26.0)#64 | 18.1%(+20.6)#5,123 |
| 65. | Othello | 38.4% | 12.6%(+25.8)#65 | 18.1%(+20.3)#5,164 |
| 66. | Brinnon | 38.1% | 12.6%(+25.5)#66 | 18.1%(+20.0)#5,197 |
| 67. | Harrah | 38.1% | 12.6%(+25.5)#67 | 18.1%(+20.0)#5,201 |
| 68. | Country Homes | 36.4% | 12.6%(+23.8)#68 | 18.1%(+18.4)#5,493 |
| 69. | Okanogan | 36.3% | 12.6%(+23.6)#69 | 18.1%(+18.2)#5,533 |
| 70. | Newport | 36.2% | 12.6%(+23.6)#70 | 18.1%(+18.2)#5,539 |
| 71. | Port Gamble Tribal Community | 35.9% | 12.6%(+23.3)#71 | 18.1%(+17.8)#5,595 |
| 72. | Centralia | 35.7% | 12.6%(+23.1)#72 | 18.1%(+17.7)#5,625 |
| 73. | Neah Bay | 35.6% | 12.6%(+22.9)#73 | 18.1%(+17.5)#5,672 |
| 74. | Cle Elum | 35.4% | 12.6%(+22.8)#74 | 18.1%(+17.4)#5,698 |
| 75. | Shelton | 35.3% | 12.6%(+22.7)#75 | 18.1%(+17.2)#5,722 |
| 76. | Quincy | 34.9% | 12.6%(+22.3)#76 | 18.1%(+16.8)#5,797 |
| 77. | Kittitas | 34.9% | 12.6%(+22.3)#77 | 18.1%(+16.8)#5,798 |
| 78. | Chewelah | 33.6% | 12.6%(+21.0)#78 | 18.1%(+15.5)#6,013 |
| 79. | Kalama | 32.7% | 12.6%(+20.1)#79 | 18.1%(+14.7)#6,255 |
| 80. | Rochester | 32.6% | 12.6%(+20.0)#80 | 18.1%(+14.5)#6,288 |
| 81. | Puget Island | 32.4% | 12.6%(+19.8)#81 | 18.1%(+14.4)#6,314 |
| 82. | Port Orchard | 32.3% | 12.6%(+19.7)#82 | 18.1%(+14.3)#6,337 |
| 83. | Beacon Hill | 31.1% | 12.6%(+18.5)#83 | 18.1%(+13.0)#6,570 |
| 84. | Airway Heights | 30.9% | 12.6%(+18.2)#84 | 18.1%(+12.8)#6,608 |
| 85. | Rainier | 30.7% | 12.6%(+18.1)#85 | 18.1%(+12.7)#6,656 |
| 86. | Wapato | 30.5% | 12.6%(+17.9)#86 | 18.1%(+12.4)#6,691 |
| 87. | Mount Vernon | 30.4% | 12.6%(+17.8)#87 | 18.1%(+12.3)#6,718 |
| 88. | Bethel | 30.3% | 12.6%(+17.7)#88 | 18.1%(+12.3)#6,731 |
| 89. | Fords Prairie | 30.3% | 12.6%(+17.6)#89 | 18.1%(+12.2)#6,751 |
| 90. | Tieton | 30.1% | 12.6%(+17.5)#90 | 18.1%(+12.0)#6,782 |
| 91. | Yakima | 29.9% | 12.6%(+17.3)#91 | 18.1%(+11.8)#6,853 |
| 92. | Boulevard Park | 29.8% | 12.6%(+17.2)#92 | 18.1%(+11.8)#6,860 |
| 93. | Aberdeen | 29.6% | 12.6%(+17.0)#93 | 18.1%(+11.5)#6,917 |
| 94. | Omak | 29.5% | 12.6%(+16.9)#94 | 18.1%(+11.5)#6,932 |
| 95. | Ferndale | 29.3% | 12.6%(+16.7)#95 | 18.1%(+11.3)#6,971 |
| 96. | West Clarkston Highland | 29.3% | 12.6%(+16.7)#96 | 18.1%(+11.3)#6,973 |
| 97. | Millwood | 28.6% | 12.6%(+16.0)#97 | 18.1%(+10.5)#7,136 |
| 98. | Morton | 28.6% | 12.6%(+16.0)#98 | 18.1%(+10.5)#7,140 |
| 99. | Lakeland South | 28.0% | 12.6%(+15.4)#99 | 18.1%(+9.96)#7,300 |
| 100. | Mcchord Afb | 27.9% | 12.6%(+15.3)#100 | 18.1%(+9.82)#7,334 |
Common Questions
What are the Top 10 Cities with the Highest Poverty Level Among Children Under the Age of 5 in Washington?
Top 10 Cities with the Highest Poverty Level Among Children Under the Age of 5 in Washington are:
#1
100.0%
#2
100.0%
#3
100.0%
#4
100.0%
#5
100.0%
#6
100.0%
#7
100.0%
#8
100.0%
#9
100.0%
#10
100.0%
What city has the Highest Poverty Level Among Children Under the Age of 5 in Washington?
Bryant has the Highest Poverty Level Among Children Under the Age of 5 in Washington with 100.0%.
What is the Poverty Level Among Children Under the Age of 5 in the State of Washington?
Poverty Level Among Children Under the Age of 5 in Washington is 12.6%.
What is the Poverty Level Among Children Under the Age of 5 in the United States?
Poverty Level Among Children Under the Age of 5 in the United States is 18.1%.