Cities with the Highest Poverty Level Among Children Under the Age of 5 in Oklahoma
RELATED REPORTS & OPTIONS
Highest Poverty | Child 0-5
Oklahoma
Compare Cities
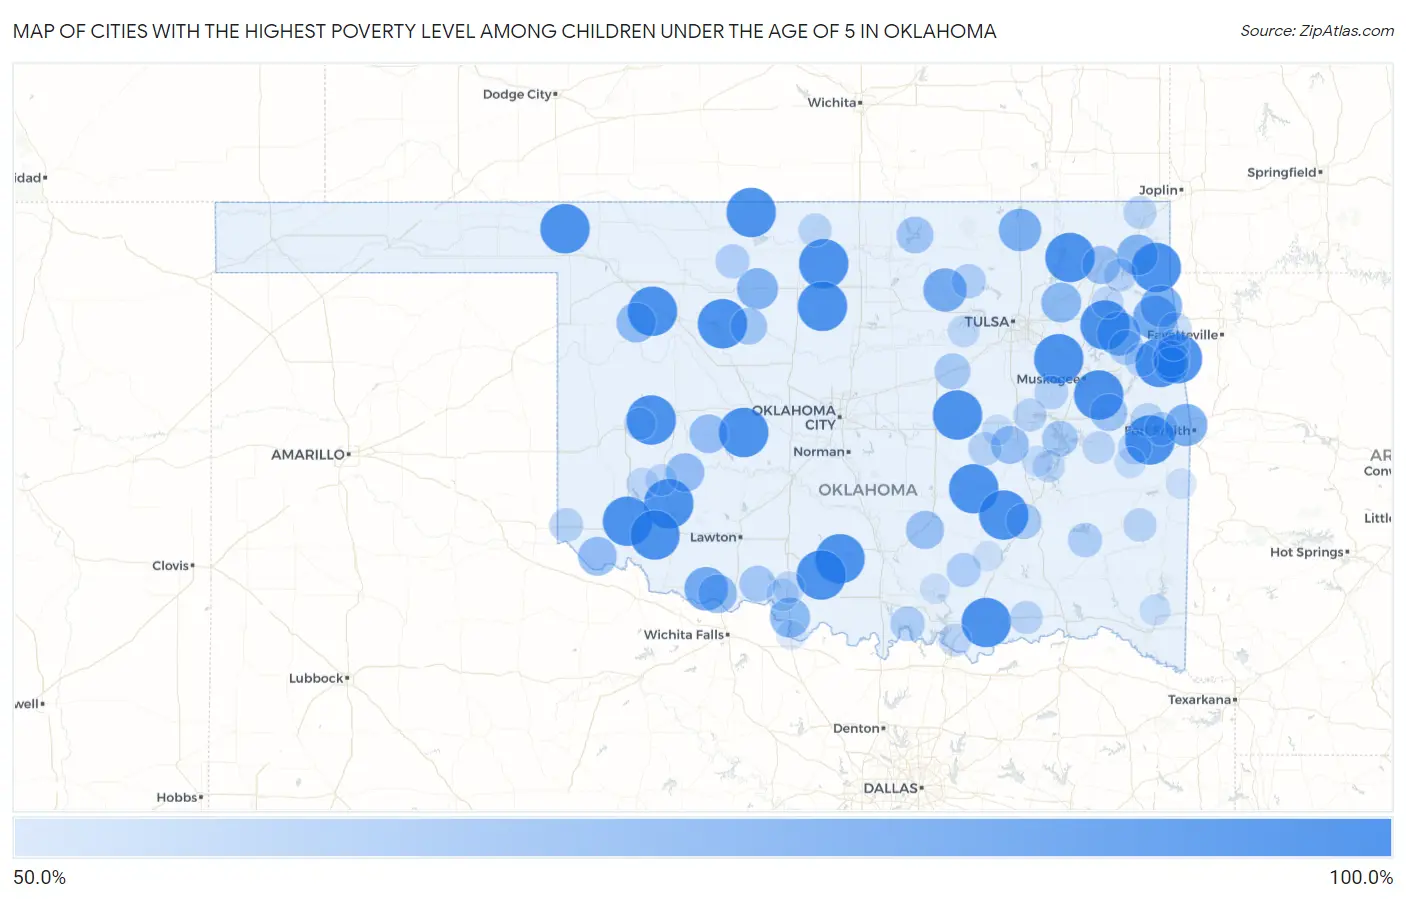
Map of Cities with the Highest Poverty Level Among Children Under the Age of 5 in Oklahoma
0.0%
100.0%
Cities with the Highest Poverty Level Among Children Under the Age of 5 in Oklahoma
| City | Child Poverty | vs State | vs National | |
| 1. | Boley | 100.0% | 23.3%(+76.7)#1 | 18.1%(+81.9)#148 |
| 2. | Roosevelt | 100.0% | 23.3%(+76.7)#2 | 18.1%(+81.9)#485 |
| 3. | Cedar Crest | 100.0% | 23.3%(+76.7)#3 | 18.1%(+81.9)#492 |
| 4. | River Bottom | 100.0% | 23.3%(+76.7)#4 | 18.1%(+81.9)#511 |
| 5. | Hanson | 100.0% | 23.3%(+76.7)#5 | 18.1%(+81.9)#620 |
| 6. | Butler | 100.0% | 23.3%(+76.7)#6 | 18.1%(+81.9)#622 |
| 7. | Longdale | 100.0% | 23.3%(+76.7)#7 | 18.1%(+81.9)#635 |
| 8. | Foss | 100.0% | 23.3%(+76.7)#8 | 18.1%(+81.9)#643 |
| 9. | Oak Hill-Piney | 100.0% | 23.3%(+76.7)#9 | 18.1%(+81.9)#668 |
| 10. | Hunter | 100.0% | 23.3%(+76.7)#10 | 18.1%(+81.9)#697 |
| 11. | Martha | 100.0% | 23.3%(+76.7)#11 | 18.1%(+81.9)#702 |
| 12. | Redbird | 100.0% | 23.3%(+76.7)#12 | 18.1%(+81.9)#749 |
| 13. | Ratliff City | 100.0% | 23.3%(+76.7)#13 | 18.1%(+81.9)#757 |
| 14. | Blue | 100.0% | 23.3%(+76.7)#14 | 18.1%(+81.9)#772 |
| 15. | Atwood | 100.0% | 23.3%(+76.7)#15 | 18.1%(+81.9)#780 |
| 16. | Cowlington | 100.0% | 23.3%(+76.7)#16 | 18.1%(+81.9)#783 |
| 17. | Lookeba | 100.0% | 23.3%(+76.7)#17 | 18.1%(+81.9)#788 |
| 18. | Headrick | 100.0% | 23.3%(+76.7)#18 | 18.1%(+81.9)#797 |
| 19. | Loco | 100.0% | 23.3%(+76.7)#19 | 18.1%(+81.9)#828 |
| 20. | Mulberry | 100.0% | 23.3%(+76.7)#20 | 18.1%(+81.9)#834 |
| 21. | New Alluwe | 100.0% | 23.3%(+76.7)#21 | 18.1%(+81.9)#842 |
| 22. | Ashland | 100.0% | 23.3%(+76.7)#22 | 18.1%(+81.9)#875 |
| 23. | Bunch | 100.0% | 23.3%(+76.7)#23 | 18.1%(+81.9)#890 |
| 24. | Elohim | 100.0% | 23.3%(+76.7)#24 | 18.1%(+81.9)#891 |
| 25. | Douglas | 100.0% | 23.3%(+76.7)#25 | 18.1%(+81.9)#893 |
| 26. | Rosston | 100.0% | 23.3%(+76.7)#26 | 18.1%(+81.9)#896 |
| 27. | Mutual | 100.0% | 23.3%(+76.7)#27 | 18.1%(+81.9)#899 |
| 28. | Amorita | 100.0% | 23.3%(+76.7)#28 | 18.1%(+81.9)#902 |
| 29. | Piney | 100.0% | 23.3%(+76.7)#29 | 18.1%(+81.9)#905 |
| 30. | Avard | 100.0% | 23.3%(+76.7)#30 | 18.1%(+81.9)#911 |
| 31. | Flint Creek | 86.7% | 23.3%(+63.3)#31 | 18.1%(+68.6)#1,106 |
| 32. | Peggs | 86.5% | 23.3%(+63.2)#32 | 18.1%(+68.5)#1,115 |
| 33. | Grandfield | 86.2% | 23.3%(+62.9)#33 | 18.1%(+68.1)#1,123 |
| 34. | Blackburn | 85.7% | 23.3%(+62.4)#34 | 18.1%(+67.7)#1,148 |
| 35. | Dewey | 83.5% | 23.3%(+60.1)#35 | 18.1%(+65.4)#1,203 |
| 36. | Moffett | 83.3% | 23.3%(+60.0)#36 | 18.1%(+65.3)#1,236 |
| 37. | Colcord | 82.4% | 23.3%(+59.0)#37 | 18.1%(+64.3)#1,253 |
| 38. | Ringwood | 80.6% | 23.3%(+57.2)#38 | 18.1%(+62.5)#1,310 |
| 39. | Bernice | 80.0% | 23.3%(+56.7)#39 | 18.1%(+61.9)#1,332 |
| 40. | Ryan | 78.0% | 23.3%(+54.7)#40 | 18.1%(+60.0)#1,401 |
| 41. | Justice | 77.8% | 23.3%(+54.4)#41 | 18.1%(+59.7)#1,407 |
| 42. | Vici | 77.1% | 23.3%(+53.8)#42 | 18.1%(+59.1)#1,440 |
| 43. | Eldorado | 75.0% | 23.3%(+51.7)#43 | 18.1%(+56.9)#1,525 |
| 44. | Gotebo | 75.0% | 23.3%(+51.7)#44 | 18.1%(+56.9)#1,532 |
| 45. | Devol | 75.0% | 23.3%(+51.7)#45 | 18.1%(+56.9)#1,547 |
| 46. | Colony | 75.0% | 23.3%(+51.7)#46 | 18.1%(+56.9)#1,550 |
| 47. | White Eagle | 74.4% | 23.3%(+51.0)#47 | 18.1%(+56.3)#1,571 |
| 48. | Big Cabin | 73.7% | 23.3%(+50.3)#48 | 18.1%(+55.6)#1,607 |
| 49. | Fitzhugh | 73.4% | 23.3%(+50.1)#49 | 18.1%(+55.4)#1,615 |
| 50. | Dustin | 73.0% | 23.3%(+49.6)#50 | 18.1%(+54.9)#1,636 |
| 51. | Webbers Falls | 71.4% | 23.3%(+48.1)#51 | 18.1%(+53.4)#1,702 |
| 52. | Okeene | 70.6% | 23.3%(+47.3)#52 | 18.1%(+52.6)#1,747 |
| 53. | Kaw City | 70.6% | 23.3%(+47.2)#53 | 18.1%(+52.5)#1,753 |
| 54. | Tonkawa Tribal Housing | 70.4% | 23.3%(+47.0)#54 | 18.1%(+52.3)#1,761 |
| 55. | Peavine | 70.0% | 23.3%(+46.7)#55 | 18.1%(+51.9)#1,783 |
| 56. | Temple | 68.9% | 23.3%(+45.5)#56 | 18.1%(+50.8)#1,850 |
| 57. | Depew | 68.4% | 23.3%(+45.1)#57 | 18.1%(+50.4)#1,878 |
| 58. | Eufaula | 68.3% | 23.3%(+44.9)#58 | 18.1%(+50.2)#1,881 |
| 59. | Kiowa | 67.9% | 23.3%(+44.5)#59 | 18.1%(+49.8)#1,903 |
| 60. | Fairfield | 67.9% | 23.3%(+44.5)#60 | 18.1%(+49.8)#1,904 |
| 61. | Grandview | 66.7% | 23.3%(+43.3)#61 | 18.1%(+48.6)#1,973 |
| 62. | Lebanon | 65.6% | 23.3%(+42.3)#62 | 18.1%(+47.6)#2,073 |
| 63. | Hominy | 65.5% | 23.3%(+42.1)#63 | 18.1%(+47.4)#2,083 |
| 64. | Wapanucka | 65.0% | 23.3%(+41.7)#64 | 18.1%(+46.9)#2,115 |
| 65. | Clayton | 64.9% | 23.3%(+41.6)#65 | 18.1%(+46.8)#2,123 |
| 66. | Carmen | 64.7% | 23.3%(+41.4)#66 | 18.1%(+46.6)#2,140 |
| 67. | Hollis | 63.9% | 23.3%(+40.5)#67 | 18.1%(+45.8)#2,190 |
| 68. | Boynton | 63.6% | 23.3%(+40.3)#68 | 18.1%(+45.6)#2,217 |
| 69. | Sallisaw | 63.5% | 23.3%(+40.1)#69 | 18.1%(+45.4)#2,227 |
| 70. | Wetumka | 63.3% | 23.3%(+40.0)#70 | 18.1%(+45.3)#2,230 |
| 71. | Gans | 63.3% | 23.3%(+40.0)#71 | 18.1%(+45.3)#2,232 |
| 72. | Keota | 63.2% | 23.3%(+39.8)#72 | 18.1%(+45.1)#2,244 |
| 73. | Medford | 62.5% | 23.3%(+39.2)#73 | 18.1%(+44.4)#2,293 |
| 74. | Welling | 62.5% | 23.3%(+39.2)#74 | 18.1%(+44.4)#2,296 |
| 75. | Whitesboro | 62.5% | 23.3%(+39.2)#75 | 18.1%(+44.4)#2,315 |
| 76. | Hoffman | 62.5% | 23.3%(+39.2)#76 | 18.1%(+44.4)#2,317 |
| 77. | Boswell | 62.1% | 23.3%(+38.8)#77 | 18.1%(+44.1)#2,331 |
| 78. | North Miami | 62.1% | 23.3%(+38.7)#78 | 18.1%(+44.0)#2,333 |
| 79. | Langley | 61.9% | 23.3%(+38.6)#79 | 18.1%(+43.8)#2,347 |
| 80. | Watts | 61.9% | 23.3%(+38.6)#80 | 18.1%(+43.8)#2,349 |
| 81. | Colbert | 61.6% | 23.3%(+38.3)#81 | 18.1%(+43.6)#2,366 |
| 82. | Whitefield | 61.1% | 23.3%(+37.8)#82 | 18.1%(+43.0)#2,420 |
| 83. | Waurika | 60.9% | 23.3%(+37.6)#83 | 18.1%(+42.9)#2,435 |
| 84. | Salina | 60.2% | 23.3%(+36.8)#84 | 18.1%(+42.1)#2,485 |
| 85. | Canute | 60.0% | 23.3%(+36.7)#85 | 18.1%(+41.9)#2,513 |
| 86. | Lone Wolf | 60.0% | 23.3%(+36.7)#86 | 18.1%(+41.9)#2,517 |
| 87. | Crowder | 60.0% | 23.3%(+36.7)#87 | 18.1%(+41.9)#2,520 |
| 88. | Lawrence Creek | 60.0% | 23.3%(+36.7)#88 | 18.1%(+41.9)#2,546 |
| 89. | Cottonwood | 60.0% | 23.3%(+36.7)#89 | 18.1%(+41.9)#2,547 |
| 90. | Addington | 60.0% | 23.3%(+36.7)#90 | 18.1%(+41.9)#2,548 |
| 91. | Hobart | 59.7% | 23.3%(+36.4)#91 | 18.1%(+41.7)#2,558 |
| 92. | Westville | 58.7% | 23.3%(+35.4)#92 | 18.1%(+40.7)#2,632 |
| 93. | Indianola | 57.9% | 23.3%(+34.5)#93 | 18.1%(+39.8)#2,695 |
| 94. | Mccurtain | 57.7% | 23.3%(+34.3)#94 | 18.1%(+39.6)#2,712 |
| 95. | Broken Bow | 57.7% | 23.3%(+34.3)#95 | 18.1%(+39.6)#2,714 |
| 96. | Weleetka | 57.4% | 23.3%(+34.1)#96 | 18.1%(+39.4)#2,734 |
| 97. | Monroe | 56.5% | 23.3%(+33.2)#97 | 18.1%(+38.5)#2,821 |
| 98. | Tishomingo | 55.9% | 23.3%(+32.6)#98 | 18.1%(+37.9)#2,870 |
| 99. | Terral | 55.6% | 23.3%(+32.2)#99 | 18.1%(+37.5)#2,919 |
| 100. | Lehigh | 55.6% | 23.3%(+32.2)#100 | 18.1%(+37.5)#2,925 |
Common Questions
What are the Top 10 Cities with the Highest Poverty Level Among Children Under the Age of 5 in Oklahoma?
Top 10 Cities with the Highest Poverty Level Among Children Under the Age of 5 in Oklahoma are:
#1
100.0%
#2
100.0%
#3
100.0%
#4
100.0%
#5
100.0%
#6
100.0%
#7
100.0%
#8
100.0%
#9
100.0%
#10
100.0%
What city has the Highest Poverty Level Among Children Under the Age of 5 in Oklahoma?
Boley has the Highest Poverty Level Among Children Under the Age of 5 in Oklahoma with 100.0%.
What is the Poverty Level Among Children Under the Age of 5 in the State of Oklahoma?
Poverty Level Among Children Under the Age of 5 in Oklahoma is 23.3%.
What is the Poverty Level Among Children Under the Age of 5 in the United States?
Poverty Level Among Children Under the Age of 5 in the United States is 18.1%.