Cities with the Highest Poverty Level Among Children Under the Age of 5 in North Carolina
RELATED REPORTS & OPTIONS
Highest Poverty | Child 0-5
North Carolina
Compare Cities
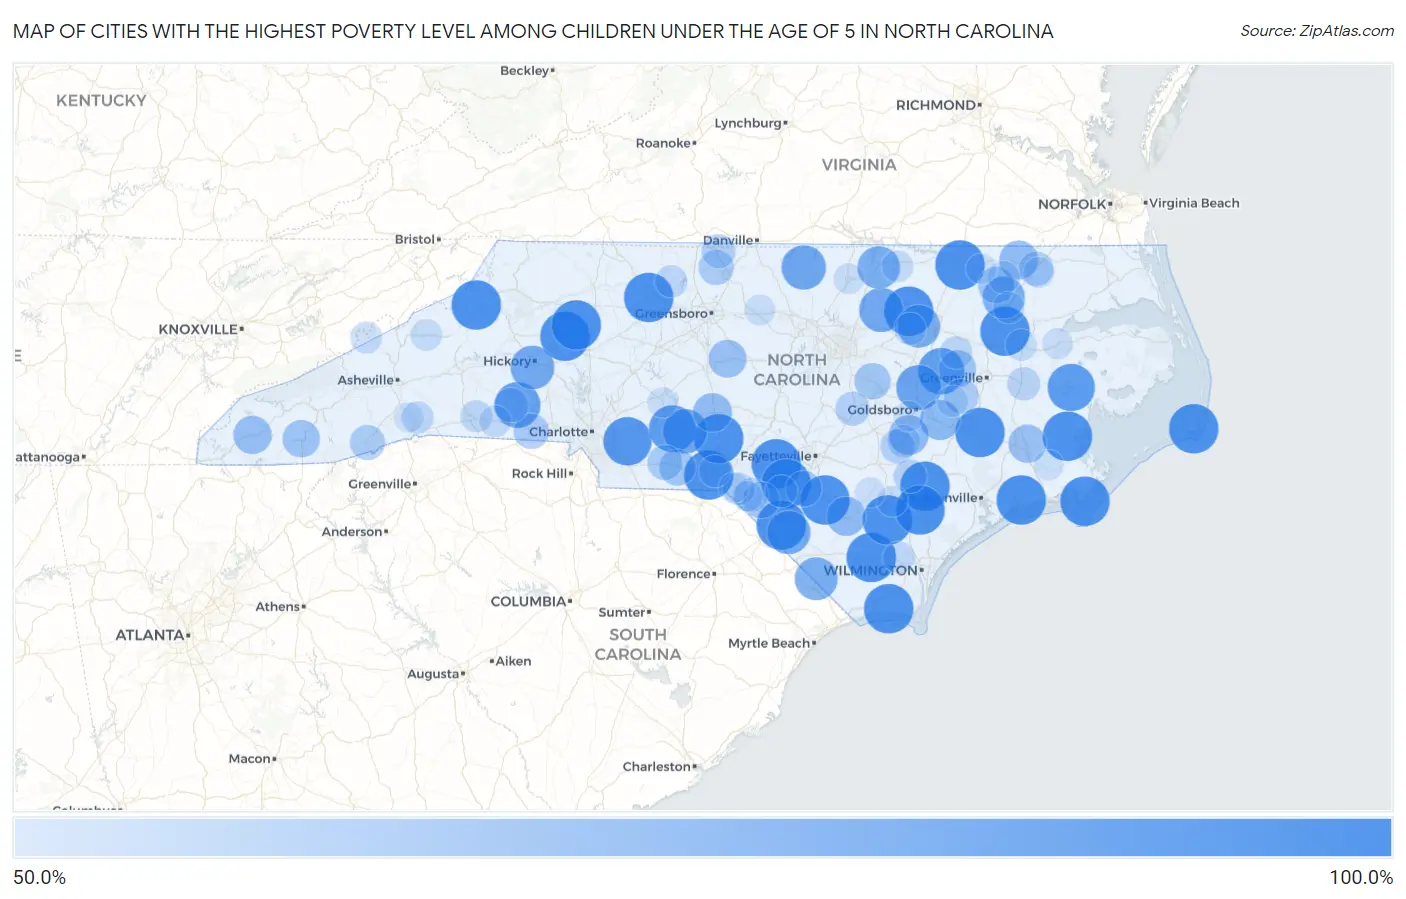
Map of Cities with the Highest Poverty Level Among Children Under the Age of 5 in North Carolina
0.0%
100.0%
Cities with the Highest Poverty Level Among Children Under the Age of 5 in North Carolina
| City | Child Poverty | vs State | vs National | |
| 1. | Buxton | 100.0% | 20.3%(+79.7)#1 | 18.1%(+81.9)#98 |
| 2. | Cordova | 100.0% | 20.3%(+79.7)#2 | 18.1%(+81.9)#116 |
| 3. | Varnamtown | 100.0% | 20.3%(+79.7)#3 | 18.1%(+81.9)#205 |
| 4. | Silver City | 100.0% | 20.3%(+79.7)#4 | 18.1%(+81.9)#206 |
| 5. | Greenevers | 100.0% | 20.3%(+79.7)#5 | 18.1%(+81.9)#213 |
| 6. | Peletier | 100.0% | 20.3%(+79.7)#6 | 18.1%(+81.9)#223 |
| 7. | South Weldon | 100.0% | 20.3%(+79.7)#7 | 18.1%(+81.9)#269 |
| 8. | Bolton | 100.0% | 20.3%(+79.7)#8 | 18.1%(+81.9)#284 |
| 9. | Sugar Mountain | 100.0% | 20.3%(+79.7)#9 | 18.1%(+81.9)#324 |
| 10. | Deep Run | 100.0% | 20.3%(+79.7)#10 | 18.1%(+81.9)#326 |
| 11. | Dover | 100.0% | 20.3%(+79.7)#11 | 18.1%(+81.9)#344 |
| 12. | Ivanhoe | 100.0% | 20.3%(+79.7)#12 | 18.1%(+81.9)#348 |
| 13. | Marshallberg | 100.0% | 20.3%(+79.7)#13 | 18.1%(+81.9)#353 |
| 14. | Bethania | 100.0% | 20.3%(+79.7)#14 | 18.1%(+81.9)#418 |
| 15. | Hiddenite | 100.0% | 20.3%(+79.7)#15 | 18.1%(+81.9)#430 |
| 16. | Castalia | 100.0% | 20.3%(+79.7)#16 | 18.1%(+81.9)#491 |
| 17. | Shannon | 100.0% | 20.3%(+79.7)#17 | 18.1%(+81.9)#506 |
| 18. | Watha | 100.0% | 20.3%(+79.7)#18 | 18.1%(+81.9)#529 |
| 19. | Vandemere | 100.0% | 20.3%(+79.7)#19 | 18.1%(+81.9)#553 |
| 20. | Norman | 100.0% | 20.3%(+79.7)#20 | 18.1%(+81.9)#617 |
| 21. | Hamilton | 100.0% | 20.3%(+79.7)#21 | 18.1%(+81.9)#625 |
| 22. | Love Valley | 100.0% | 20.3%(+79.7)#22 | 18.1%(+81.9)#698 |
| 23. | Tar Heel | 100.0% | 20.3%(+79.7)#23 | 18.1%(+81.9)#748 |
| 24. | Mcdonald | 100.0% | 20.3%(+79.7)#24 | 18.1%(+81.9)#767 |
| 25. | Fairview | 97.1% | 20.3%(+76.9)#25 | 18.1%(+79.1)#916 |
| 26. | Belhaven | 94.6% | 20.3%(+74.3)#26 | 18.1%(+76.5)#944 |
| 27. | Norwood | 94.1% | 20.3%(+73.8)#27 | 18.1%(+76.1)#949 |
| 28. | Saratoga | 92.9% | 20.3%(+72.6)#28 | 18.1%(+74.8)#969 |
| 29. | Fallston | 91.4% | 20.3%(+71.1)#29 | 18.1%(+73.3)#1,000 |
| 30. | Fremont | 89.4% | 20.3%(+69.1)#30 | 18.1%(+71.3)#1,038 |
| 31. | Mount Gilead | 88.5% | 20.3%(+68.2)#31 | 18.1%(+70.4)#1,049 |
| 32. | Roxboro | 88.0% | 20.3%(+67.7)#32 | 18.1%(+69.9)#1,062 |
| 33. | Louisburg | 87.3% | 20.3%(+67.0)#33 | 18.1%(+69.2)#1,091 |
| 34. | Mountain View | 86.4% | 20.3%(+66.1)#34 | 18.1%(+68.3)#1,118 |
| 35. | Fairmont | 85.8% | 20.3%(+65.5)#35 | 18.1%(+67.8)#1,132 |
| 36. | Tabor City | 84.7% | 20.3%(+64.4)#36 | 18.1%(+66.6)#1,164 |
| 37. | Nashville | 84.4% | 20.3%(+64.1)#37 | 18.1%(+66.3)#1,175 |
| 38. | Middleburg | 83.7% | 20.3%(+63.4)#38 | 18.1%(+65.7)#1,200 |
| 39. | Kelford | 83.3% | 20.3%(+63.1)#39 | 18.1%(+65.3)#1,219 |
| 40. | La Grange | 78.1% | 20.3%(+57.8)#40 | 18.1%(+60.0)#1,400 |
| 41. | Mount Olive | 77.1% | 20.3%(+56.9)#41 | 18.1%(+59.1)#1,438 |
| 42. | Elizabethtown | 76.1% | 20.3%(+55.8)#42 | 18.1%(+58.0)#1,483 |
| 43. | Murfreesboro | 75.6% | 20.3%(+55.3)#43 | 18.1%(+57.5)#1,495 |
| 44. | Biscoe | 75.6% | 20.3%(+55.3)#44 | 18.1%(+57.5)#1,496 |
| 45. | Andrews | 73.8% | 20.3%(+53.6)#45 | 18.1%(+55.8)#1,592 |
| 46. | Arrowhead Beach | 73.8% | 20.3%(+53.5)#46 | 18.1%(+55.7)#1,597 |
| 47. | Bridgeton | 73.4% | 20.3%(+53.2)#47 | 18.1%(+55.4)#1,614 |
| 48. | Ramseur | 73.0% | 20.3%(+52.8)#48 | 18.1%(+55.0)#1,634 |
| 49. | Franklin | 71.7% | 20.3%(+51.4)#49 | 18.1%(+53.6)#1,685 |
| 50. | Fountain | 71.4% | 20.3%(+51.1)#50 | 18.1%(+53.4)#1,705 |
| 51. | Maxton | 70.2% | 20.3%(+49.9)#51 | 18.1%(+52.1)#1,771 |
| 52. | Rich Square | 70.0% | 20.3%(+49.7)#52 | 18.1%(+51.9)#1,778 |
| 53. | Wilson S Mills | 69.6% | 20.3%(+49.3)#53 | 18.1%(+51.5)#1,803 |
| 54. | Wadesboro | 69.6% | 20.3%(+49.3)#54 | 18.1%(+51.5)#1,804 |
| 55. | St Pauls | 68.4% | 20.3%(+48.1)#55 | 18.1%(+50.3)#1,879 |
| 56. | Kings Mountain | 67.4% | 20.3%(+47.1)#56 | 18.1%(+49.3)#1,933 |
| 57. | Polkton | 66.7% | 20.3%(+46.4)#57 | 18.1%(+48.6)#1,963 |
| 58. | Wentworth | 66.7% | 20.3%(+46.4)#58 | 18.1%(+48.6)#1,964 |
| 59. | Rosman | 66.7% | 20.3%(+46.4)#59 | 18.1%(+48.6)#1,983 |
| 60. | Maury | 65.9% | 20.3%(+45.6)#60 | 18.1%(+47.8)#2,060 |
| 61. | Winton | 65.2% | 20.3%(+44.9)#61 | 18.1%(+47.2)#2,100 |
| 62. | Lawndale | 65.2% | 20.3%(+44.9)#62 | 18.1%(+47.2)#2,101 |
| 63. | Faison | 64.7% | 20.3%(+44.4)#63 | 18.1%(+46.6)#2,131 |
| 64. | East Laurinburg | 64.7% | 20.3%(+44.4)#64 | 18.1%(+46.6)#2,139 |
| 65. | Eden | 64.4% | 20.3%(+44.1)#65 | 18.1%(+46.3)#2,158 |
| 66. | Benson | 64.3% | 20.3%(+44.1)#66 | 18.1%(+46.3)#2,160 |
| 67. | Grandy | 63.3% | 20.3%(+43.1)#67 | 18.1%(+45.3)#2,229 |
| 68. | Magnolia | 63.1% | 20.3%(+42.8)#68 | 18.1%(+45.0)#2,250 |
| 69. | Washington | 62.5% | 20.3%(+42.2)#69 | 18.1%(+44.5)#2,288 |
| 70. | Calypso | 61.1% | 20.3%(+40.8)#70 | 18.1%(+43.0)#2,421 |
| 71. | Pinetops | 60.9% | 20.3%(+40.7)#71 | 18.1%(+42.9)#2,431 |
| 72. | Woodland | 60.7% | 20.3%(+40.4)#72 | 18.1%(+42.7)#2,453 |
| 73. | Laurel Hill | 60.5% | 20.3%(+40.2)#73 | 18.1%(+42.4)#2,471 |
| 74. | Walnut Cove | 60.2% | 20.3%(+39.9)#74 | 18.1%(+42.1)#2,483 |
| 75. | Momeyer | 60.0% | 20.3%(+39.7)#75 | 18.1%(+41.9)#2,519 |
| 76. | Dana | 59.9% | 20.3%(+39.6)#76 | 18.1%(+41.8)#2,554 |
| 77. | Rockingham | 59.8% | 20.3%(+39.6)#77 | 18.1%(+41.8)#2,555 |
| 78. | Forest City | 59.7% | 20.3%(+39.4)#78 | 18.1%(+41.7)#2,559 |
| 79. | Red Springs | 59.6% | 20.3%(+39.4)#79 | 18.1%(+41.6)#2,563 |
| 80. | Northwest | 59.3% | 20.3%(+39.0)#80 | 18.1%(+41.2)#2,585 |
| 81. | Hot Springs | 58.8% | 20.3%(+38.5)#81 | 18.1%(+40.8)#2,617 |
| 82. | Lewiston Woodville | 58.8% | 20.3%(+38.5)#82 | 18.1%(+40.8)#2,618 |
| 83. | Mooresboro | 58.8% | 20.3%(+38.5)#83 | 18.1%(+40.8)#2,623 |
| 84. | Williamston | 58.6% | 20.3%(+38.3)#84 | 18.1%(+40.6)#2,637 |
| 85. | Burnsville | 58.5% | 20.3%(+38.3)#85 | 18.1%(+40.5)#2,643 |
| 86. | Warrenton | 58.5% | 20.3%(+38.3)#86 | 18.1%(+40.5)#2,646 |
| 87. | Snow Hill | 58.3% | 20.3%(+38.0)#87 | 18.1%(+40.2)#2,677 |
| 88. | Plymouth | 57.1% | 20.3%(+36.9)#88 | 18.1%(+39.1)#2,745 |
| 89. | Cofield | 57.1% | 20.3%(+36.9)#89 | 18.1%(+39.1)#2,763 |
| 90. | Harrells | 57.1% | 20.3%(+36.9)#90 | 18.1%(+39.1)#2,770 |
| 91. | Haw River | 57.0% | 20.3%(+36.7)#91 | 18.1%(+38.9)#2,783 |
| 92. | Oxford | 56.6% | 20.3%(+36.4)#92 | 18.1%(+38.6)#2,807 |
| 93. | Mar Mac | 56.2% | 20.3%(+35.9)#93 | 18.1%(+38.1)#2,850 |
| 94. | Laurinburg | 56.2% | 20.3%(+35.9)#94 | 18.1%(+38.1)#2,851 |
| 95. | Garland | 56.1% | 20.3%(+35.8)#95 | 18.1%(+38.1)#2,853 |
| 96. | New London | 56.1% | 20.3%(+35.8)#96 | 18.1%(+38.0)#2,856 |
| 97. | Jackson | 55.6% | 20.3%(+35.3)#97 | 18.1%(+37.5)#2,908 |
| 98. | Minnesott Beach | 55.6% | 20.3%(+35.3)#98 | 18.1%(+37.5)#2,912 |
| 99. | Old Hundred | 55.6% | 20.3%(+35.3)#99 | 18.1%(+37.5)#2,920 |
| 100. | Hendersonville | 55.5% | 20.3%(+35.2)#100 | 18.1%(+37.4)#2,935 |
Common Questions
What are the Top 10 Cities with the Highest Poverty Level Among Children Under the Age of 5 in North Carolina?
Top 10 Cities with the Highest Poverty Level Among Children Under the Age of 5 in North Carolina are:
#1
100.0%
#2
100.0%
#3
100.0%
#4
100.0%
#5
100.0%
#6
100.0%
#7
100.0%
#8
100.0%
#9
100.0%
#10
100.0%
What city has the Highest Poverty Level Among Children Under the Age of 5 in North Carolina?
Buxton has the Highest Poverty Level Among Children Under the Age of 5 in North Carolina with 100.0%.
What is the Poverty Level Among Children Under the Age of 5 in the State of North Carolina?
Poverty Level Among Children Under the Age of 5 in North Carolina is 20.3%.
What is the Poverty Level Among Children Under the Age of 5 in the United States?
Poverty Level Among Children Under the Age of 5 in the United States is 18.1%.