Cities with the Highest Poverty Level Among Children Under the Age of 5 in Delaware
RELATED REPORTS & OPTIONS
Highest Poverty | Child 0-5
Delaware
Compare Cities
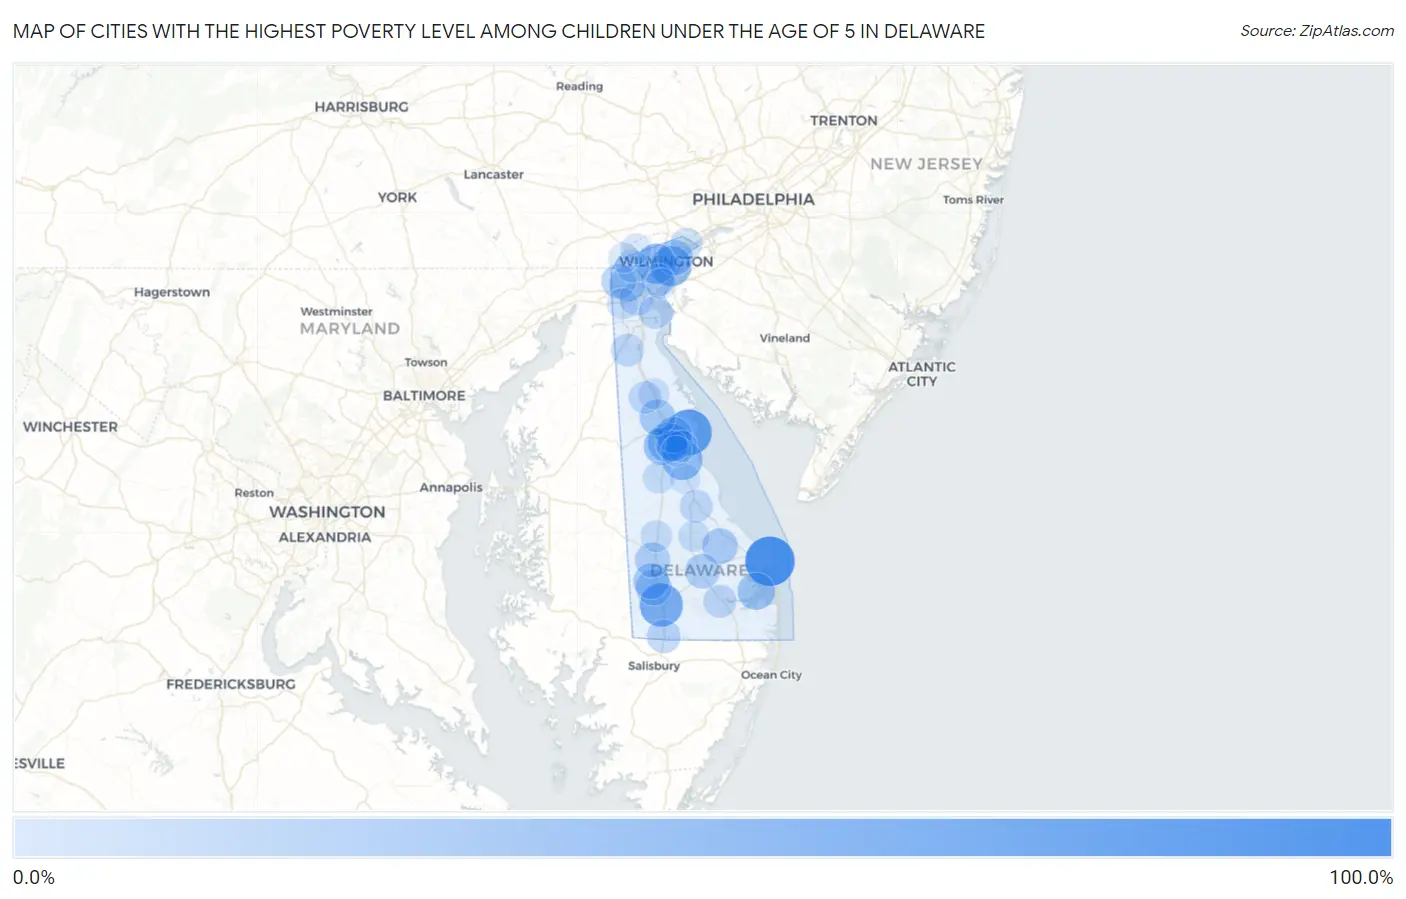
Map of Cities with the Highest Poverty Level Among Children Under the Age of 5 in Delaware
0.0%
100.0%
Cities with the Highest Poverty Level Among Children Under the Age of 5 in Delaware
| City | Child Poverty | vs State | vs National | |
| 1. | Rehoboth Beach | 100.0% | 19.1%(+80.9)#1 | 18.1%(+81.9)#109 |
| 2. | Little Creek | 81.8% | 19.1%(+62.8)#2 | 18.1%(+63.8)#1,270 |
| 3. | Laurel | 68.0% | 19.1%(+48.9)#3 | 18.1%(+49.9)#1,896 |
| 4. | Wilmington | 52.4% | 19.1%(+33.3)#4 | 18.1%(+34.3)#3,191 |
| 5. | Elsmere | 50.6% | 19.1%(+31.5)#5 | 18.1%(+32.5)#3,359 |
| 6. | Magnolia | 50.0% | 19.1%(+30.9)#6 | 18.1%(+31.9)#3,505 |
| 7. | Rodney Village | 46.1% | 19.1%(+27.0)#7 | 18.1%(+28.0)#4,013 |
| 8. | Wyoming | 38.5% | 19.1%(+19.5)#8 | 18.1%(+20.5)#5,129 |
| 9. | Long Neck | 36.1% | 19.1%(+17.0)#9 | 18.1%(+18.0)#5,561 |
| 10. | Kent Acres | 34.6% | 19.1%(+15.6)#10 | 18.1%(+16.6)#5,837 |
| 11. | Dover | 30.1% | 19.1%(+11.0)#11 | 18.1%(+12.0)#6,781 |
| 12. | Cheswold | 29.9% | 19.1%(+10.9)#12 | 18.1%(+11.9)#6,838 |
| 13. | Blades | 29.6% | 19.1%(+10.6)#13 | 18.1%(+11.6)#6,907 |
| 14. | Seaford | 28.3% | 19.1%(+9.22)#14 | 18.1%(+10.2)#7,250 |
| 15. | Milton | 28.0% | 19.1%(+8.98)#15 | 18.1%(+9.98)#7,297 |
| 16. | Edgemoor | 27.6% | 19.1%(+8.58)#16 | 18.1%(+9.58)#7,396 |
| 17. | Brookside | 26.8% | 19.1%(+7.73)#17 | 18.1%(+8.73)#7,613 |
| 18. | Bridgeville | 25.4% | 19.1%(+6.30)#18 | 18.1%(+7.30)#7,953 |
| 19. | Georgetown | 23.8% | 19.1%(+4.71)#19 | 18.1%(+5.71)#8,412 |
| 20. | Newark | 22.5% | 19.1%(+3.40)#20 | 18.1%(+4.40)#8,788 |
| 21. | Delmar | 18.1% | 19.1%(-0.931)#21 | 18.1%(+0.069)#10,190 |
| 22. | Bear | 17.2% | 19.1%(-1.88)#22 | 18.1%(-0.879)#10,498 |
| 23. | Wilmington Manor | 15.3% | 19.1%(-3.76)#23 | 18.1%(-2.76)#11,152 |
| 24. | Millsboro | 15.2% | 19.1%(-3.82)#24 | 18.1%(-2.82)#11,168 |
| 25. | Middletown | 14.5% | 19.1%(-4.59)#25 | 18.1%(-3.59)#11,425 |
| 26. | Pike Creek Valley | 14.4% | 19.1%(-4.62)#26 | 18.1%(-3.62)#11,432 |
| 27. | Milford | 14.2% | 19.1%(-4.86)#27 | 18.1%(-3.86)#11,546 |
| 28. | Delaware City | 13.3% | 19.1%(-5.73)#28 | 18.1%(-4.73)#11,860 |
| 29. | Clayton | 12.4% | 19.1%(-6.67)#29 | 18.1%(-5.67)#12,256 |
| 30. | Greenwood | 9.4% | 19.1%(-9.66)#30 | 18.1%(-8.66)#13,405 |
| 31. | Claymont | 9.4% | 19.1%(-9.68)#31 | 18.1%(-8.68)#13,407 |
| 32. | Felton | 8.8% | 19.1%(-10.2)#32 | 18.1%(-9.24)#13,651 |
| 33. | Dover Base Housing | 7.1% | 19.1%(-12.0)#33 | 18.1%(-11.0)#14,372 |
| 34. | Ellendale | 6.6% | 19.1%(-12.5)#34 | 18.1%(-11.5)#14,600 |
| 35. | Highland Acres | 6.5% | 19.1%(-12.6)#35 | 18.1%(-11.6)#14,654 |
| 36. | Smyrna | 6.0% | 19.1%(-13.1)#36 | 18.1%(-12.1)#14,842 |
| 37. | Glasgow | 5.7% | 19.1%(-13.4)#37 | 18.1%(-12.4)#14,948 |
| 38. | Hockessin | 3.9% | 19.1%(-15.2)#38 | 18.1%(-14.2)#15,758 |
| 39. | New Castle | 3.1% | 19.1%(-16.0)#39 | 18.1%(-15.0)#16,100 |
| 40. | North Star | 3.0% | 19.1%(-16.0)#40 | 18.1%(-15.0)#16,114 |
| 41. | Rising Sun Lebanon | 2.8% | 19.1%(-16.3)#41 | 18.1%(-15.3)#16,230 |
| 42. | Frederica | 2.4% | 19.1%(-16.7)#42 | 18.1%(-15.7)#16,356 |
1
Common Questions
What are the Top 10 Cities with the Highest Poverty Level Among Children Under the Age of 5 in Delaware?
Top 10 Cities with the Highest Poverty Level Among Children Under the Age of 5 in Delaware are:
#1
100.0%
#2
81.8%
#3
68.0%
#4
52.4%
#5
50.6%
#6
50.0%
#7
46.1%
#8
38.5%
#9
36.1%
#10
34.6%
What city has the Highest Poverty Level Among Children Under the Age of 5 in Delaware?
Rehoboth Beach has the Highest Poverty Level Among Children Under the Age of 5 in Delaware with 100.0%.
What is the Poverty Level Among Children Under the Age of 5 in the State of Delaware?
Poverty Level Among Children Under the Age of 5 in Delaware is 19.1%.
What is the Poverty Level Among Children Under the Age of 5 in the United States?
Poverty Level Among Children Under the Age of 5 in the United States is 18.1%.