Riverdale Park, CA Map & Demographics
Riverdale Park Map
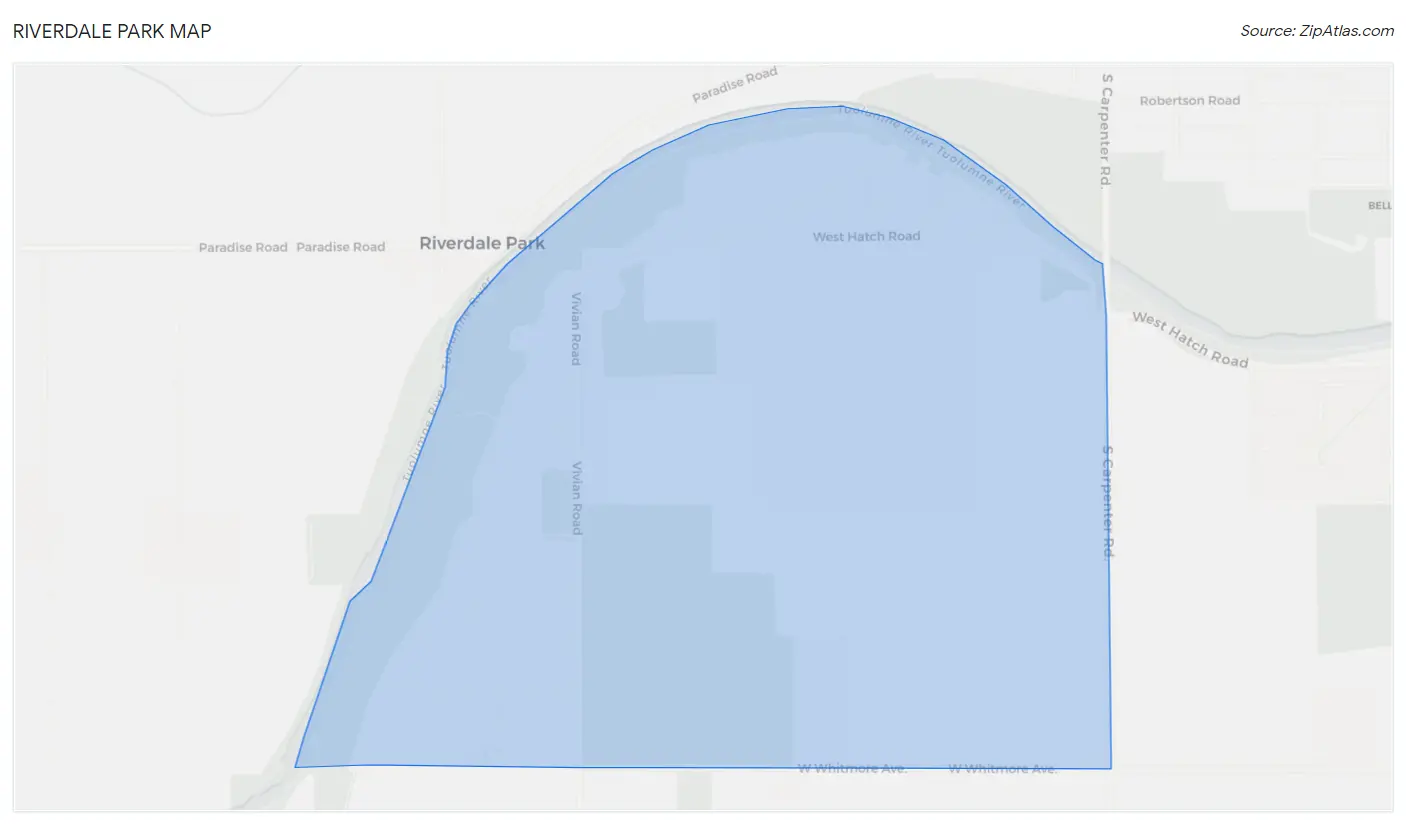
Riverdale Park Overview
$16,077
PER CAPITA INCOME
$36,504
AVG FAMILY INCOME
0.33
INEQUALITY / GINI INDEX
795
TOTAL POPULATION
519
MALE POPULATION
276
FEMALE POPULATION
188.04
MALES / 100 FEMALES
53.18
FEMALES / 100 MALES
20.2
MEDIAN AGE
5.4
AVG FAMILY SIZE
4.6
AVG HOUSEHOLD SIZE
205
LABOR FORCE [ PEOPLE ]
44.4%
PERCENT IN LABOR FORCE
Income in Riverdale Park
Income Overview in Riverdale Park
| Characteristic | Number | Measure |
| Per Capita Income | 795 | $16,077 |
| Median Family Income | 133 | $36,504 |
| Mean Family Income | 133 | $49,778 |
| Median Household Income | 174 | $0 |
| Mean Household Income | 174 | $59,354 |
| Income Deficit | 133 | $0 |
| Wage / Income Gap (%) | 795 | 0.00% |
| Wage / Income Gap ($) | 795 | 100.00¢ per $1 |
| Gini / Inequality Index | 795 | 0.33 |
Earnings by Sex in Riverdale Park
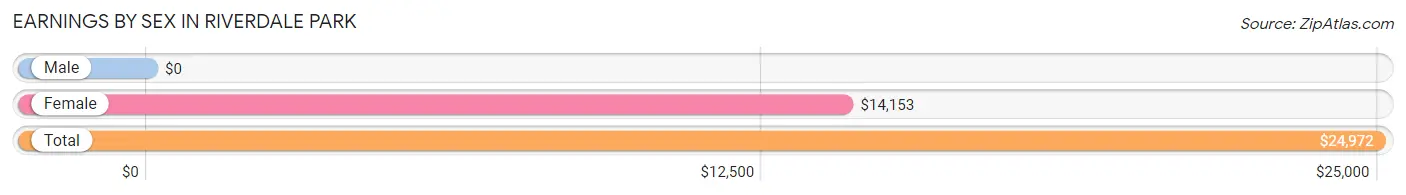
| Sex | Number | Average Earnings |
| Male | 216 (73.5%) | $0 |
| Female | 78 (26.5%) | $14,153 |
| Total | 294 (100.0%) | $24,972 |
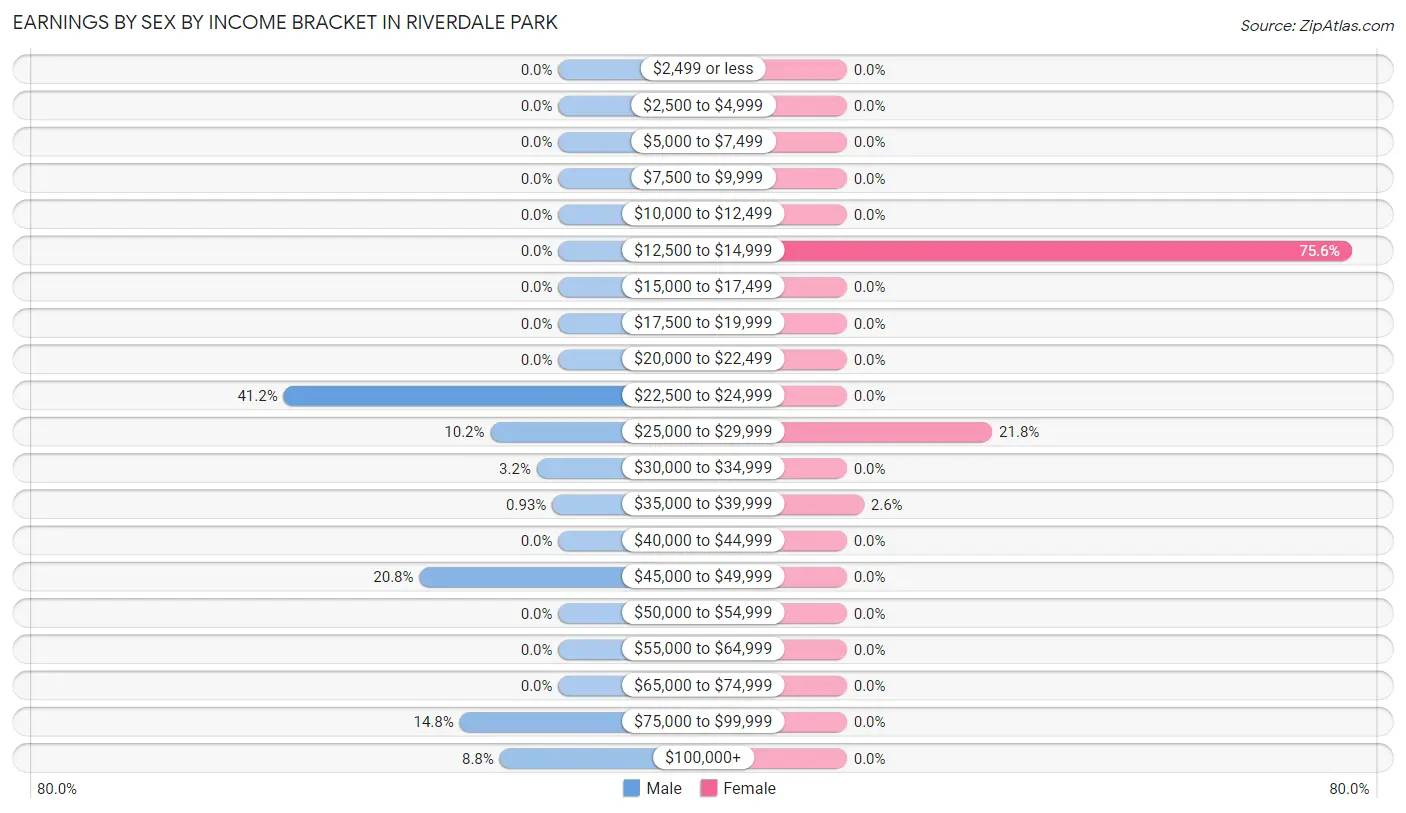
Earnings by Sex by Income Bracket in Riverdale Park
The most common earnings brackets in Riverdale Park are $22,500 to $24,999 for men (89 | 41.2%) and $12,500 to $14,999 for women (59 | 75.6%).
| Income | Male | Female |
| $2,499 or less | 0 (0.0%) | 0 (0.0%) |
| $2,500 to $4,999 | 0 (0.0%) | 0 (0.0%) |
| $5,000 to $7,499 | 0 (0.0%) | 0 (0.0%) |
| $7,500 to $9,999 | 0 (0.0%) | 0 (0.0%) |
| $10,000 to $12,499 | 0 (0.0%) | 0 (0.0%) |
| $12,500 to $14,999 | 0 (0.0%) | 59 (75.6%) |
| $15,000 to $17,499 | 0 (0.0%) | 0 (0.0%) |
| $17,500 to $19,999 | 0 (0.0%) | 0 (0.0%) |
| $20,000 to $22,499 | 0 (0.0%) | 0 (0.0%) |
| $22,500 to $24,999 | 89 (41.2%) | 0 (0.0%) |
| $25,000 to $29,999 | 22 (10.2%) | 17 (21.8%) |
| $30,000 to $34,999 | 7 (3.2%) | 0 (0.0%) |
| $35,000 to $39,999 | 2 (0.9%) | 2 (2.6%) |
| $40,000 to $44,999 | 0 (0.0%) | 0 (0.0%) |
| $45,000 to $49,999 | 45 (20.8%) | 0 (0.0%) |
| $50,000 to $54,999 | 0 (0.0%) | 0 (0.0%) |
| $55,000 to $64,999 | 0 (0.0%) | 0 (0.0%) |
| $65,000 to $74,999 | 0 (0.0%) | 0 (0.0%) |
| $75,000 to $99,999 | 32 (14.8%) | 0 (0.0%) |
| $100,000+ | 19 (8.8%) | 0 (0.0%) |
| Total | 216 (100.0%) | 78 (100.0%) |
Earnings by Sex by Educational Attainment in Riverdale Park
| Educational Attainment | Male Income | Female Income |
| Less than High School | - | - |
| High School Diploma | - | - |
| College or Associate's Degree | - | - |
| Bachelor's Degree | - | - |
| Graduate Degree | - | - |
| Total | - | - |
Family Income in Riverdale Park
Family Income Brackets in Riverdale Park
According to the Riverdale Park family income data, there are 65 families falling into the $35,000 to $49,999 income range, which is the most common income bracket and makes up 48.9% of all families.
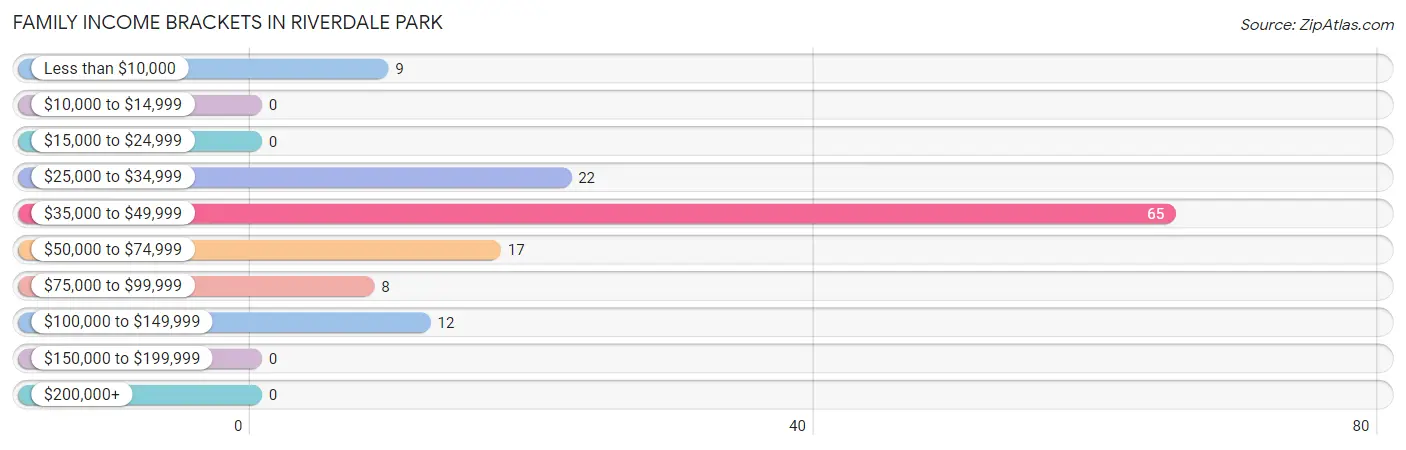
| Income Bracket | # Families | % Families |
| Less than $10,000 | 9 | 6.8% |
| $10,000 to $14,999 | 0 | 0.0% |
| $15,000 to $24,999 | 0 | 0.0% |
| $25,000 to $34,999 | 22 | 16.5% |
| $35,000 to $49,999 | 65 | 48.9% |
| $50,000 to $74,999 | 17 | 12.8% |
| $75,000 to $99,999 | 8 | 6.0% |
| $100,000 to $149,999 | 12 | 9.0% |
| $150,000 to $199,999 | 0 | 0.0% |
| $200,000+ | 0 | 0.0% |
Family Income by Famaliy Size in Riverdale Park
3-person families (25 | 18.8%) account for the highest median family income in Riverdale Park with $71,838 per family, while 3-person families (25 | 18.8%) have the highest median income of $23,946 per family member.
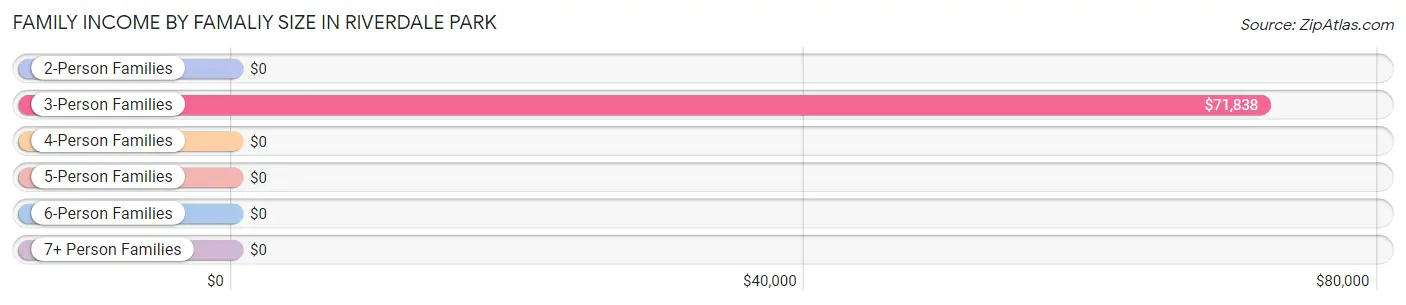
| Income Bracket | # Families | Median Income |
| 2-Person Families | 6 (4.5%) | $0 |
| 3-Person Families | 25 (18.8%) | $71,838 |
| 4-Person Families | 0 (0.0%) | $0 |
| 5-Person Families | 71 (53.4%) | $0 |
| 6-Person Families | 31 (23.3%) | $0 |
| 7+ Person Families | 0 (0.0%) | $0 |
| Total | 133 (100.0%) | $36,504 |
Family Income by Number of Earners in Riverdale Park
| Number of Earners | # Families | Median Income |
| No Earners | 21 (15.8%) | $0 |
| 1 Earner | 34 (25.6%) | $0 |
| 2 Earners | 78 (58.7%) | $0 |
| 3+ Earners | 0 (0.0%) | $0 |
| Total | 133 (100.0%) | $36,504 |
Household Income in Riverdale Park
Household Income Brackets in Riverdale Park
With 65 households falling in the category, the $35,000 to $49,999 income range is the most frequent in Riverdale Park, accounting for 37.4% of all households.
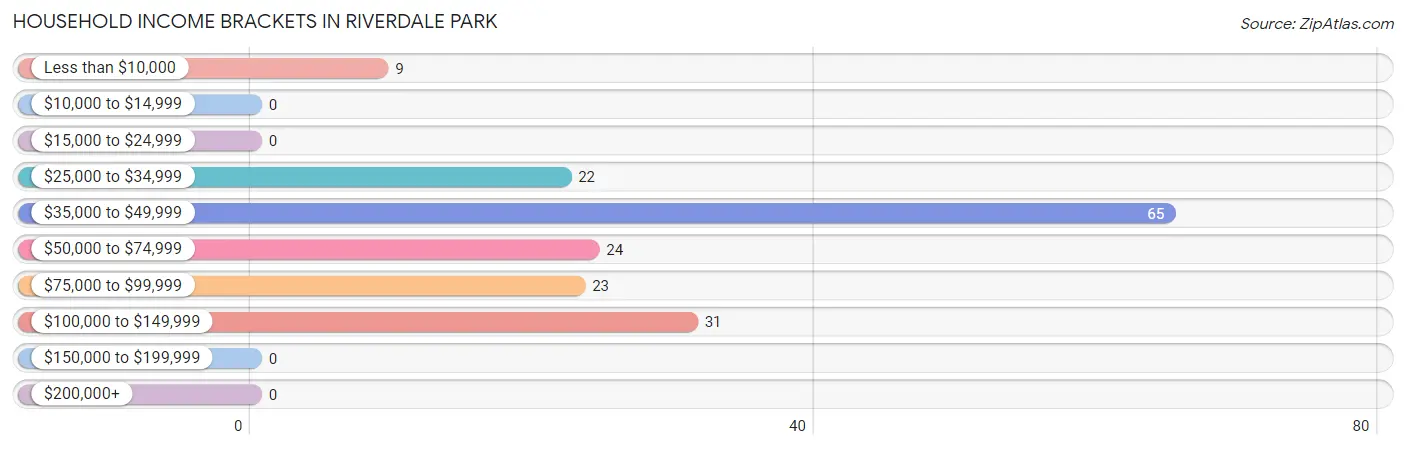
| Income Bracket | # Households | % Households |
| Less than $10,000 | 9 | 5.2% |
| $10,000 to $14,999 | 0 | 0.0% |
| $15,000 to $24,999 | 0 | 0.0% |
| $25,000 to $34,999 | 22 | 12.6% |
| $35,000 to $49,999 | 65 | 37.4% |
| $50,000 to $74,999 | 24 | 13.8% |
| $75,000 to $99,999 | 23 | 13.2% |
| $100,000 to $149,999 | 31 | 17.8% |
| $150,000 to $199,999 | 0 | 0.0% |
| $200,000+ | 0 | 0.0% |
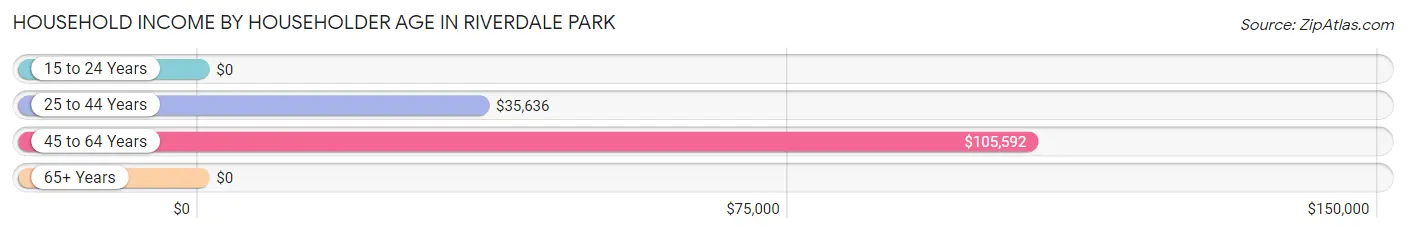
Household Income by Householder Age in Riverdale Park
The median household income in Riverdale Park is $0, with the highest median household income of $105,592 found in the 45 to 64 years age bracket for the primary householder. A total of 53 households (30.5%) fall into this category. Meanwhile, the 15 to 24 years age bracket for the primary householder has the lowest median household income of $0, with 17 households (9.8%) in this group.
| Income Bracket | # Households | Median Income |
| 15 to 24 Years | 17 (9.8%) | $0 |
| 25 to 44 Years | 92 (52.9%) | $35,636 |
| 45 to 64 Years | 53 (30.5%) | $105,592 |
| 65+ Years | 12 (6.9%) | $0 |
| Total | 174 (100.0%) | $0 |
Poverty in Riverdale Park
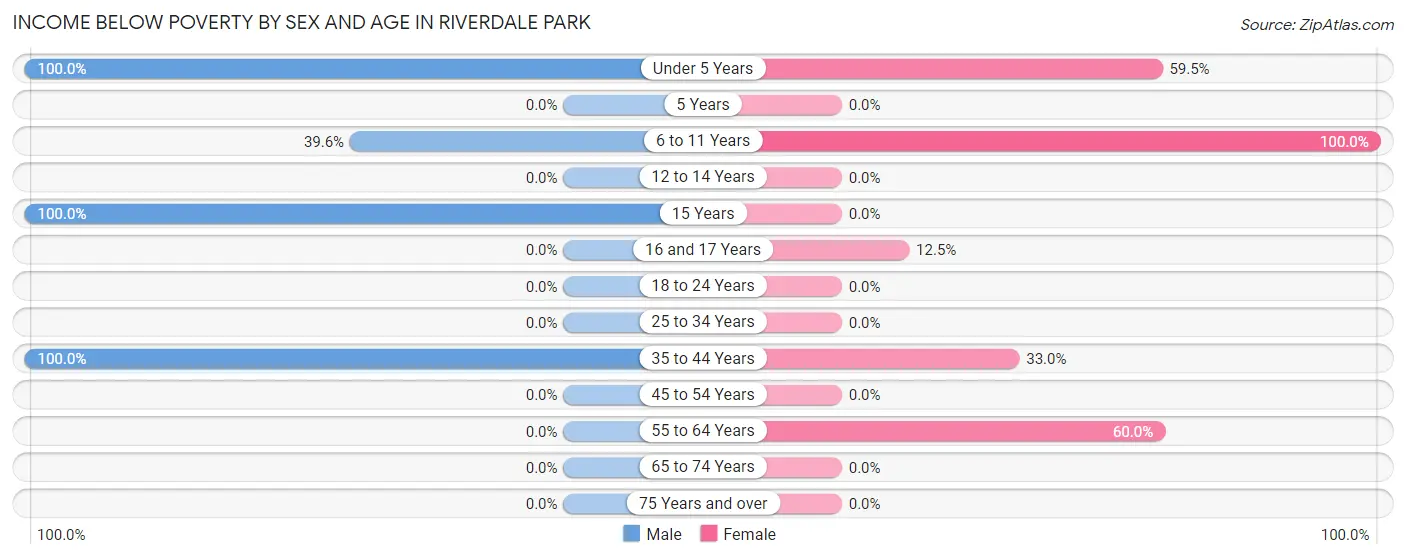
Income Below Poverty by Sex and Age in Riverdale Park
With 25.6% poverty level for males and 35.5% for females among the residents of Riverdale Park, under 5 year old males and 6 to 11 year old females are the most vulnerable to poverty, with 24 males (100.0%) and 23 females (100.0%) in their respective age groups living below the poverty level.
| Age Bracket | Male | Female |
| Under 5 Years | 24 (100.0%) | 25 (59.5%) |
| 5 Years | 0 (0.0%) | 0 (0.0%) |
| 6 to 11 Years | 61 (39.6%) | 23 (100.0%) |
| 12 to 14 Years | 0 (0.0%) | 0 (0.0%) |
| 15 Years | 10 (100.0%) | 0 (0.0%) |
| 16 and 17 Years | 0 (0.0%) | 6 (12.5%) |
| 18 to 24 Years | 0 (0.0%) | 0 (0.0%) |
| 25 to 34 Years | 0 (0.0%) | 0 (0.0%) |
| 35 to 44 Years | 38 (100.0%) | 29 (33.0%) |
| 45 to 54 Years | 0 (0.0%) | 0 (0.0%) |
| 55 to 64 Years | 0 (0.0%) | 15 (60.0%) |
| 65 to 74 Years | 0 (0.0%) | 0 (0.0%) |
| 75 Years and over | 0 (0.0%) | 0 (0.0%) |
| Total | 133 (25.6%) | 98 (35.5%) |
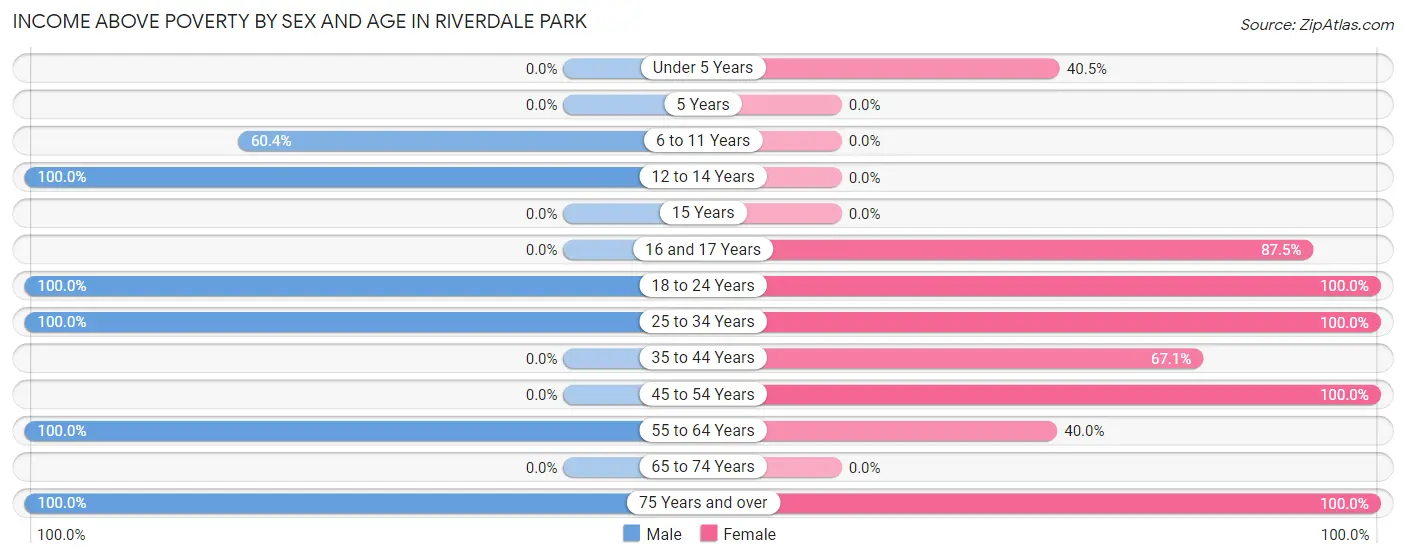
Income Above Poverty by Sex and Age in Riverdale Park
According to the poverty statistics in Riverdale Park, males aged 12 to 14 years and females aged 18 to 24 years are the age groups that are most secure financially, with 100.0% of males and 100.0% of females in these age groups living above the poverty line.
| Age Bracket | Male | Female |
| Under 5 Years | 0 (0.0%) | 17 (40.5%) |
| 5 Years | 0 (0.0%) | 0 (0.0%) |
| 6 to 11 Years | 93 (60.4%) | 0 (0.0%) |
| 12 to 14 Years | 80 (100.0%) | 0 (0.0%) |
| 15 Years | 0 (0.0%) | 0 (0.0%) |
| 16 and 17 Years | 0 (0.0%) | 42 (87.5%) |
| 18 to 24 Years | 89 (100.0%) | 17 (100.0%) |
| 25 to 34 Years | 61 (100.0%) | 2 (100.0%) |
| 35 to 44 Years | 0 (0.0%) | 59 (67.0%) |
| 45 to 54 Years | 0 (0.0%) | 24 (100.0%) |
| 55 to 64 Years | 44 (100.0%) | 10 (40.0%) |
| 65 to 74 Years | 0 (0.0%) | 0 (0.0%) |
| 75 Years and over | 19 (100.0%) | 7 (100.0%) |
| Total | 386 (74.4%) | 178 (64.5%) |
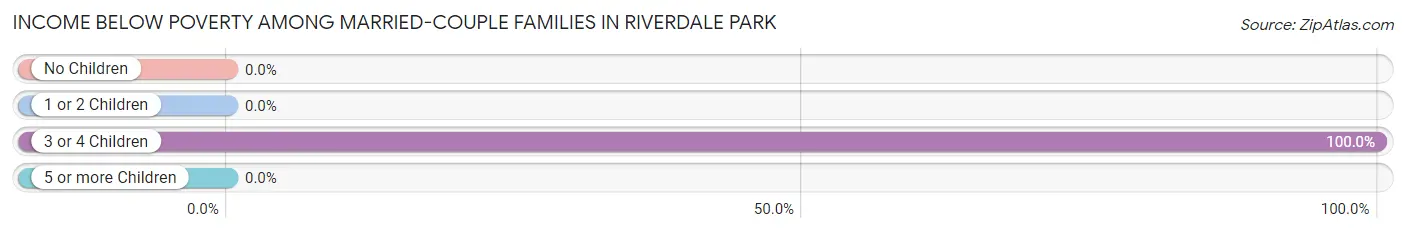
Income Below Poverty Among Married-Couple Families in Riverdale Park
The poverty statistics for married-couple families in Riverdale Park show that 48.9% or 22 of the total 45 families live below the poverty line. Families with 3 or 4 children have the highest poverty rate of 100.0%, comprising of 22 families. On the other hand, families with no children have the lowest poverty rate of 0.0%, which includes 0 families.
| Children | Above Poverty | Below Poverty |
| No Children | 6 (100.0%) | 0 (0.0%) |
| 1 or 2 Children | 17 (100.0%) | 0 (0.0%) |
| 3 or 4 Children | 0 (0.0%) | 22 (100.0%) |
| 5 or more Children | 0 (0.0%) | 0 (0.0%) |
| Total | 23 (51.1%) | 22 (48.9%) |
Income Below Poverty Among Single-Parent Households in Riverdale Park
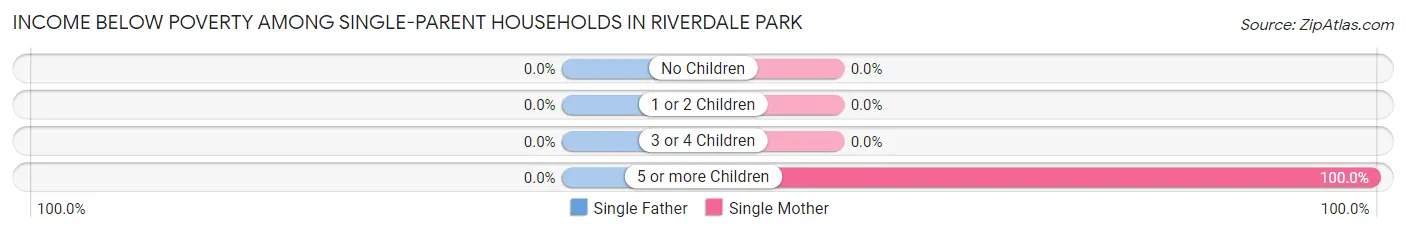
| Children | Single Father | Single Mother |
| No Children | 0 (0.0%) | 0 (0.0%) |
| 1 or 2 Children | 0 (0.0%) | 0 (0.0%) |
| 3 or 4 Children | 0 (0.0%) | 0 (0.0%) |
| 5 or more Children | 0 (0.0%) | 9 (100.0%) |
| Total | 0 (0.0%) | 9 (11.0%) |
Income Below Poverty Among Married-Couple vs Single-Parent Households in Riverdale Park
The poverty data for Riverdale Park shows that 22 of the married-couple family households (48.9%) and 9 of the single-parent households (10.2%) are living below the poverty level. Within the married-couple family households, those with 3 or 4 children have the highest poverty rate, with 22 households (100.0%) falling below the poverty line. Among the single-parent households, those with 5 or more children have the highest poverty rate, with 9 household (100.0%) living below poverty.
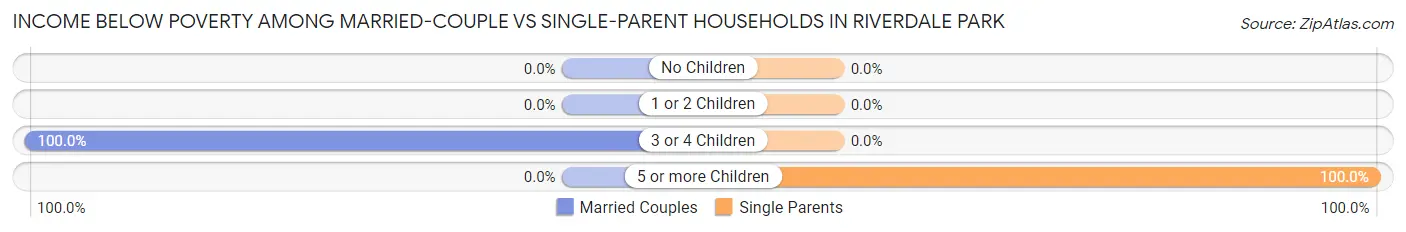
| Children | Married-Couple Families | Single-Parent Households |
| No Children | 0 (0.0%) | 0 (0.0%) |
| 1 or 2 Children | 0 (0.0%) | 0 (0.0%) |
| 3 or 4 Children | 22 (100.0%) | 0 (0.0%) |
| 5 or more Children | 0 (0.0%) | 9 (100.0%) |
| Total | 22 (48.9%) | 9 (10.2%) |
Race in Riverdale Park
The most populous races in Riverdale Park are Hispanic or Latino (735 | 92.4%), Two or more Races (337 | 42.4%), and White / Caucasian (313 | 39.4%).
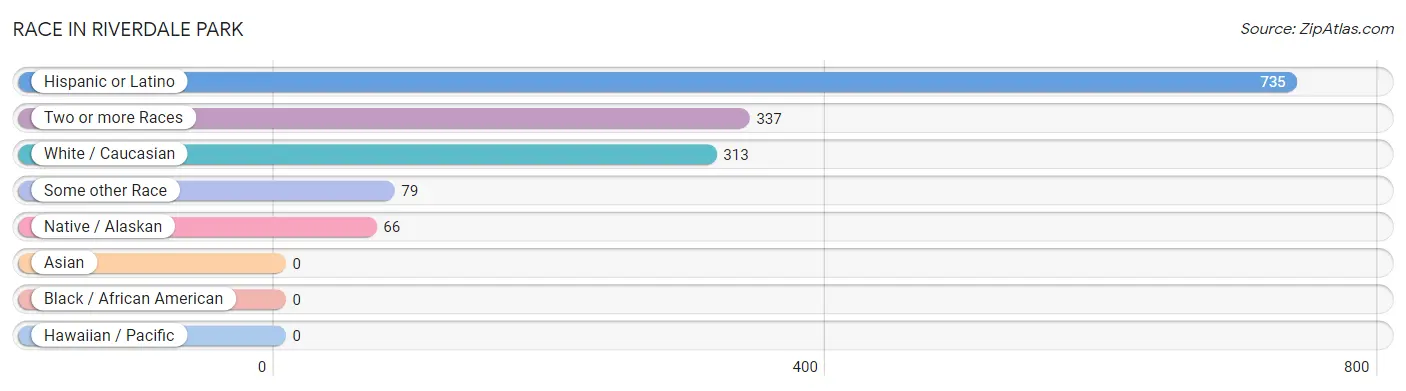
| Race | # Population | % Population |
| Asian | 0 | 0.0% |
| Black / African American | 0 | 0.0% |
| Hawaiian / Pacific | 0 | 0.0% |
| Hispanic or Latino | 735 | 92.4% |
| Native / Alaskan | 66 | 8.3% |
| White / Caucasian | 313 | 39.4% |
| Two or more Races | 337 | 42.4% |
| Some other Race | 79 | 9.9% |
| Total | 795 | 100.0% |
Ancestry in Riverdale Park
The most populous ancestries reported in Riverdale Park are Mexican (735 | 92.4%), Central American Indian (66 | 8.3%), American (21 | 2.6%), European (21 | 2.6%), and Irish (19 | 2.4%), together accounting for 108.4% of all Riverdale Park residents.
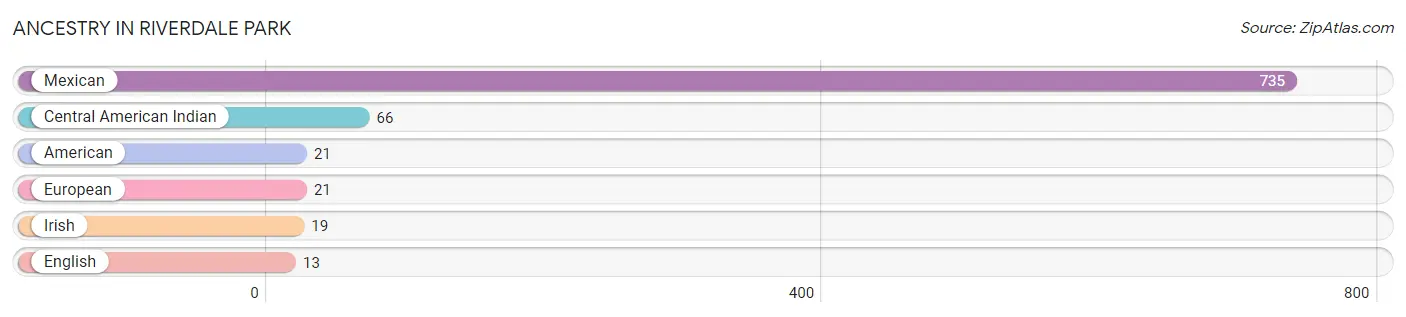
| Ancestry | # Population | % Population |
| American | 21 | 2.6% |
| Central American Indian | 66 | 8.3% |
| English | 13 | 1.6% |
| European | 21 | 2.6% |
| Irish | 19 | 2.4% |
| Mexican | 735 | 92.4% | View All 6 Rows |
Immigrants in Riverdale Park
The most numerous immigrant groups reported in Riverdale Park came from Central America (295 | 37.1%), Latin America (295 | 37.1%), and Mexico (295 | 37.1%), together accounting for 111.3% of all Riverdale Park residents.
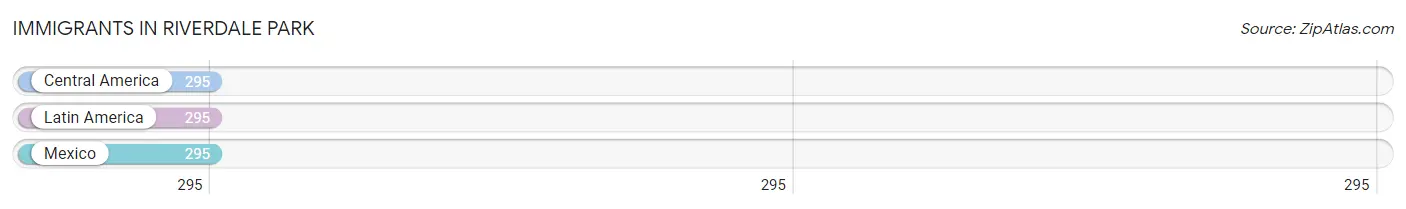
| Immigration Origin | # Population | % Population |
| Central America | 295 | 37.1% |
| Latin America | 295 | 37.1% |
| Mexico | 295 | 37.1% | View All 3 Rows |
Sex and Age in Riverdale Park
Sex and Age in Riverdale Park
The most populous age groups in Riverdale Park are 10 to 14 Years (186 | 35.8%) for men and 35 to 39 Years (79 | 28.6%) for women.
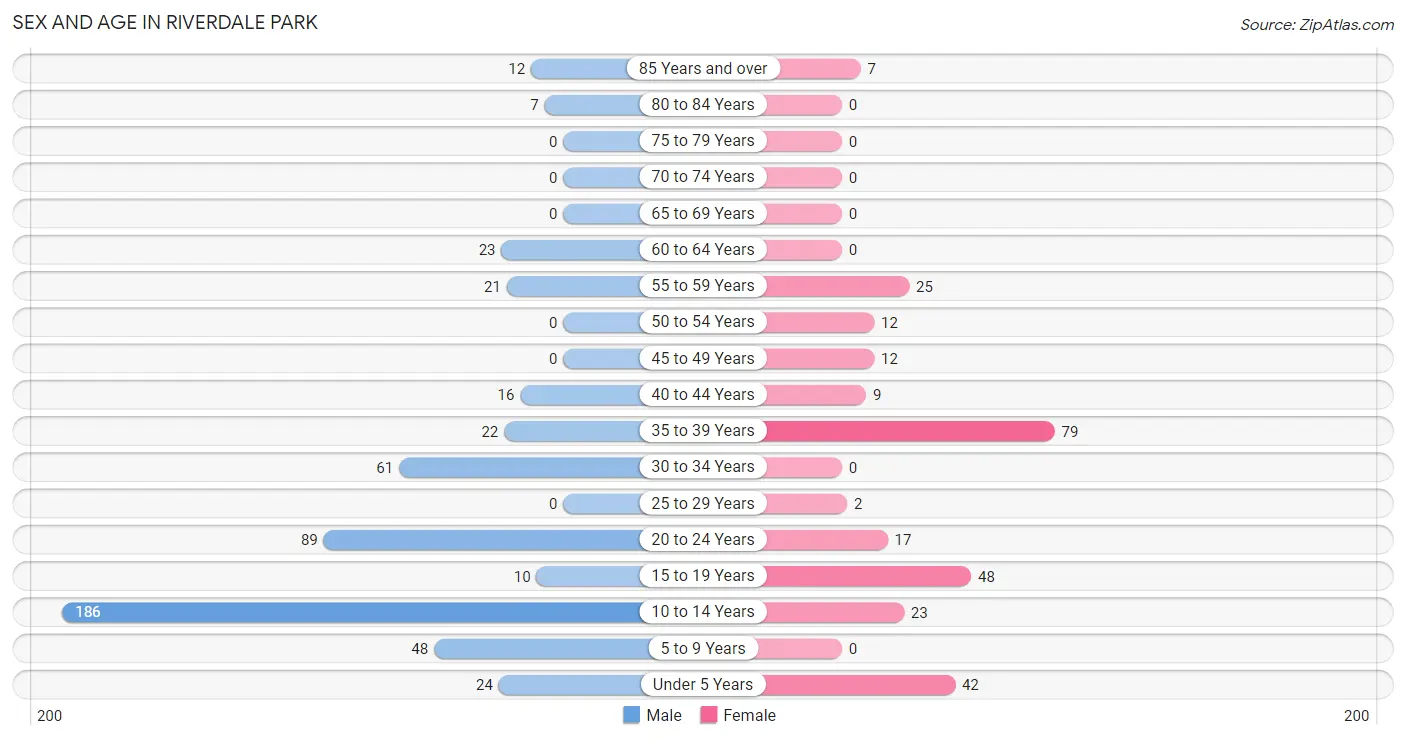
| Age Bracket | Male | Female |
| Under 5 Years | 24 (4.6%) | 42 (15.2%) |
| 5 to 9 Years | 48 (9.2%) | 0 (0.0%) |
| 10 to 14 Years | 186 (35.8%) | 23 (8.3%) |
| 15 to 19 Years | 10 (1.9%) | 48 (17.4%) |
| 20 to 24 Years | 89 (17.2%) | 17 (6.2%) |
| 25 to 29 Years | 0 (0.0%) | 2 (0.7%) |
| 30 to 34 Years | 61 (11.7%) | 0 (0.0%) |
| 35 to 39 Years | 22 (4.2%) | 79 (28.6%) |
| 40 to 44 Years | 16 (3.1%) | 9 (3.3%) |
| 45 to 49 Years | 0 (0.0%) | 12 (4.3%) |
| 50 to 54 Years | 0 (0.0%) | 12 (4.3%) |
| 55 to 59 Years | 21 (4.1%) | 25 (9.1%) |
| 60 to 64 Years | 23 (4.4%) | 0 (0.0%) |
| 65 to 69 Years | 0 (0.0%) | 0 (0.0%) |
| 70 to 74 Years | 0 (0.0%) | 0 (0.0%) |
| 75 to 79 Years | 0 (0.0%) | 0 (0.0%) |
| 80 to 84 Years | 7 (1.3%) | 0 (0.0%) |
| 85 Years and over | 12 (2.3%) | 7 (2.5%) |
| Total | 519 (100.0%) | 276 (100.0%) |
Families and Households in Riverdale Park
Median Family Size in Riverdale Park
The median family size in Riverdale Park is 5.43 persons per family, with single female/mother families (82 | 61.7%) accounting for the largest median family size of 5.76 persons per family. On the other hand, single male/father families (6 | 4.5%) represent the smallest median family size with 3.50 persons per family.
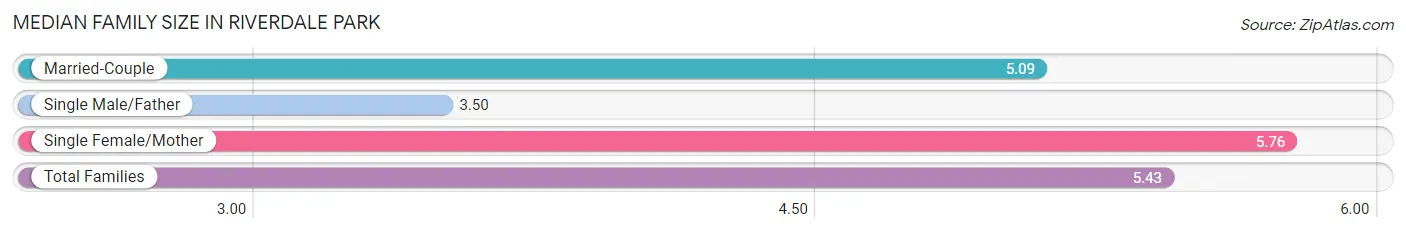
| Family Type | # Families | Family Size |
| Married-Couple | 45 (33.8%) | 5.09 |
| Single Male/Father | 6 (4.5%) | 3.50 |
| Single Female/Mother | 82 (61.7%) | 5.76 |
| Total Families | 133 (100.0%) | 5.43 |
Median Household Size in Riverdale Park
The median household size in Riverdale Park is 4.57 persons per household, with single female/mother households (82 | 47.1%) accounting for the largest median household size of 5.95 persons per household. non-family households (41 | 23.6%) represent the smallest median household size with 1.39 persons per household.
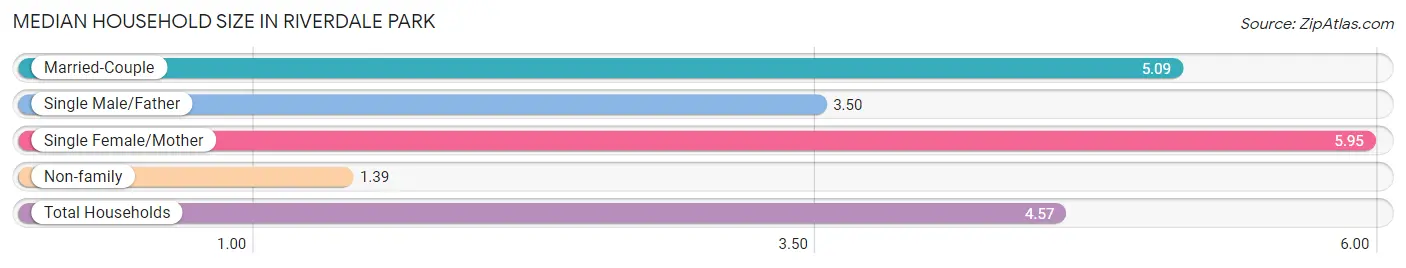
| Household Type | # Households | Household Size |
| Married-Couple | 45 (25.9%) | 5.09 |
| Single Male/Father | 6 (3.5%) | 3.50 |
| Single Female/Mother | 82 (47.1%) | 5.95 |
| Non-family | 41 (23.6%) | 1.39 |
| Total Households | 174 (100.0%) | 4.57 |
Household Size by Marriage Status in Riverdale Park
Out of a total of 174 households in Riverdale Park, 133 (76.4%) are family households, while 41 (23.6%) are nonfamily households. The most numerous type of family households are 5-person households, comprising 71, and the most common type of nonfamily households are 1-person households, comprising 26.
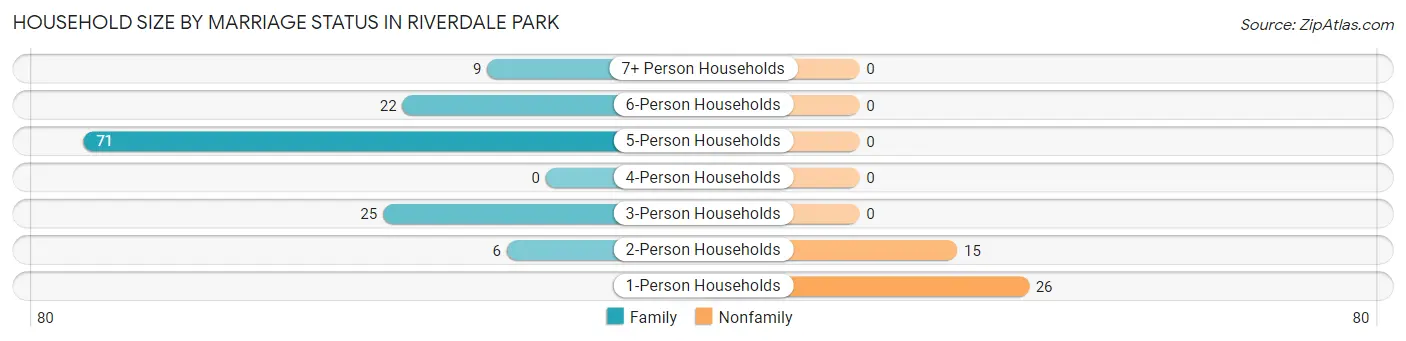
| Household Size | Family Households | Nonfamily Households |
| 1-Person Households | - | 26 (14.9%) |
| 2-Person Households | 6 (3.5%) | 15 (8.6%) |
| 3-Person Households | 25 (14.4%) | 0 (0.0%) |
| 4-Person Households | 0 (0.0%) | 0 (0.0%) |
| 5-Person Households | 71 (40.8%) | 0 (0.0%) |
| 6-Person Households | 22 (12.6%) | 0 (0.0%) |
| 7+ Person Households | 9 (5.2%) | 0 (0.0%) |
| Total | 133 (76.4%) | 41 (23.6%) |
Female Fertility in Riverdale Park
Fertility by Age in Riverdale Park
Average fertility rate in Riverdale Park is 102.0 births per 1,000 women. Women in the age bracket of 20 to 34 years have the highest fertility rate with 895.0 births per 1,000 women. Women in the age bracket of 20 to 34 years acount for 100.0% of all women with births.
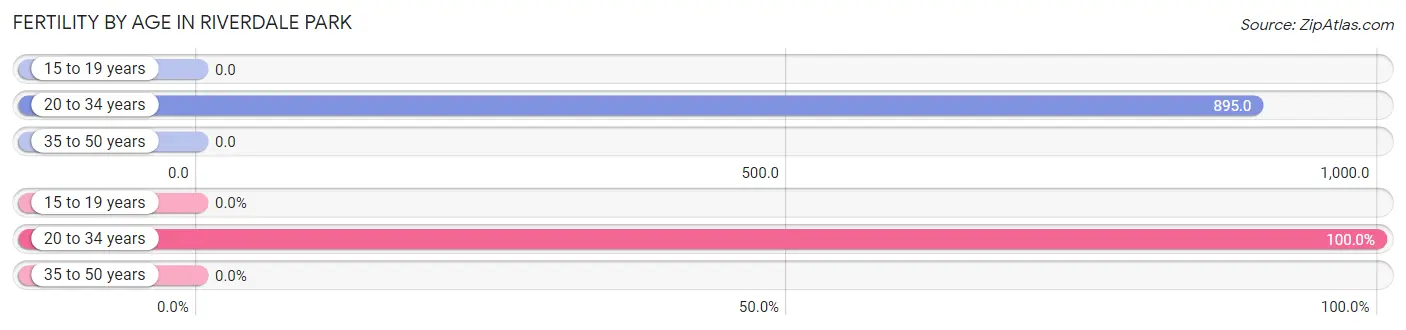
| Age Bracket | Women with Births | Births / 1,000 Women |
| 15 to 19 years | 0 (0.0%) | 0.0 |
| 20 to 34 years | 17 (100.0%) | 895.0 |
| 35 to 50 years | 0 (0.0%) | 0.0 |
| Total | 17 (100.0%) | 102.0 |
Fertility by Age by Marriage Status in Riverdale Park
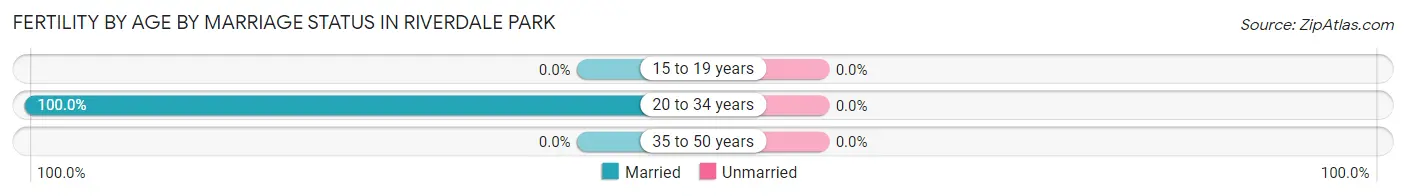
| Age Bracket | Married | Unmarried |
| 15 to 19 years | 0 (0.0%) | 0 (0.0%) |
| 20 to 34 years | 17 (100.0%) | 0 (0.0%) |
| 35 to 50 years | 0 (0.0%) | 0 (0.0%) |
| Total | 17 (100.0%) | 0 (0.0%) |
Fertility by Education in Riverdale Park
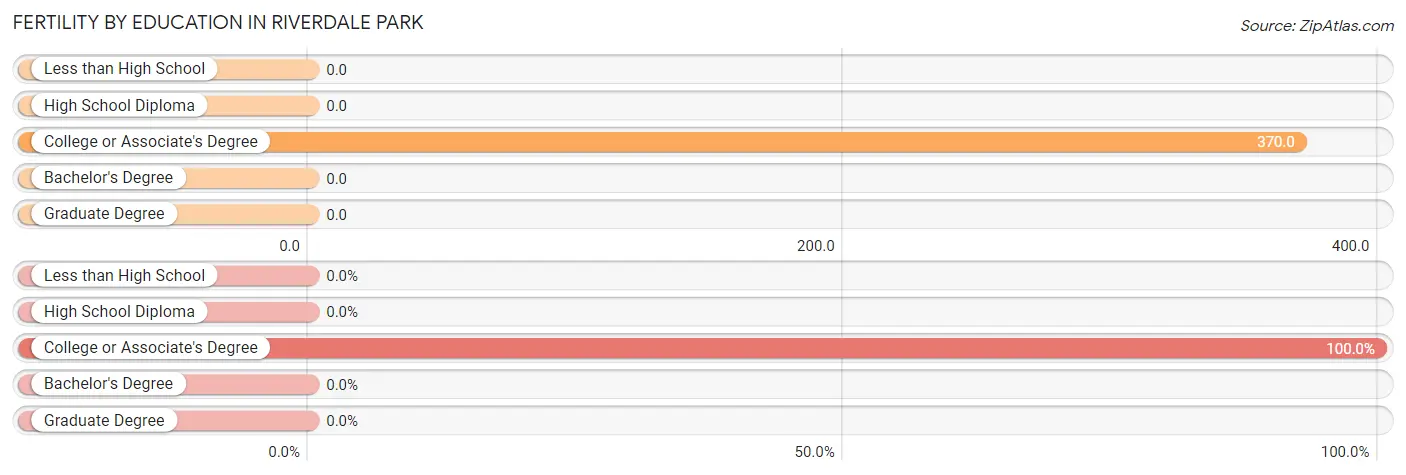
| Educational Attainment | Women with Births | Births / 1,000 Women |
| Less than High School | 0 (0.0%) | 0.0 |
| High School Diploma | 0 (0.0%) | 0.0 |
| College or Associate's Degree | 17 (100.0%) | 370.0 |
| Bachelor's Degree | 0 (0.0%) | 0.0 |
| Graduate Degree | 0 (0.0%) | 0.0 |
| Total | 17 (100.0%) | 102.0 |
Fertility by Education by Marriage Status in Riverdale Park
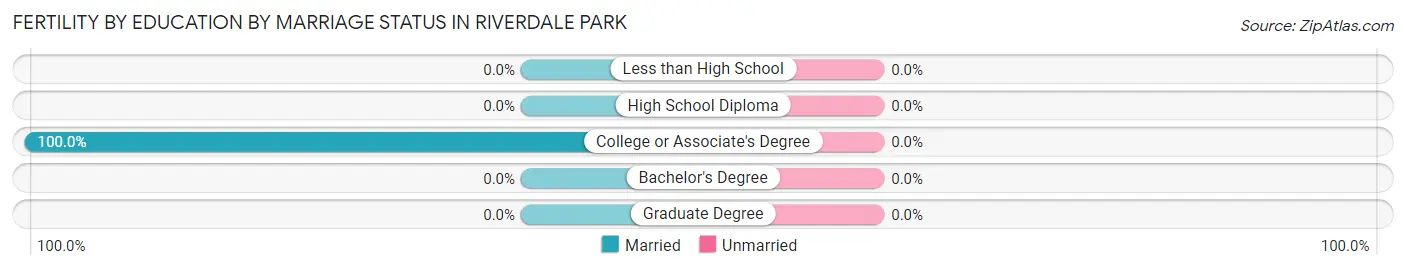
| Educational Attainment | Married | Unmarried |
| Less than High School | 0 (0.0%) | 0 (0.0%) |
| High School Diploma | 0 (0.0%) | 0 (0.0%) |
| College or Associate's Degree | 17 (100.0%) | 0 (0.0%) |
| Bachelor's Degree | 0 (0.0%) | 0 (0.0%) |
| Graduate Degree | 0 (0.0%) | 0 (0.0%) |
| Total | 17 (100.0%) | 0 (0.0%) |
Employment Characteristics in Riverdale Park
Employment by Class of Employer in Riverdale Park
Among the 188 employed individuals in Riverdale Park, private company employees (132 | 70.2%), self-employed (not incorporated) (38 | 20.2%), and not-for-profit organizations (16 | 8.5%) make up the most common classes of employment.
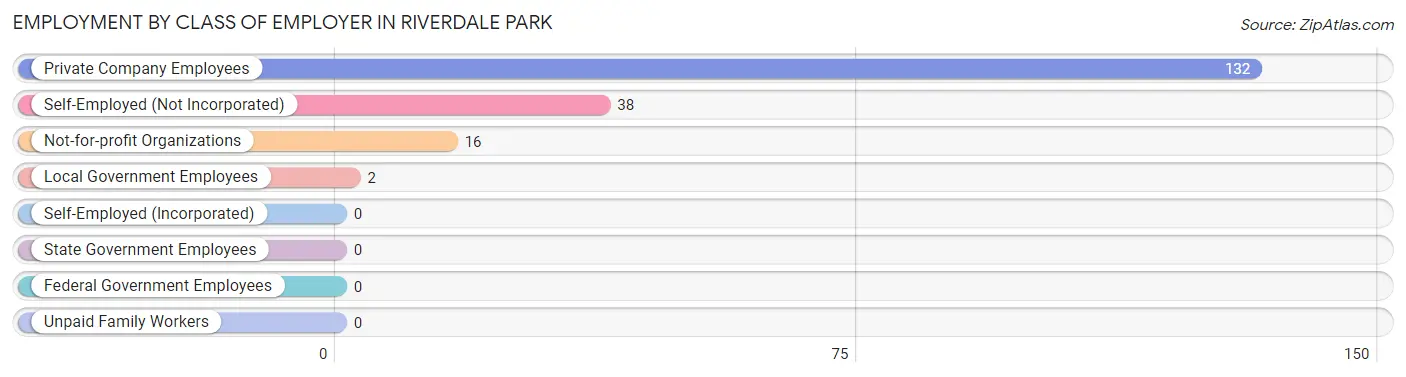
| Employer Class | # Employees | % Employees |
| Private Company Employees | 132 | 70.2% |
| Self-Employed (Incorporated) | 0 | 0.0% |
| Self-Employed (Not Incorporated) | 38 | 20.2% |
| Not-for-profit Organizations | 16 | 8.5% |
| Local Government Employees | 2 | 1.1% |
| State Government Employees | 0 | 0.0% |
| Federal Government Employees | 0 | 0.0% |
| Unpaid Family Workers | 0 | 0.0% |
| Total | 188 | 100.0% |
Employment Status by Age in Riverdale Park
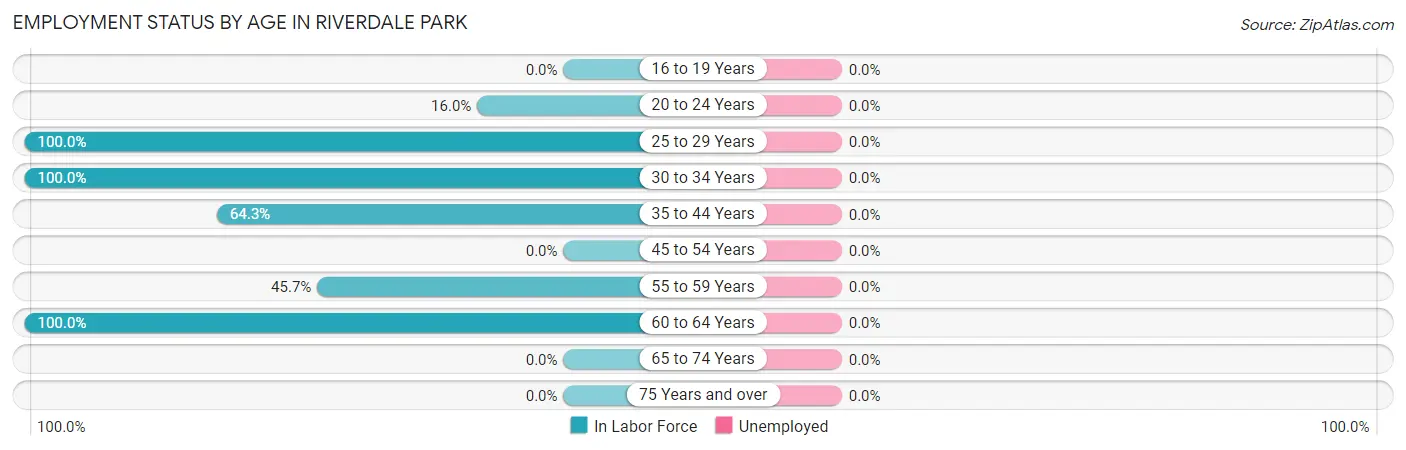
| Age Bracket | In Labor Force | Unemployed |
| 16 to 19 Years | 0 (0.0%) | 0 (0.0%) |
| 20 to 24 Years | 17 (16.0%) | 0 (0.0%) |
| 25 to 29 Years | 2 (100.0%) | 0 (0.0%) |
| 30 to 34 Years | 61 (100.0%) | 0 (0.0%) |
| 35 to 44 Years | 81 (64.3%) | 0 (0.0%) |
| 45 to 54 Years | 0 (0.0%) | 0 (0.0%) |
| 55 to 59 Years | 21 (45.7%) | 0 (0.0%) |
| 60 to 64 Years | 23 (100.0%) | 0 (0.0%) |
| 65 to 74 Years | 0 (0.0%) | 0 (0.0%) |
| 75 Years and over | 0 (0.0%) | 0 (0.0%) |
| Total | 205 (44.4%) | 0 (0.0%) |
Employment Status by Educational Attainment in Riverdale Park
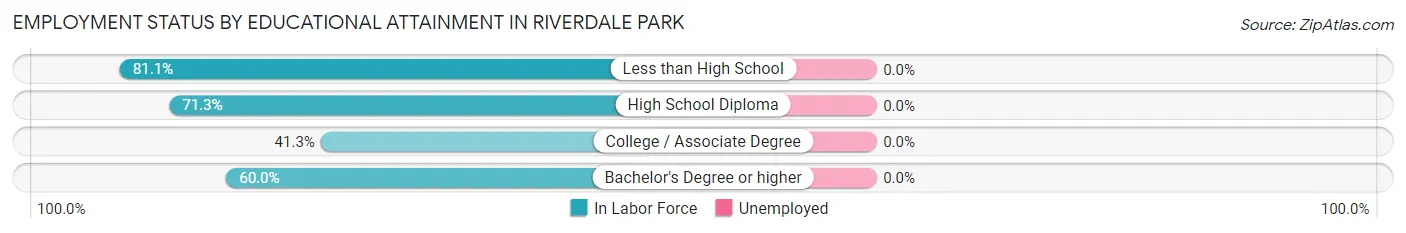
| Educational Attainment | In Labor Force | Unemployed |
| Less than High School | 77 (81.1%) | 0 (0.0%) |
| High School Diploma | 67 (71.3%) | 0 (0.0%) |
| College / Associate Degree | 26 (41.3%) | 0 (0.0%) |
| Bachelor's Degree or higher | 18 (60.0%) | 0 (0.0%) |
| Total | 188 (66.7%) | 0 (0.0%) |
Employment Occupations by Sex in Riverdale Park
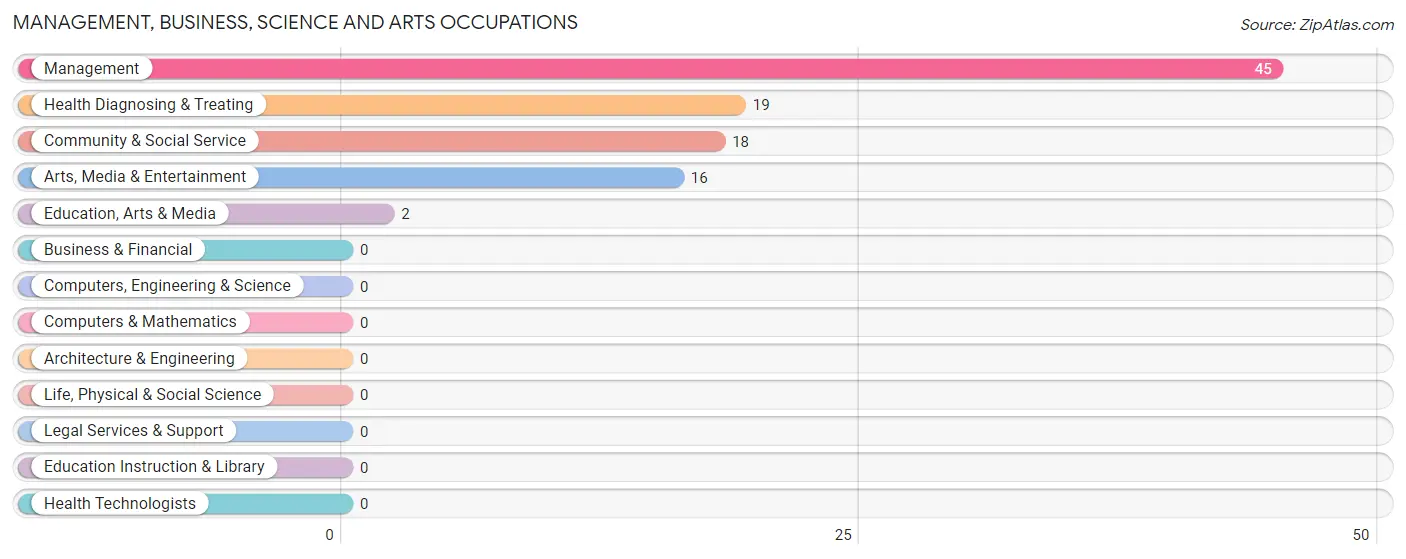
Management, Business, Science and Arts Occupations
The most common Management, Business, Science and Arts occupations in Riverdale Park are Management (45 | 22.0%), Health Diagnosing & Treating (19 | 9.3%), Community & Social Service (18 | 8.8%), Arts, Media & Entertainment (16 | 7.8%), and Education, Arts & Media (2 | 1.0%).
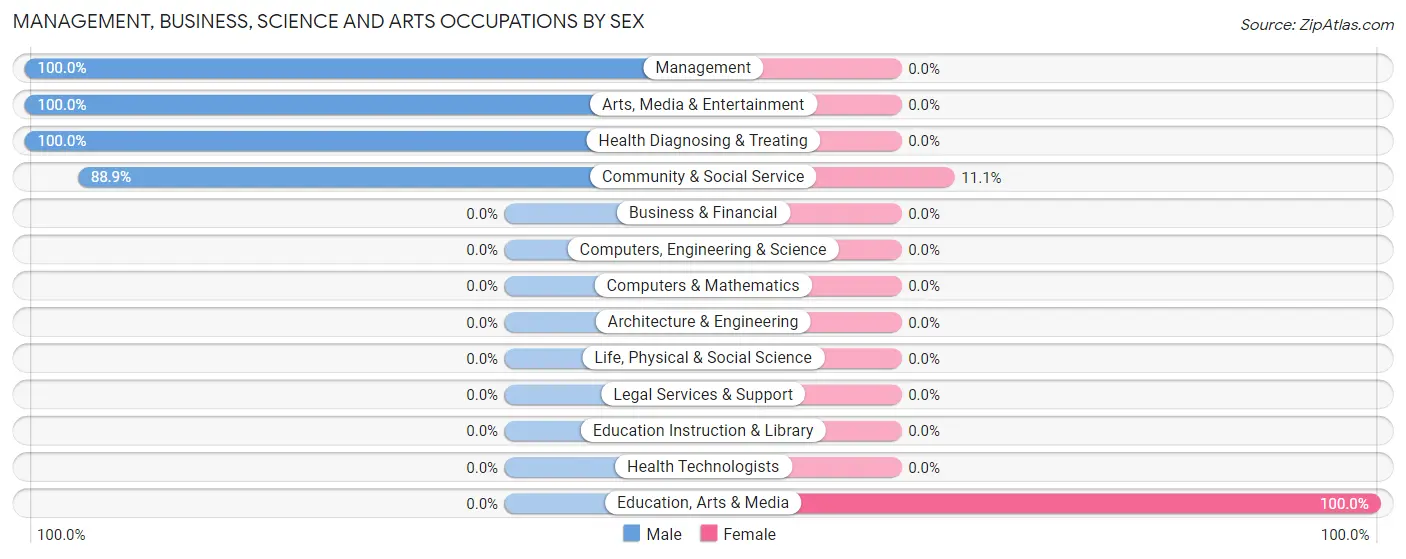
Management, Business, Science and Arts Occupations by Sex
Within the Management, Business, Science and Arts occupations in Riverdale Park, the most male-oriented occupations are Management (100.0%), Arts, Media & Entertainment (100.0%), and Health Diagnosing & Treating (100.0%), while the most female-oriented occupations are Education, Arts & Media (100.0%), and Community & Social Service (11.1%).
| Occupation | Male | Female |
| Management | 45 (100.0%) | 0 (0.0%) |
| Business & Financial | 0 (0.0%) | 0 (0.0%) |
| Computers, Engineering & Science | 0 (0.0%) | 0 (0.0%) |
| Computers & Mathematics | 0 (0.0%) | 0 (0.0%) |
| Architecture & Engineering | 0 (0.0%) | 0 (0.0%) |
| Life, Physical & Social Science | 0 (0.0%) | 0 (0.0%) |
| Community & Social Service | 16 (88.9%) | 2 (11.1%) |
| Education, Arts & Media | 0 (0.0%) | 2 (100.0%) |
| Legal Services & Support | 0 (0.0%) | 0 (0.0%) |
| Education Instruction & Library | 0 (0.0%) | 0 (0.0%) |
| Arts, Media & Entertainment | 16 (100.0%) | 0 (0.0%) |
| Health Diagnosing & Treating | 19 (100.0%) | 0 (0.0%) |
| Health Technologists | 0 (0.0%) | 0 (0.0%) |
| Total (Category) | 80 (97.6%) | 2 (2.4%) |
| Total (Overall) | 127 (62.0%) | 78 (38.1%) |
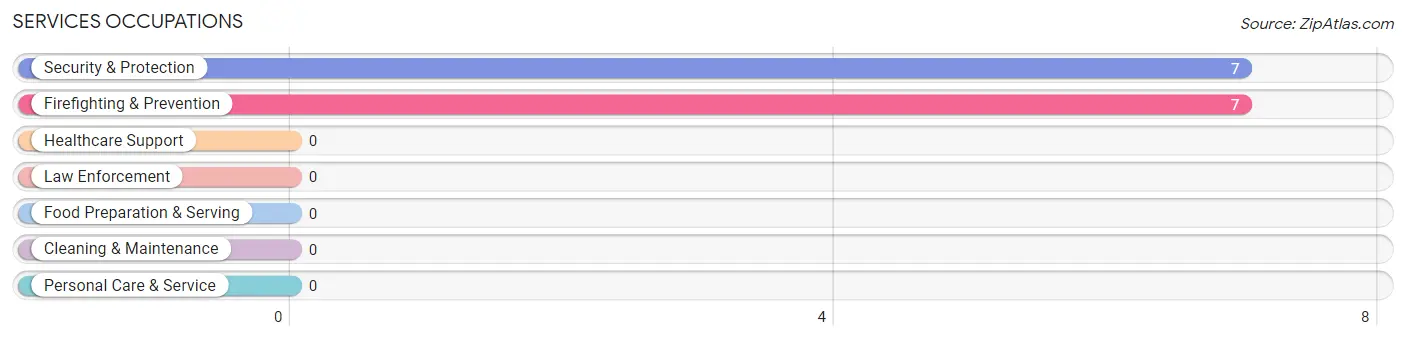
Services Occupations
The most common Services occupations in Riverdale Park are Security & Protection (7 | 3.4%), and Firefighting & Prevention (7 | 3.4%).
Services Occupations by Sex
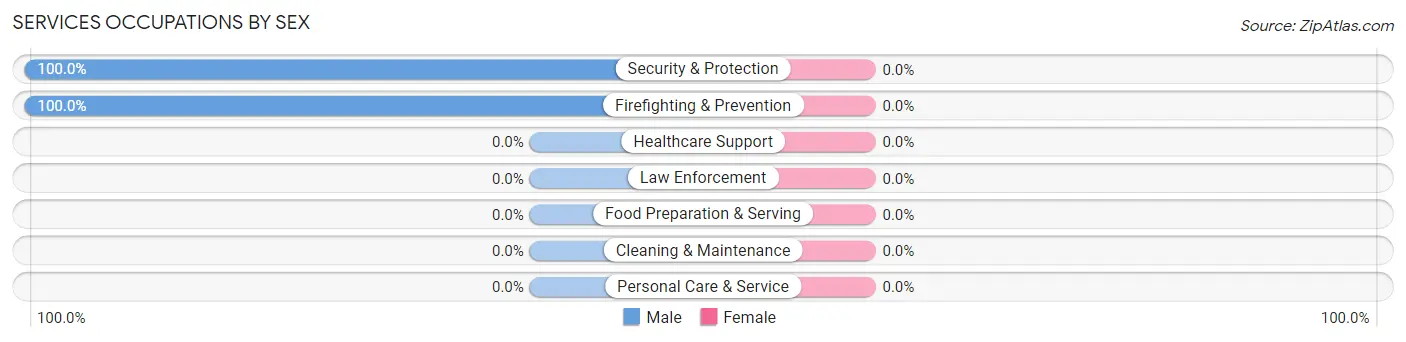
| Occupation | Male | Female |
| Healthcare Support | 0 (0.0%) | 0 (0.0%) |
| Security & Protection | 7 (100.0%) | 0 (0.0%) |
| Firefighting & Prevention | 7 (100.0%) | 0 (0.0%) |
| Law Enforcement | 0 (0.0%) | 0 (0.0%) |
| Food Preparation & Serving | 0 (0.0%) | 0 (0.0%) |
| Cleaning & Maintenance | 0 (0.0%) | 0 (0.0%) |
| Personal Care & Service | 0 (0.0%) | 0 (0.0%) |
| Total (Category) | 7 (100.0%) | 0 (0.0%) |
| Total (Overall) | 127 (62.0%) | 78 (38.1%) |
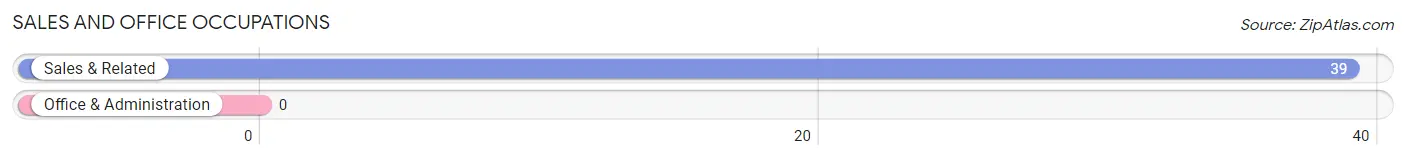
Sales and Office Occupations
The most common Sales and Office occupations in Riverdale Park are , and Sales & Related (39 | 19.0%).
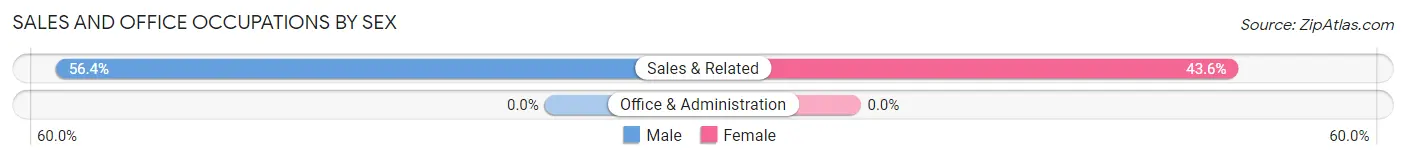
Sales and Office Occupations by Sex
| Occupation | Male | Female |
| Sales & Related | 22 (56.4%) | 17 (43.6%) |
| Office & Administration | 0 (0.0%) | 0 (0.0%) |
| Total (Category) | 22 (56.4%) | 17 (43.6%) |
| Total (Overall) | 127 (62.0%) | 78 (38.1%) |
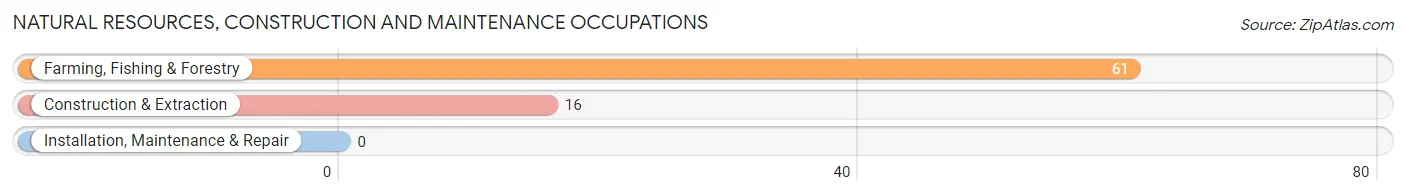
Natural Resources, Construction and Maintenance Occupations
The most common Natural Resources, Construction and Maintenance occupations in Riverdale Park are Farming, Fishing & Forestry (61 | 29.8%), and Construction & Extraction (16 | 7.8%).
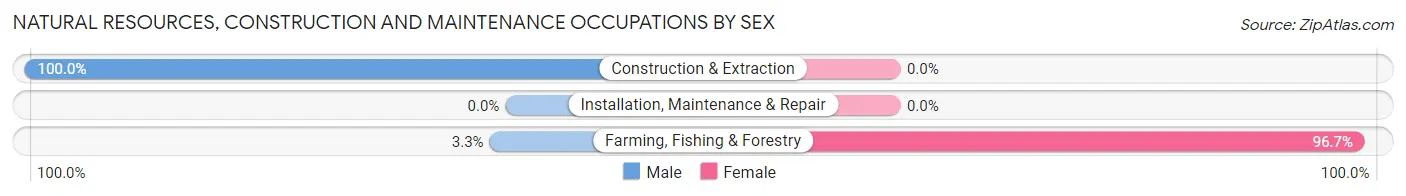
Natural Resources, Construction and Maintenance Occupations by Sex
| Occupation | Male | Female |
| Farming, Fishing & Forestry | 2 (3.3%) | 59 (96.7%) |
| Construction & Extraction | 16 (100.0%) | 0 (0.0%) |
| Installation, Maintenance & Repair | 0 (0.0%) | 0 (0.0%) |
| Total (Category) | 18 (23.4%) | 59 (76.6%) |
| Total (Overall) | 127 (62.0%) | 78 (38.1%) |
Production, Transportation and Moving Occupations
Production, Transportation and Moving Occupations by Sex
| Occupation | Male | Female |
| Production | 0 (0.0%) | 0 (0.0%) |
| Transportation | 0 (0.0%) | 0 (0.0%) |
| Material Moving | 0 (0.0%) | 0 (0.0%) |
| Total (Category) | 0 (0.0%) | 0 (0.0%) |
| Total (Overall) | 127 (62.0%) | 78 (38.1%) |
Employment Industries by Sex in Riverdale Park
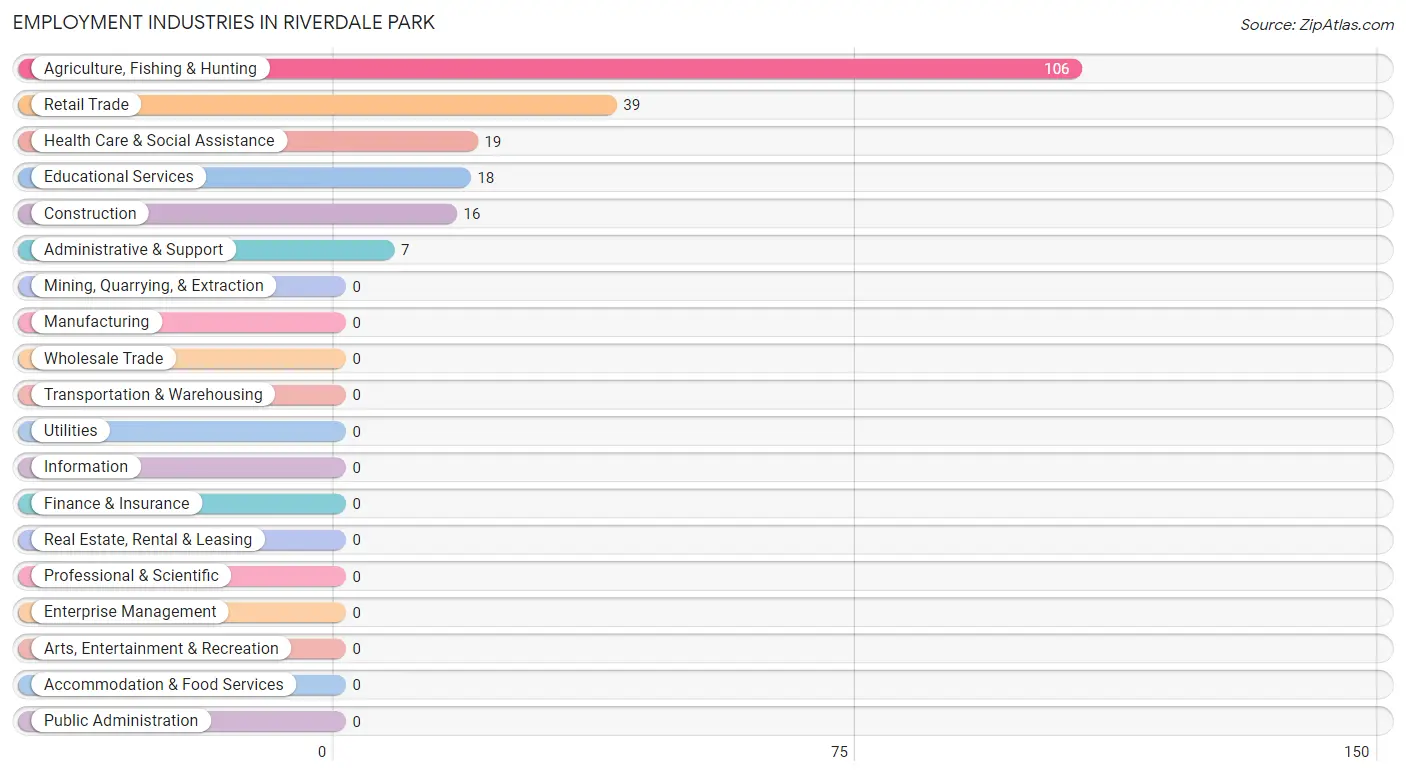
Employment Industries in Riverdale Park
The major employment industries in Riverdale Park include Agriculture, Fishing & Hunting (106 | 51.7%), Retail Trade (39 | 19.0%), Health Care & Social Assistance (19 | 9.3%), Educational Services (18 | 8.8%), and Construction (16 | 7.8%).
Employment Industries by Sex in Riverdale Park
The Riverdale Park industries that see more men than women are Construction (100.0%), Administrative & Support (100.0%), and Health Care & Social Assistance (100.0%), whereas the industries that tend to have a higher number of women are Agriculture, Fishing & Hunting (55.7%), Retail Trade (43.6%), and Educational Services (11.1%).
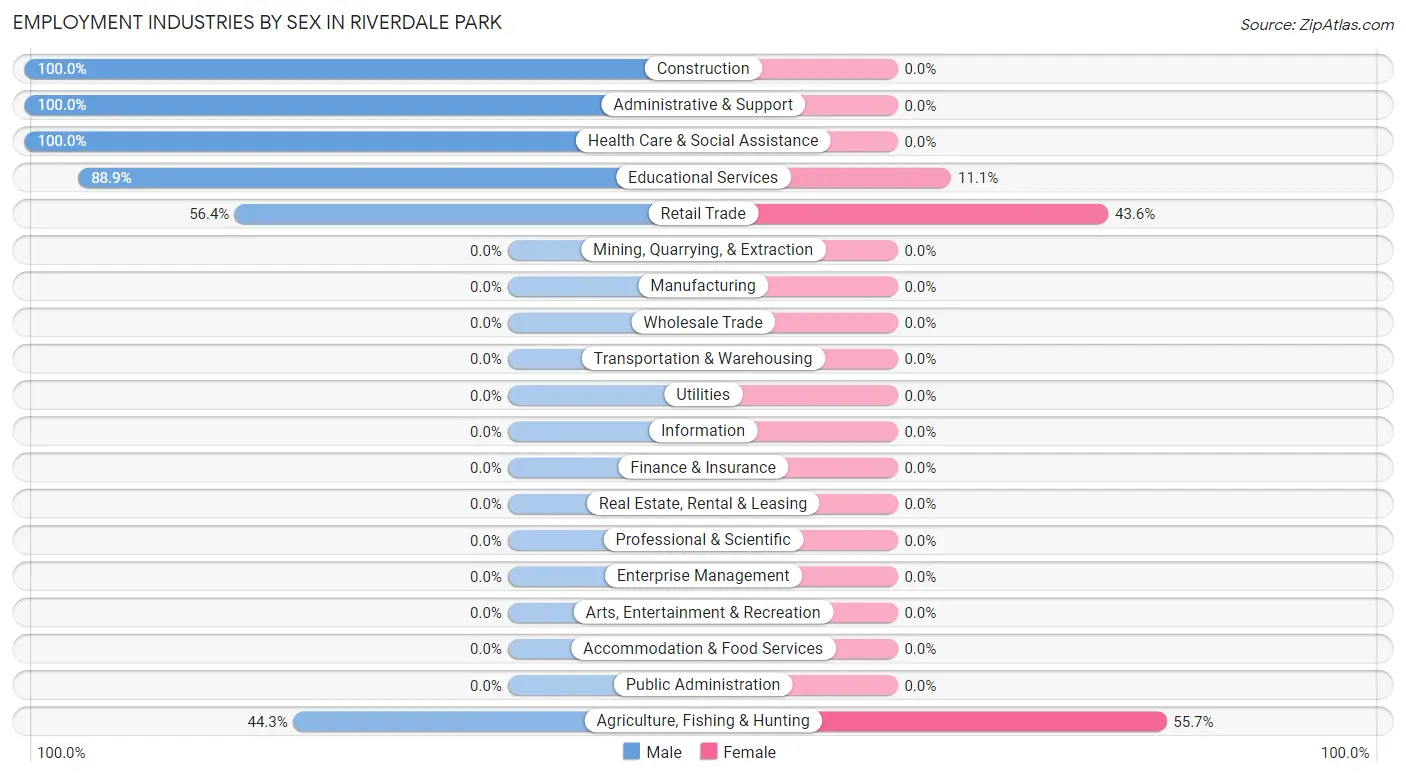
| Industry | Male | Female |
| Agriculture, Fishing & Hunting | 47 (44.3%) | 59 (55.7%) |
| Mining, Quarrying, & Extraction | 0 (0.0%) | 0 (0.0%) |
| Construction | 16 (100.0%) | 0 (0.0%) |
| Manufacturing | 0 (0.0%) | 0 (0.0%) |
| Wholesale Trade | 0 (0.0%) | 0 (0.0%) |
| Retail Trade | 22 (56.4%) | 17 (43.6%) |
| Transportation & Warehousing | 0 (0.0%) | 0 (0.0%) |
| Utilities | 0 (0.0%) | 0 (0.0%) |
| Information | 0 (0.0%) | 0 (0.0%) |
| Finance & Insurance | 0 (0.0%) | 0 (0.0%) |
| Real Estate, Rental & Leasing | 0 (0.0%) | 0 (0.0%) |
| Professional & Scientific | 0 (0.0%) | 0 (0.0%) |
| Enterprise Management | 0 (0.0%) | 0 (0.0%) |
| Administrative & Support | 7 (100.0%) | 0 (0.0%) |
| Educational Services | 16 (88.9%) | 2 (11.1%) |
| Health Care & Social Assistance | 19 (100.0%) | 0 (0.0%) |
| Arts, Entertainment & Recreation | 0 (0.0%) | 0 (0.0%) |
| Accommodation & Food Services | 0 (0.0%) | 0 (0.0%) |
| Public Administration | 0 (0.0%) | 0 (0.0%) |
| Total | 127 (62.0%) | 78 (38.1%) |
Education in Riverdale Park
School Enrollment in Riverdale Park
The most common levels of schooling among the 322 students in Riverdale Park are middle school (219 | 68.0%), elementary school (48 | 14.9%), and high school (48 | 14.9%).
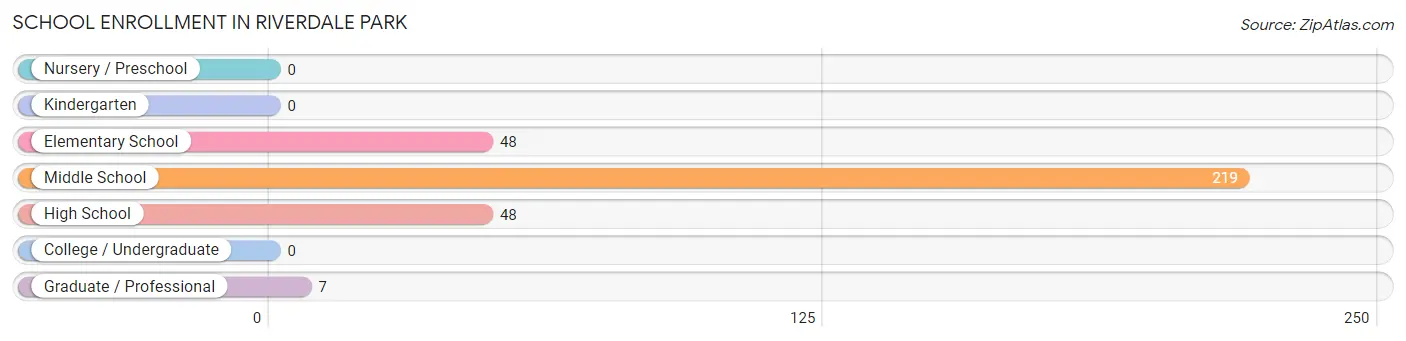
| School Level | # Students | % Students |
| Nursery / Preschool | 0 | 0.0% |
| Kindergarten | 0 | 0.0% |
| Elementary School | 48 | 14.9% |
| Middle School | 219 | 68.0% |
| High School | 48 | 14.9% |
| College / Undergraduate | 0 | 0.0% |
| Graduate / Professional | 7 | 2.2% |
| Total | 322 | 100.0% |
School Enrollment by Age by Funding Source in Riverdale Park
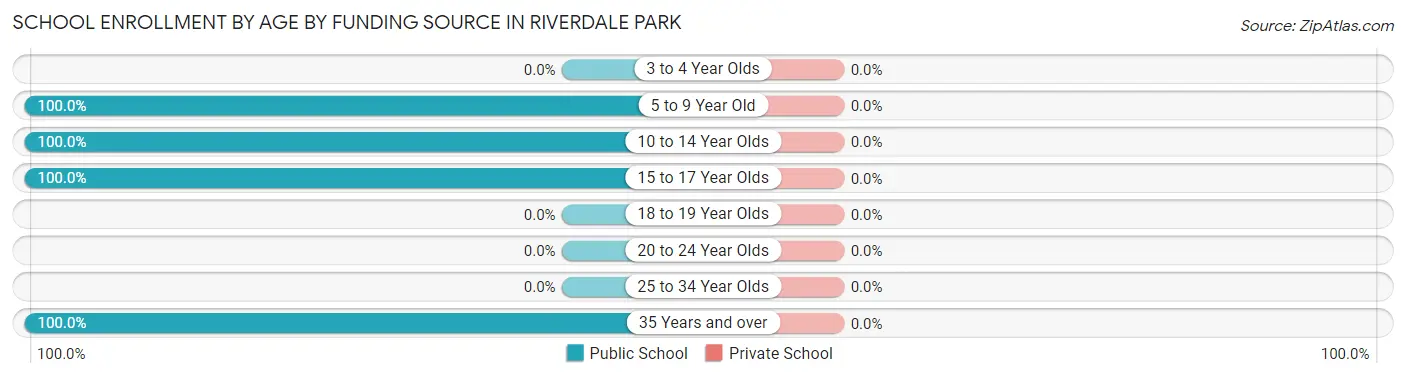
| Age Bracket | Public School | Private School |
| 3 to 4 Year Olds | 0 (0.0%) | 0 (0.0%) |
| 5 to 9 Year Old | 48 (100.0%) | 0 (0.0%) |
| 10 to 14 Year Olds | 209 (100.0%) | 0 (0.0%) |
| 15 to 17 Year Olds | 58 (100.0%) | 0 (0.0%) |
| 18 to 19 Year Olds | 0 (0.0%) | 0 (0.0%) |
| 20 to 24 Year Olds | 0 (0.0%) | 0 (0.0%) |
| 25 to 34 Year Olds | 0 (0.0%) | 0 (0.0%) |
| 35 Years and over | 7 (100.0%) | 0 (0.0%) |
| Total | 322 (100.0%) | 0 (0.0%) |
Educational Attainment by Field of Study in Riverdale Park
Bio, nature & agricultural (16 | 30.2%), science & technology (16 | 30.2%), arts & humanities (14 | 26.4%), and liberal arts & history (7 | 13.2%) are the most common fields of study among 53 individuals in Riverdale Park who have obtained a bachelor's degree or higher.
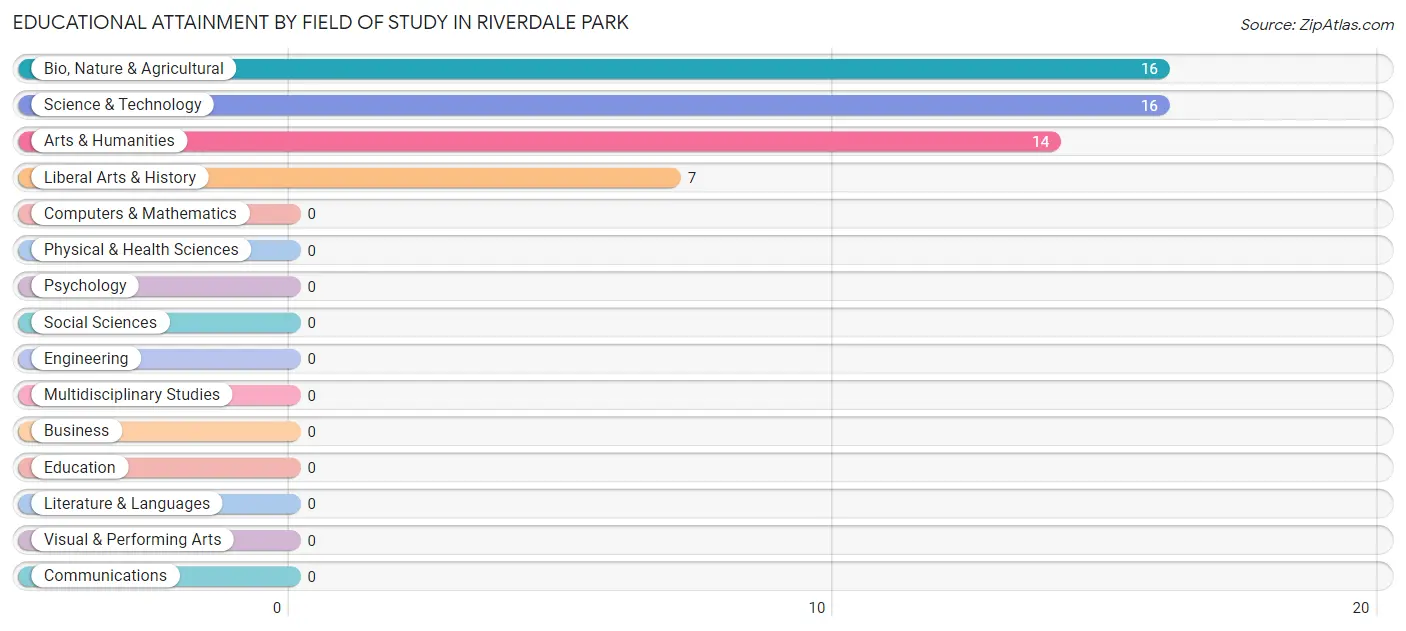
| Field of Study | # Graduates | % Graduates |
| Computers & Mathematics | 0 | 0.0% |
| Bio, Nature & Agricultural | 16 | 30.2% |
| Physical & Health Sciences | 0 | 0.0% |
| Psychology | 0 | 0.0% |
| Social Sciences | 0 | 0.0% |
| Engineering | 0 | 0.0% |
| Multidisciplinary Studies | 0 | 0.0% |
| Science & Technology | 16 | 30.2% |
| Business | 0 | 0.0% |
| Education | 0 | 0.0% |
| Literature & Languages | 0 | 0.0% |
| Liberal Arts & History | 7 | 13.2% |
| Visual & Performing Arts | 0 | 0.0% |
| Communications | 0 | 0.0% |
| Arts & Humanities | 14 | 26.4% |
| Total | 53 | 100.0% |
Transportation & Commute in Riverdale Park
Vehicle Availability by Sex in Riverdale Park
The most prevalent vehicle ownership categories in Riverdale Park are males with 1 vehicle (45, accounting for 35.4%) and females with 1 vehicle (0, making up 73.8%).
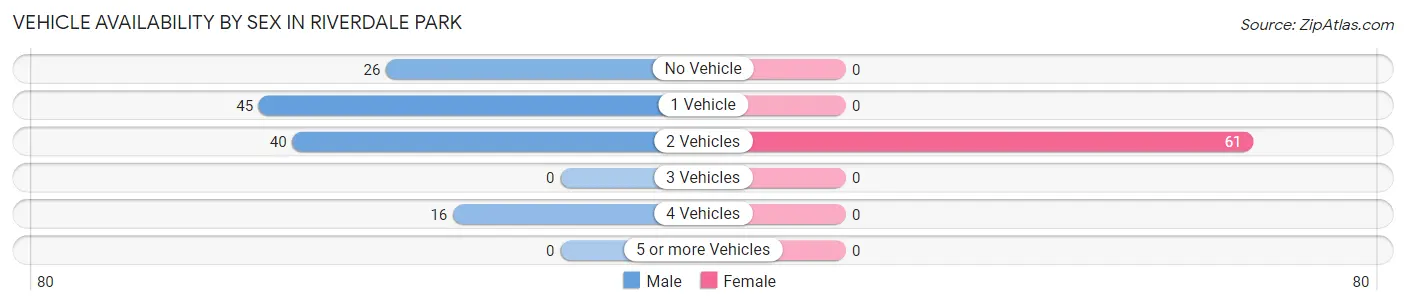
| Vehicles Available | Male | Female |
| No Vehicle | 26 (20.5%) | 0 (0.0%) |
| 1 Vehicle | 45 (35.4%) | 0 (0.0%) |
| 2 Vehicles | 40 (31.5%) | 61 (100.0%) |
| 3 Vehicles | 0 (0.0%) | 0 (0.0%) |
| 4 Vehicles | 16 (12.6%) | 0 (0.0%) |
| 5 or more Vehicles | 0 (0.0%) | 0 (0.0%) |
| Total | 127 (100.0%) | 61 (100.0%) |
Commute Time in Riverdale Park
The most frequently occuring commute durations in Riverdale Park are 30 to 34 minutes (111 commuters, 67.7%), 25 to 29 minutes (35 commuters, 21.3%), and 45 to 59 minutes (18 commuters, 11.0%).
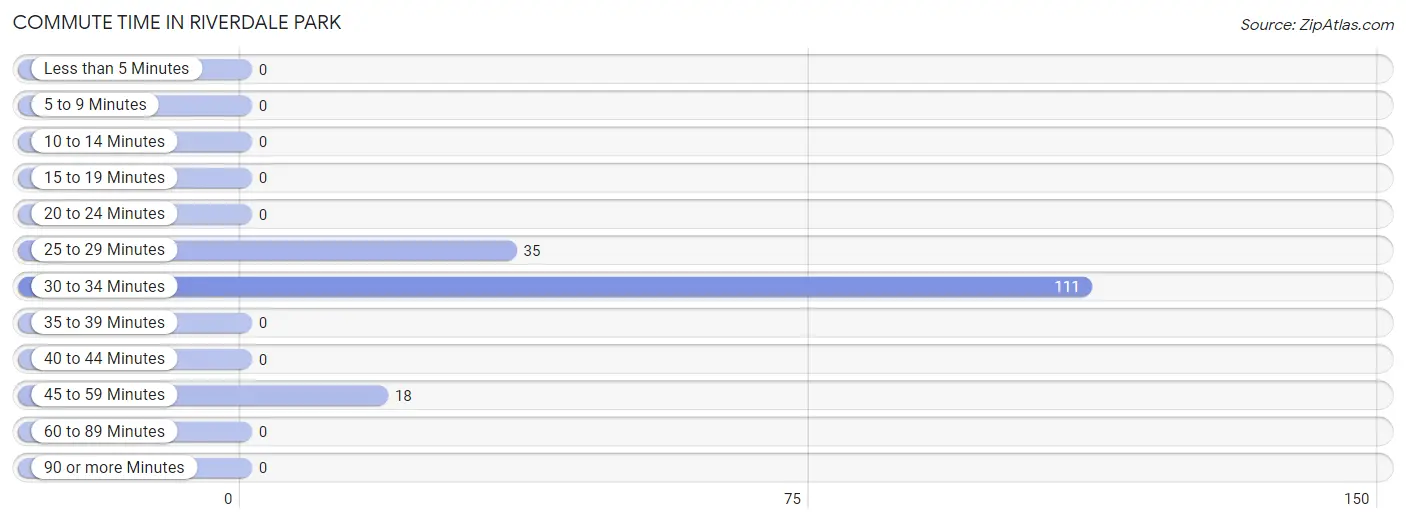
| Commute Time | # Commuters | % Commuters |
| Less than 5 Minutes | 0 | 0.0% |
| 5 to 9 Minutes | 0 | 0.0% |
| 10 to 14 Minutes | 0 | 0.0% |
| 15 to 19 Minutes | 0 | 0.0% |
| 20 to 24 Minutes | 0 | 0.0% |
| 25 to 29 Minutes | 35 | 21.3% |
| 30 to 34 Minutes | 111 | 67.7% |
| 35 to 39 Minutes | 0 | 0.0% |
| 40 to 44 Minutes | 0 | 0.0% |
| 45 to 59 Minutes | 18 | 11.0% |
| 60 to 89 Minutes | 0 | 0.0% |
| 90 or more Minutes | 0 | 0.0% |
Commute Time by Sex in Riverdale Park
The most common commute times in Riverdale Park are 30 to 34 minutes (52 commuters, 49.5%) for males and 30 to 34 minutes (59 commuters, 100.0%) for females.
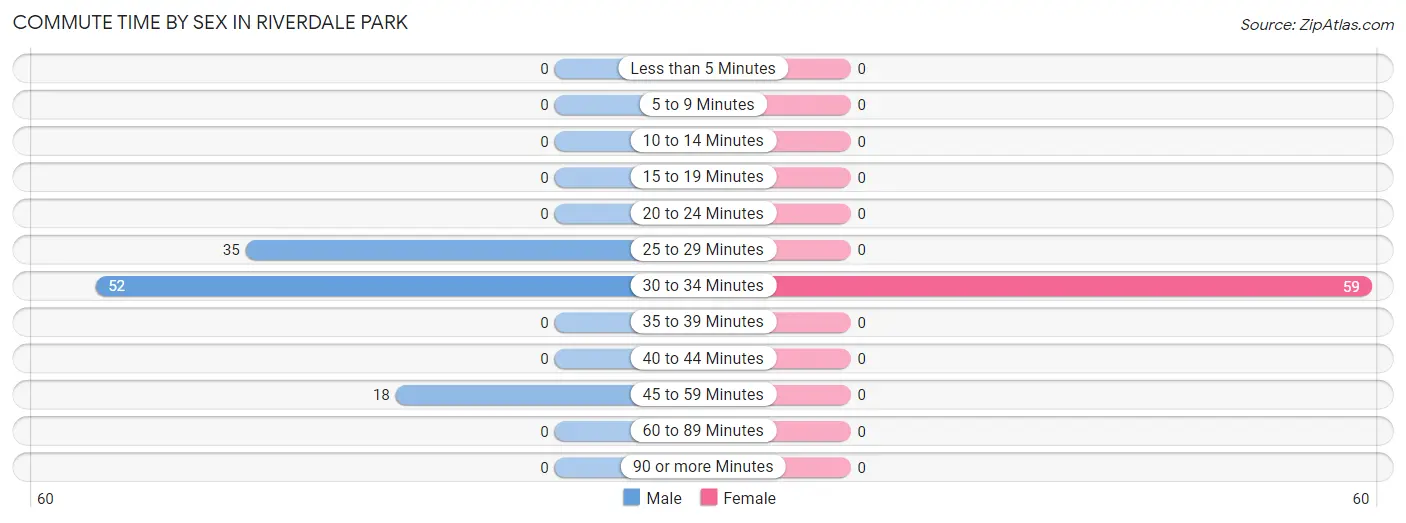
| Commute Time | Male | Female |
| Less than 5 Minutes | 0 (0.0%) | 0 (0.0%) |
| 5 to 9 Minutes | 0 (0.0%) | 0 (0.0%) |
| 10 to 14 Minutes | 0 (0.0%) | 0 (0.0%) |
| 15 to 19 Minutes | 0 (0.0%) | 0 (0.0%) |
| 20 to 24 Minutes | 0 (0.0%) | 0 (0.0%) |
| 25 to 29 Minutes | 35 (33.3%) | 0 (0.0%) |
| 30 to 34 Minutes | 52 (49.5%) | 59 (100.0%) |
| 35 to 39 Minutes | 0 (0.0%) | 0 (0.0%) |
| 40 to 44 Minutes | 0 (0.0%) | 0 (0.0%) |
| 45 to 59 Minutes | 18 (17.1%) | 0 (0.0%) |
| 60 to 89 Minutes | 0 (0.0%) | 0 (0.0%) |
| 90 or more Minutes | 0 (0.0%) | 0 (0.0%) |
Time of Departure to Work by Sex in Riverdale Park
The most frequent times of departure to work in Riverdale Park are 7:00 AM to 7:29 AM (63, 60.0%) for males and 5:00 AM to 5:29 AM (59, 100.0%) for females.
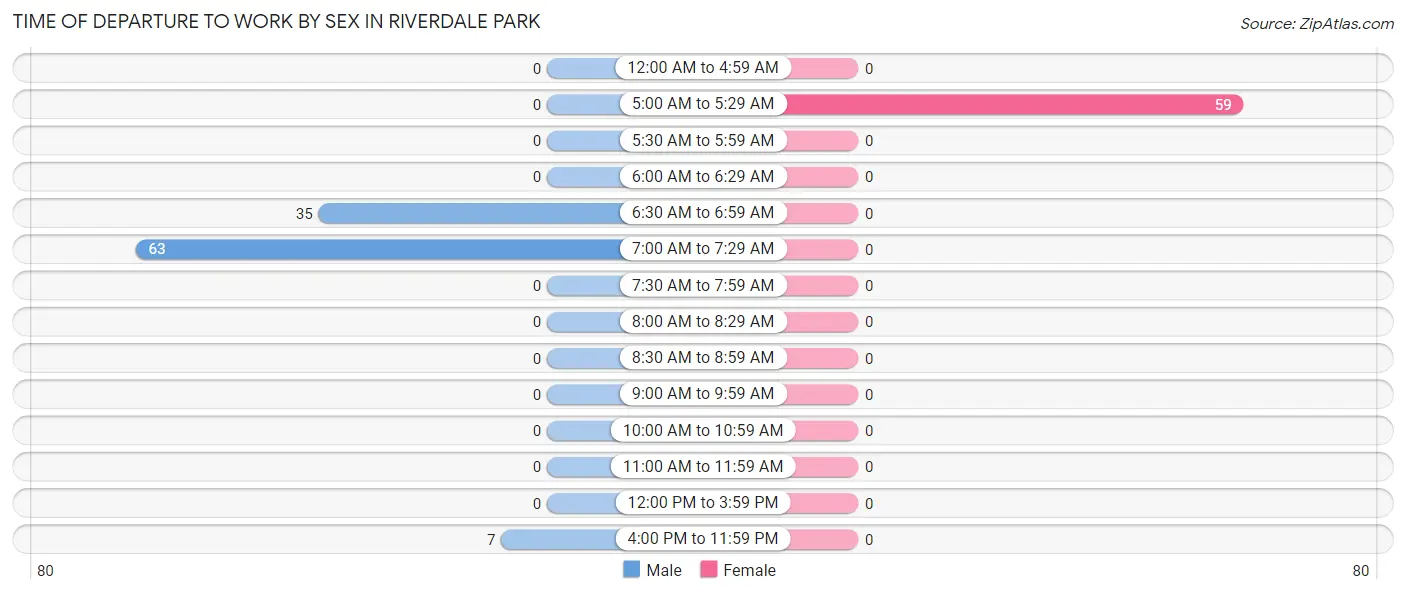
| Time of Departure | Male | Female |
| 12:00 AM to 4:59 AM | 0 (0.0%) | 0 (0.0%) |
| 5:00 AM to 5:29 AM | 0 (0.0%) | 59 (100.0%) |
| 5:30 AM to 5:59 AM | 0 (0.0%) | 0 (0.0%) |
| 6:00 AM to 6:29 AM | 0 (0.0%) | 0 (0.0%) |
| 6:30 AM to 6:59 AM | 35 (33.3%) | 0 (0.0%) |
| 7:00 AM to 7:29 AM | 63 (60.0%) | 0 (0.0%) |
| 7:30 AM to 7:59 AM | 0 (0.0%) | 0 (0.0%) |
| 8:00 AM to 8:29 AM | 0 (0.0%) | 0 (0.0%) |
| 8:30 AM to 8:59 AM | 0 (0.0%) | 0 (0.0%) |
| 9:00 AM to 9:59 AM | 0 (0.0%) | 0 (0.0%) |
| 10:00 AM to 10:59 AM | 0 (0.0%) | 0 (0.0%) |
| 11:00 AM to 11:59 AM | 0 (0.0%) | 0 (0.0%) |
| 12:00 PM to 3:59 PM | 0 (0.0%) | 0 (0.0%) |
| 4:00 PM to 11:59 PM | 7 (6.7%) | 0 (0.0%) |
| Total | 105 (100.0%) | 59 (100.0%) |
Housing Occupancy in Riverdale Park
Occupancy by Ownership in Riverdale Park
Of the total 174 dwellings in Riverdale Park, owner-occupied units account for 37 (21.3%), while renter-occupied units make up 137 (78.7%).
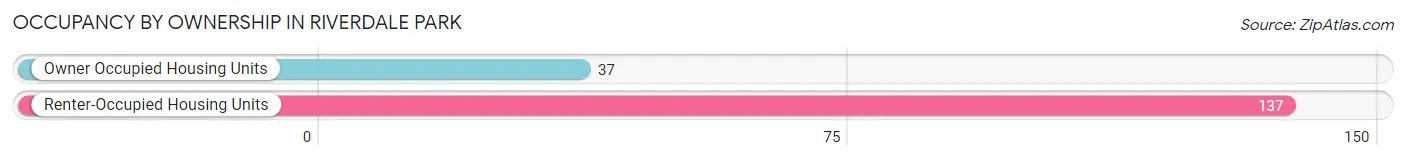
| Occupancy | # Housing Units | % Housing Units |
| Owner Occupied Housing Units | 37 | 21.3% |
| Renter-Occupied Housing Units | 137 | 78.7% |
| Total Occupied Housing Units | 174 | 100.0% |
Occupancy by Household Size in Riverdale Park
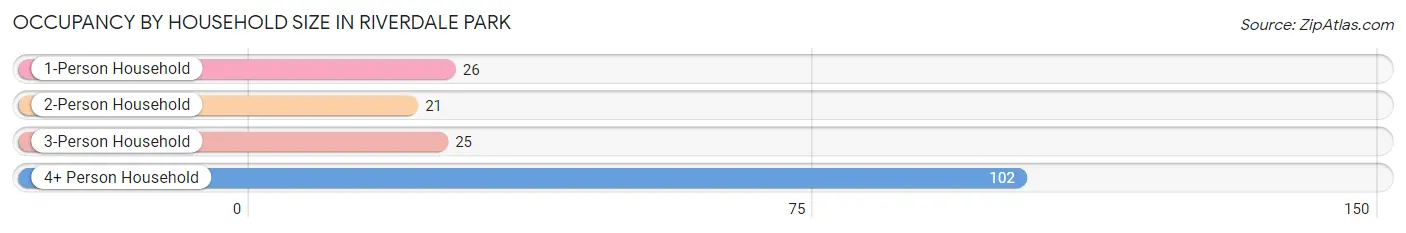
| Household Size | # Housing Units | % Housing Units |
| 1-Person Household | 26 | 14.9% |
| 2-Person Household | 21 | 12.1% |
| 3-Person Household | 25 | 14.4% |
| 4+ Person Household | 102 | 58.6% |
| Total Housing Units | 174 | 100.0% |
Occupancy by Ownership by Household Size in Riverdale Park
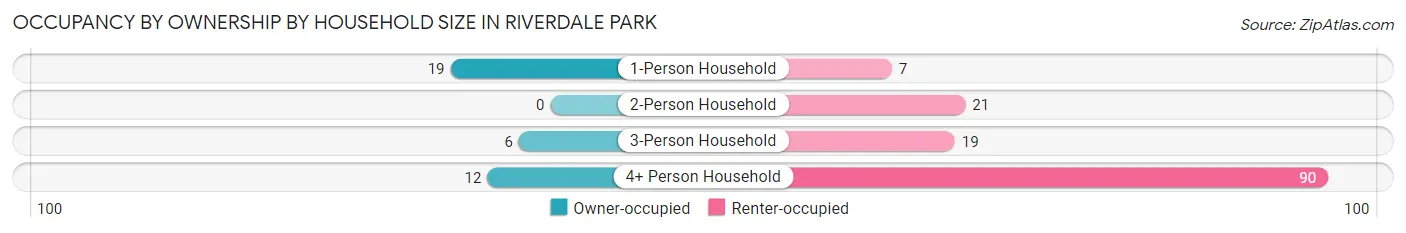
| Household Size | Owner-occupied | Renter-occupied |
| 1-Person Household | 19 (73.1%) | 7 (26.9%) |
| 2-Person Household | 0 (0.0%) | 21 (100.0%) |
| 3-Person Household | 6 (24.0%) | 19 (76.0%) |
| 4+ Person Household | 12 (11.8%) | 90 (88.2%) |
| Total Housing Units | 37 (21.3%) | 137 (78.7%) |
Occupancy by Educational Attainment in Riverdale Park
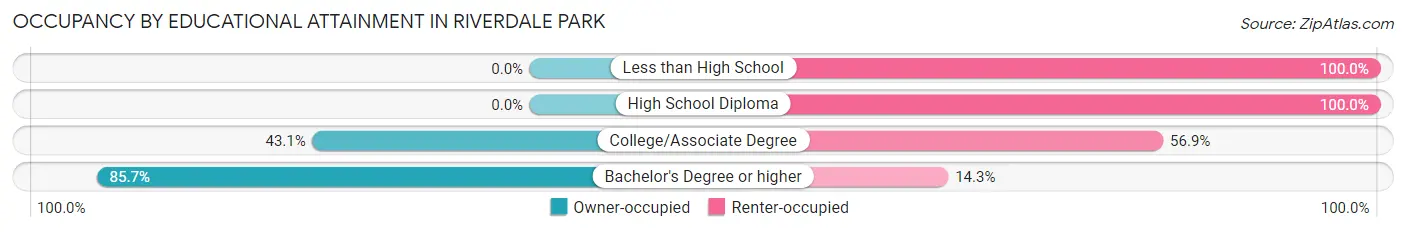
| Household Size | Owner-occupied | Renter-occupied |
| Less than High School | 0 (0.0%) | 59 (100.0%) |
| High School Diploma | 0 (0.0%) | 43 (100.0%) |
| College/Associate Degree | 25 (43.1%) | 33 (56.9%) |
| Bachelor's Degree or higher | 12 (85.7%) | 2 (14.3%) |
Occupancy by Age of Householder in Riverdale Park
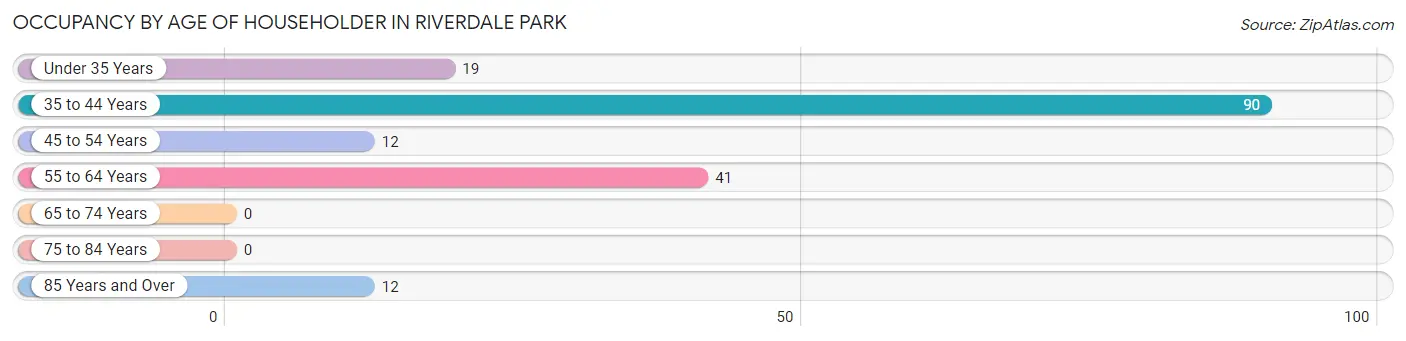
| Age Bracket | # Households | % Households |
| Under 35 Years | 19 | 10.9% |
| 35 to 44 Years | 90 | 51.7% |
| 45 to 54 Years | 12 | 6.9% |
| 55 to 64 Years | 41 | 23.6% |
| 65 to 74 Years | 0 | 0.0% |
| 75 to 84 Years | 0 | 0.0% |
| 85 Years and Over | 12 | 6.9% |
| Total | 174 | 100.0% |
Housing Finances in Riverdale Park
Median Income by Occupancy in Riverdale Park
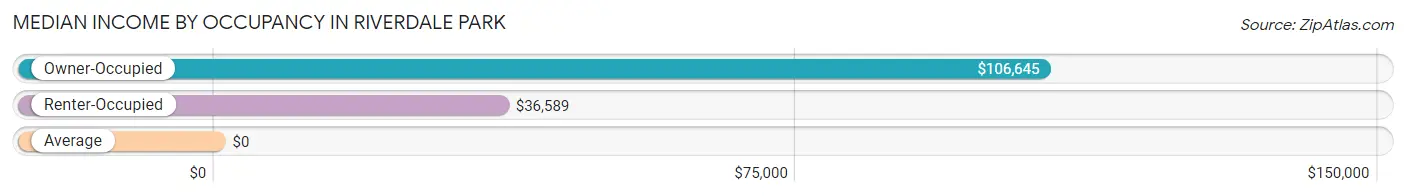
| Occupancy Type | # Households | Median Income |
| Owner-Occupied | 37 (21.3%) | $106,645 |
| Renter-Occupied | 137 (78.7%) | $36,589 |
| Average | 174 (100.0%) | $0 |
Occupancy by Householder Income Bracket in Riverdale Park
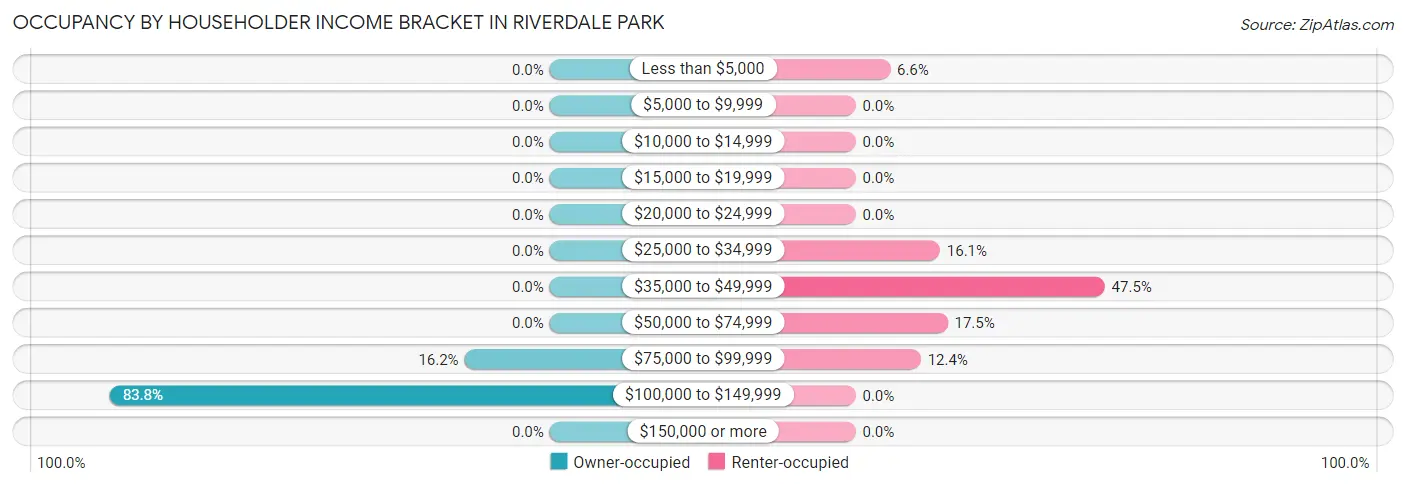
| Income Bracket | Owner-occupied | Renter-occupied |
| Less than $5,000 | 0 (0.0%) | 9 (6.6%) |
| $5,000 to $9,999 | 0 (0.0%) | 0 (0.0%) |
| $10,000 to $14,999 | 0 (0.0%) | 0 (0.0%) |
| $15,000 to $19,999 | 0 (0.0%) | 0 (0.0%) |
| $20,000 to $24,999 | 0 (0.0%) | 0 (0.0%) |
| $25,000 to $34,999 | 0 (0.0%) | 22 (16.1%) |
| $35,000 to $49,999 | 0 (0.0%) | 65 (47.4%) |
| $50,000 to $74,999 | 0 (0.0%) | 24 (17.5%) |
| $75,000 to $99,999 | 6 (16.2%) | 17 (12.4%) |
| $100,000 to $149,999 | 31 (83.8%) | 0 (0.0%) |
| $150,000 or more | 0 (0.0%) | 0 (0.0%) |
| Total | 37 (100.0%) | 137 (100.0%) |
Monthly Housing Cost Tiers in Riverdale Park
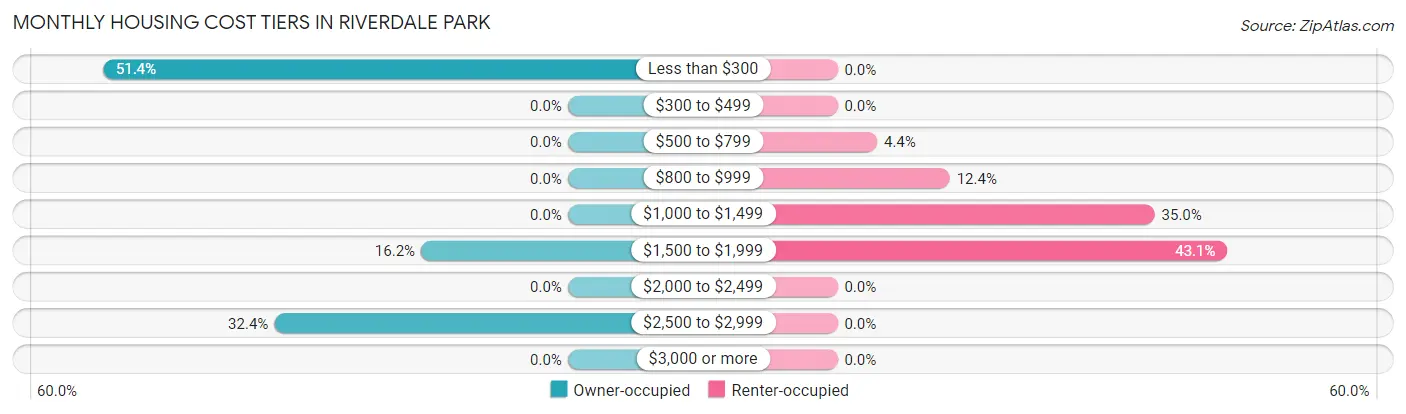
| Monthly Cost | Owner-occupied | Renter-occupied |
| Less than $300 | 19 (51.3%) | 0 (0.0%) |
| $300 to $499 | 0 (0.0%) | 0 (0.0%) |
| $500 to $799 | 0 (0.0%) | 6 (4.4%) |
| $800 to $999 | 0 (0.0%) | 17 (12.4%) |
| $1,000 to $1,499 | 0 (0.0%) | 48 (35.0%) |
| $1,500 to $1,999 | 6 (16.2%) | 59 (43.1%) |
| $2,000 to $2,499 | 0 (0.0%) | 0 (0.0%) |
| $2,500 to $2,999 | 12 (32.4%) | 0 (0.0%) |
| $3,000 or more | 0 (0.0%) | 0 (0.0%) |
| Total | 37 (100.0%) | 137 (100.0%) |
Physical Housing Characteristics in Riverdale Park
Housing Structures in Riverdale Park
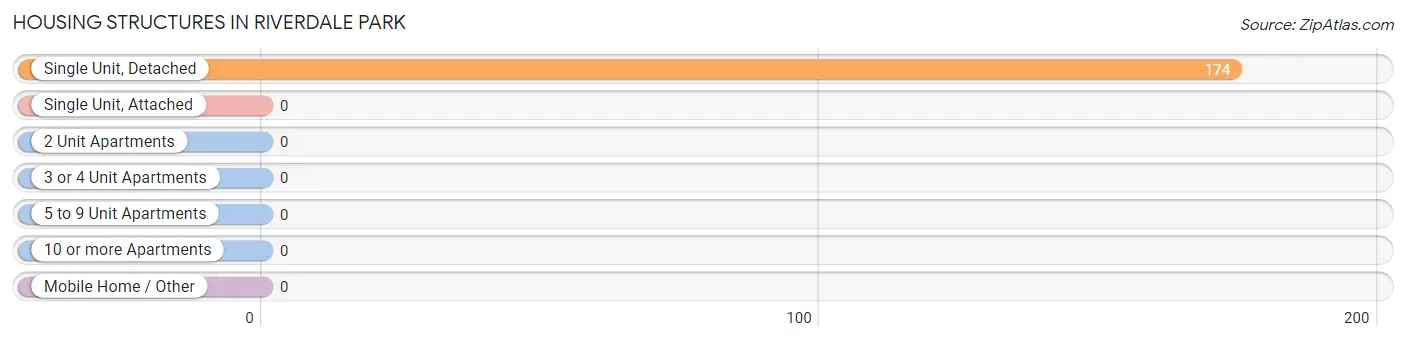
| Structure Type | # Housing Units | % Housing Units |
| Single Unit, Detached | 174 | 100.0% |
| Single Unit, Attached | 0 | 0.0% |
| 2 Unit Apartments | 0 | 0.0% |
| 3 or 4 Unit Apartments | 0 | 0.0% |
| 5 to 9 Unit Apartments | 0 | 0.0% |
| 10 or more Apartments | 0 | 0.0% |
| Mobile Home / Other | 0 | 0.0% |
| Total | 174 | 100.0% |
Housing Structures by Occupancy in Riverdale Park
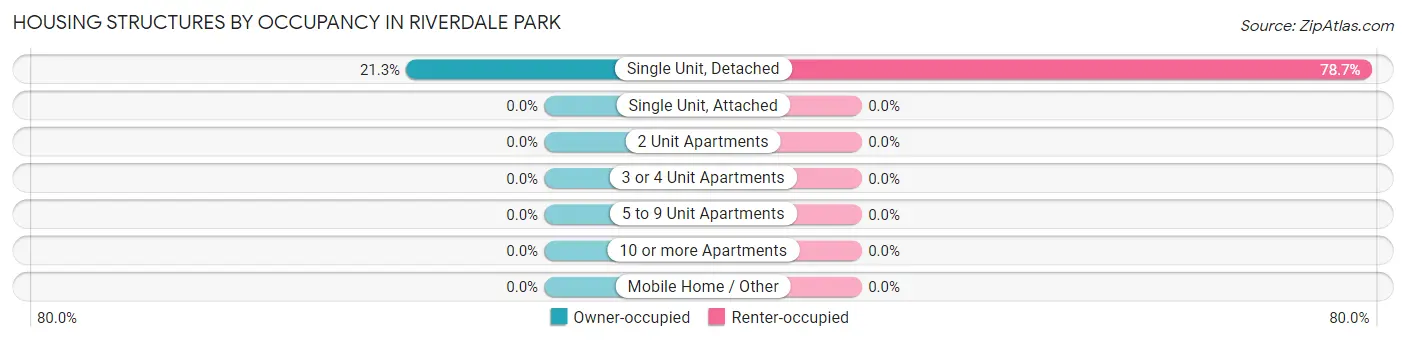
| Structure Type | Owner-occupied | Renter-occupied |
| Single Unit, Detached | 37 (21.3%) | 137 (78.7%) |
| Single Unit, Attached | 0 (0.0%) | 0 (0.0%) |
| 2 Unit Apartments | 0 (0.0%) | 0 (0.0%) |
| 3 or 4 Unit Apartments | 0 (0.0%) | 0 (0.0%) |
| 5 to 9 Unit Apartments | 0 (0.0%) | 0 (0.0%) |
| 10 or more Apartments | 0 (0.0%) | 0 (0.0%) |
| Mobile Home / Other | 0 (0.0%) | 0 (0.0%) |
| Total | 37 (21.3%) | 137 (78.7%) |
Housing Structures by Number of Rooms in Riverdale Park
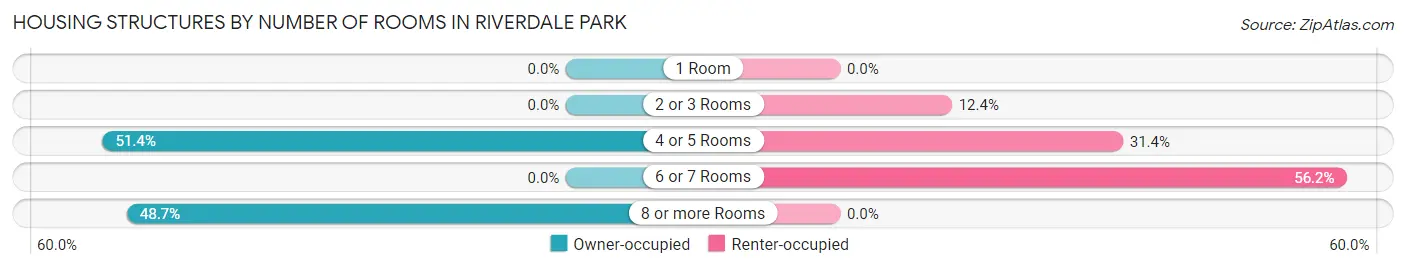
| Number of Rooms | Owner-occupied | Renter-occupied |
| 1 Room | 0 (0.0%) | 0 (0.0%) |
| 2 or 3 Rooms | 0 (0.0%) | 17 (12.4%) |
| 4 or 5 Rooms | 19 (51.3%) | 43 (31.4%) |
| 6 or 7 Rooms | 0 (0.0%) | 77 (56.2%) |
| 8 or more Rooms | 18 (48.6%) | 0 (0.0%) |
| Total | 37 (100.0%) | 137 (100.0%) |
Housing Structure by Heating Type in Riverdale Park
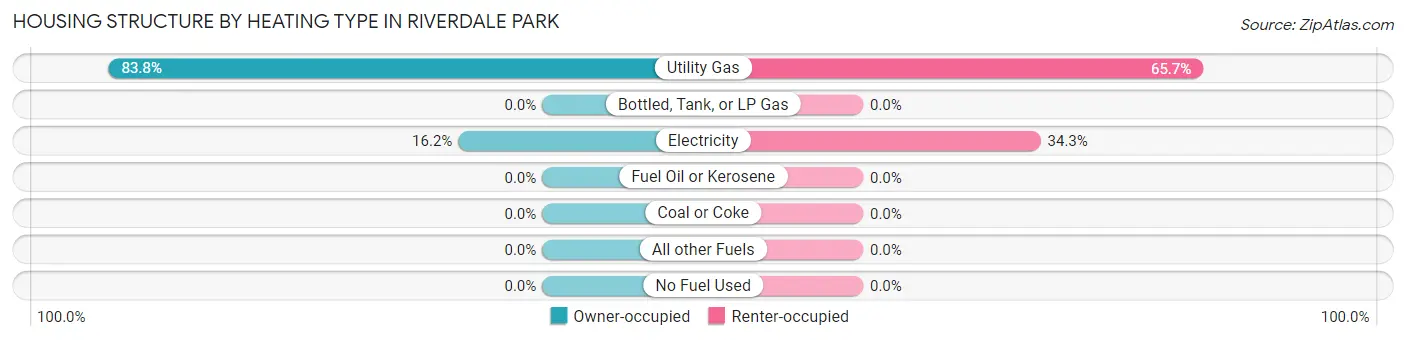
| Heating Type | Owner-occupied | Renter-occupied |
| Utility Gas | 31 (83.8%) | 90 (65.7%) |
| Bottled, Tank, or LP Gas | 0 (0.0%) | 0 (0.0%) |
| Electricity | 6 (16.2%) | 47 (34.3%) |
| Fuel Oil or Kerosene | 0 (0.0%) | 0 (0.0%) |
| Coal or Coke | 0 (0.0%) | 0 (0.0%) |
| All other Fuels | 0 (0.0%) | 0 (0.0%) |
| No Fuel Used | 0 (0.0%) | 0 (0.0%) |
| Total | 37 (100.0%) | 137 (100.0%) |
Household Vehicle Usage in Riverdale Park
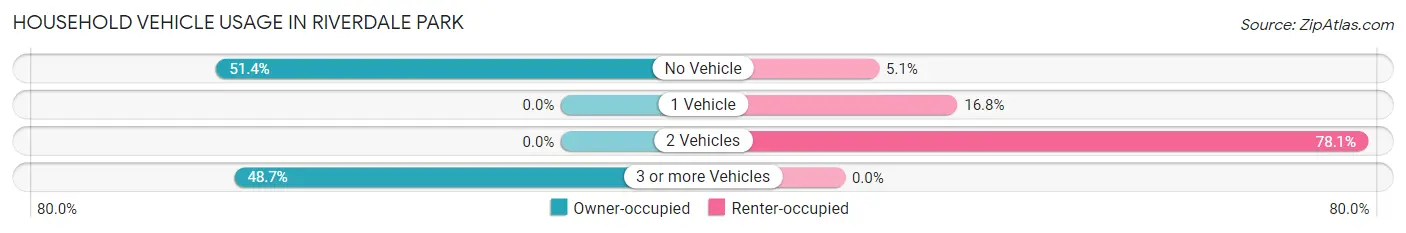
| Vehicles per Household | Owner-occupied | Renter-occupied |
| No Vehicle | 19 (51.3%) | 7 (5.1%) |
| 1 Vehicle | 0 (0.0%) | 23 (16.8%) |
| 2 Vehicles | 0 (0.0%) | 107 (78.1%) |
| 3 or more Vehicles | 18 (48.6%) | 0 (0.0%) |
| Total | 37 (100.0%) | 137 (100.0%) |
Real Estate & Mortgages in Riverdale Park
Real Estate and Mortgage Overview in Riverdale Park
| Characteristic | Without Mortgage | With Mortgage |
| Housing Units | 19 | 18 |
| Median Property Value | - | - |
| Median Household Income | - | - |
| Monthly Housing Costs | - | - |
| Real Estate Taxes | - | - |
Property Value by Mortgage Status in Riverdale Park
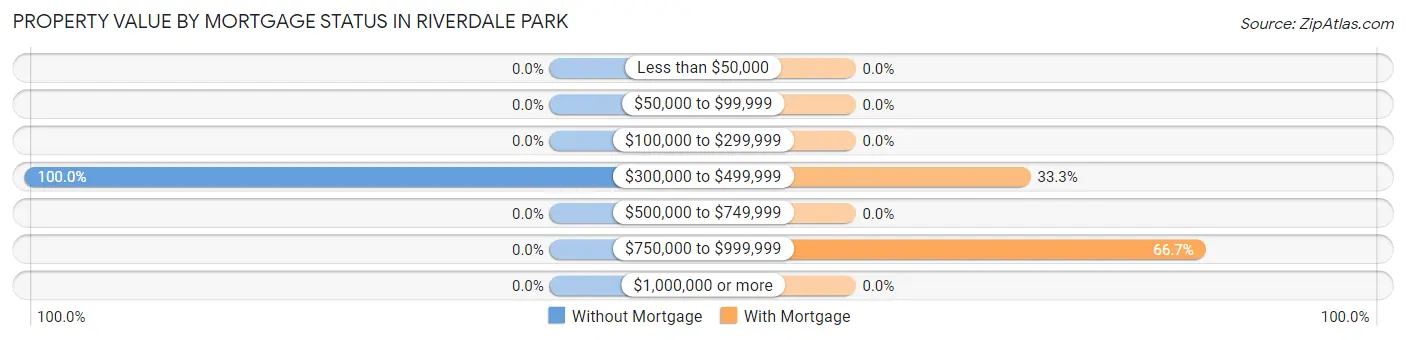
| Property Value | Without Mortgage | With Mortgage |
| Less than $50,000 | 0 (0.0%) | 0 (0.0%) |
| $50,000 to $99,999 | 0 (0.0%) | 0 (0.0%) |
| $100,000 to $299,999 | 0 (0.0%) | 0 (0.0%) |
| $300,000 to $499,999 | 19 (100.0%) | 6 (33.3%) |
| $500,000 to $749,999 | 0 (0.0%) | 0 (0.0%) |
| $750,000 to $999,999 | 0 (0.0%) | 12 (66.7%) |
| $1,000,000 or more | 0 (0.0%) | 0 (0.0%) |
| Total | 19 (100.0%) | 18 (100.0%) |
Household Income by Mortgage Status in Riverdale Park
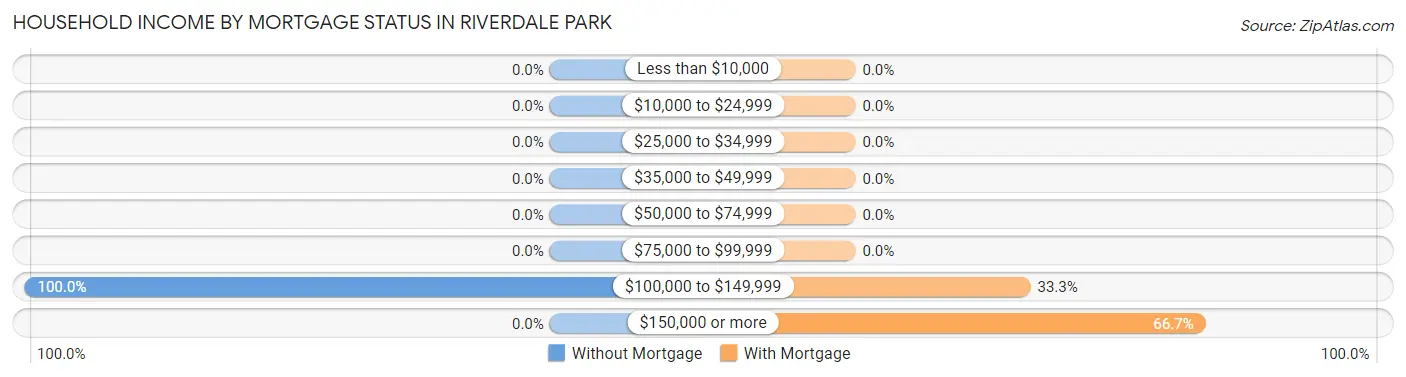
| Household Income | Without Mortgage | With Mortgage |
| Less than $10,000 | 0 (0.0%) | 0 (0.0%) |
| $10,000 to $24,999 | 0 (0.0%) | 0 (0.0%) |
| $25,000 to $34,999 | 0 (0.0%) | 0 (0.0%) |
| $35,000 to $49,999 | 0 (0.0%) | 0 (0.0%) |
| $50,000 to $74,999 | 0 (0.0%) | 0 (0.0%) |
| $75,000 to $99,999 | 0 (0.0%) | 0 (0.0%) |
| $100,000 to $149,999 | 19 (100.0%) | 6 (33.3%) |
| $150,000 or more | 0 (0.0%) | 12 (66.7%) |
| Total | 19 (100.0%) | 18 (100.0%) |
Property Value to Household Income Ratio in Riverdale Park
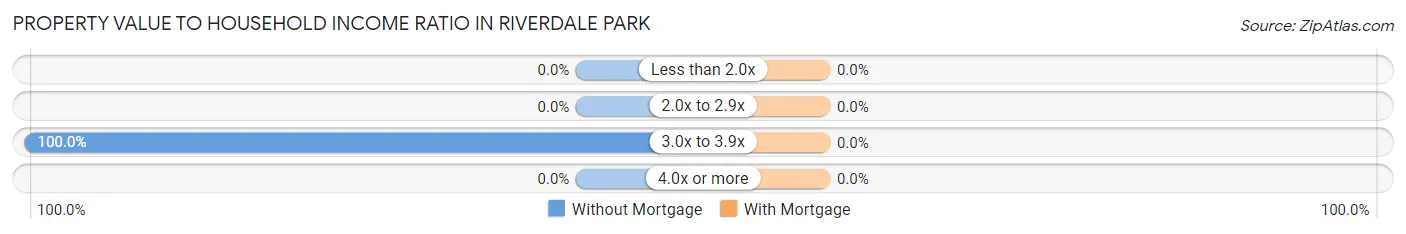
| Value-to-Income Ratio | Without Mortgage | With Mortgage |
| Less than 2.0x | 0 (0.0%) | 0 (0.0%) |
| 2.0x to 2.9x | 0 (0.0%) | 0 (0.0%) |
| 3.0x to 3.9x | 19 (100.0%) | 0 (0.0%) |
| 4.0x or more | 0 (0.0%) | 0 (0.0%) |
| Total | 19 (100.0%) | 18 (100.0%) |
Real Estate Taxes by Mortgage Status in Riverdale Park
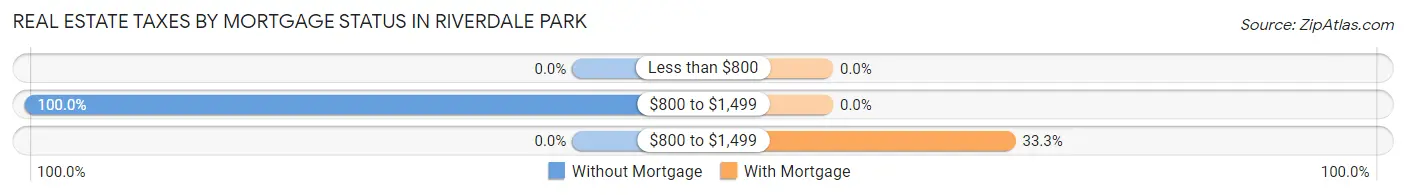
| Property Taxes | Without Mortgage | With Mortgage |
| Less than $800 | 0 (0.0%) | 0 (0.0%) |
| $800 to $1,499 | 19 (100.0%) | 0 (0.0%) |
| $800 to $1,499 | 0 (0.0%) | 6 (33.3%) |
| Total | 19 (100.0%) | 18 (100.0%) |
Health & Disability in Riverdale Park
Health Insurance Coverage by Age in Riverdale Park
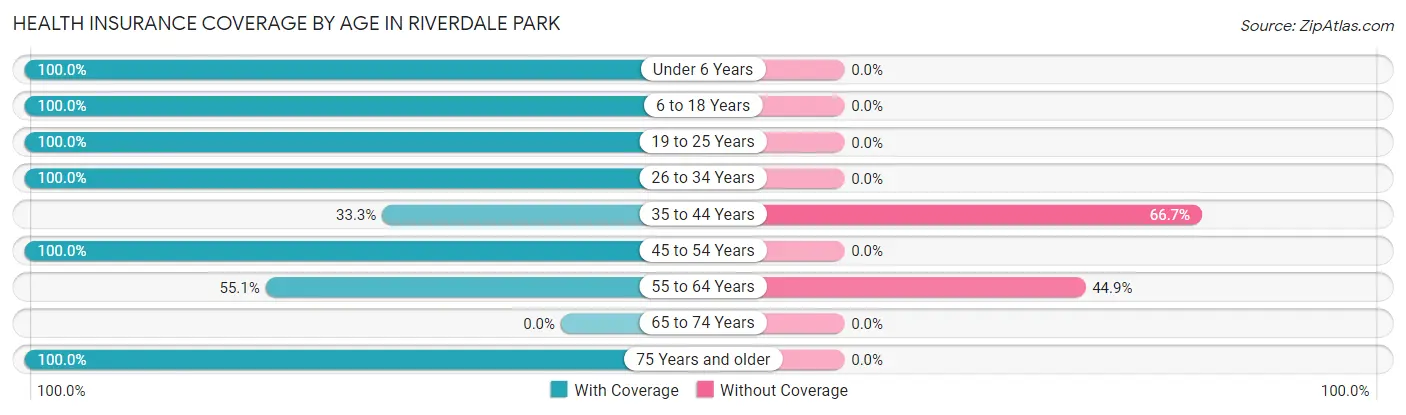
| Age Bracket | With Coverage | Without Coverage |
| Under 6 Years | 66 (100.0%) | 0 (0.0%) |
| 6 to 18 Years | 315 (100.0%) | 0 (0.0%) |
| 19 to 25 Years | 106 (100.0%) | 0 (0.0%) |
| 26 to 34 Years | 63 (100.0%) | 0 (0.0%) |
| 35 to 44 Years | 42 (33.3%) | 84 (66.7%) |
| 45 to 54 Years | 24 (100.0%) | 0 (0.0%) |
| 55 to 64 Years | 38 (55.1%) | 31 (44.9%) |
| 65 to 74 Years | 0 (0.0%) | 0 (0.0%) |
| 75 Years and older | 26 (100.0%) | 0 (0.0%) |
| Total | 680 (85.5%) | 115 (14.5%) |
Health Insurance Coverage by Citizenship Status in Riverdale Park
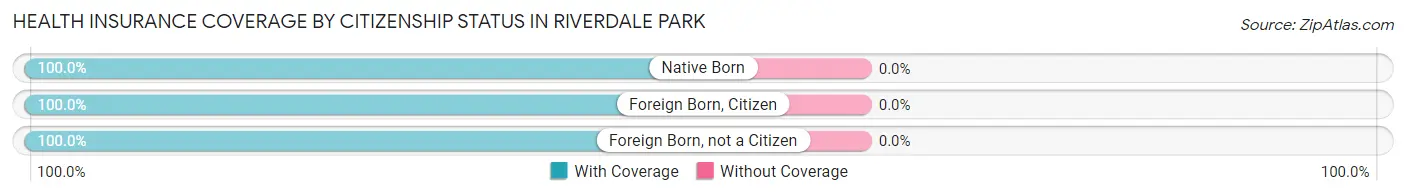
| Citizenship Status | With Coverage | Without Coverage |
| Native Born | 66 (100.0%) | 0 (0.0%) |
| Foreign Born, Citizen | 315 (100.0%) | 0 (0.0%) |
| Foreign Born, not a Citizen | 106 (100.0%) | 0 (0.0%) |
Health Insurance Coverage by Household Income in Riverdale Park
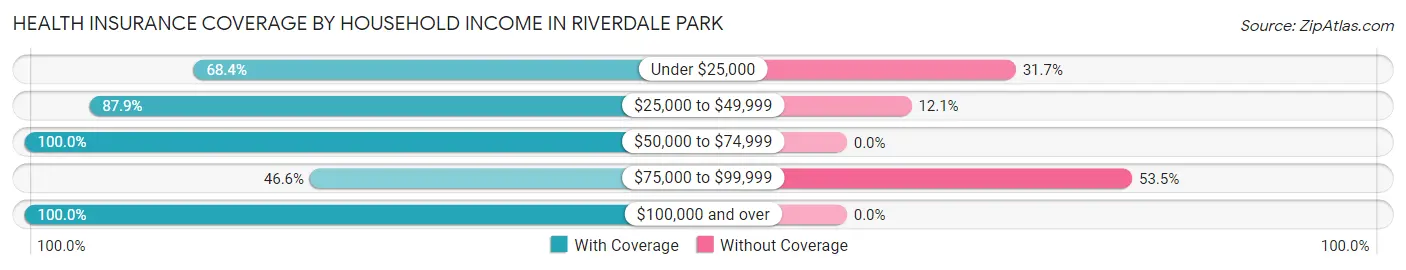
| Household Income | With Coverage | Without Coverage |
| Under $25,000 | 54 (68.3%) | 25 (31.7%) |
| $25,000 to $49,999 | 428 (87.9%) | 59 (12.1%) |
| $50,000 to $74,999 | 86 (100.0%) | 0 (0.0%) |
| $75,000 to $99,999 | 27 (46.6%) | 31 (53.4%) |
| $100,000 and over | 85 (100.0%) | 0 (0.0%) |
Public vs Private Health Insurance Coverage by Age in Riverdale Park
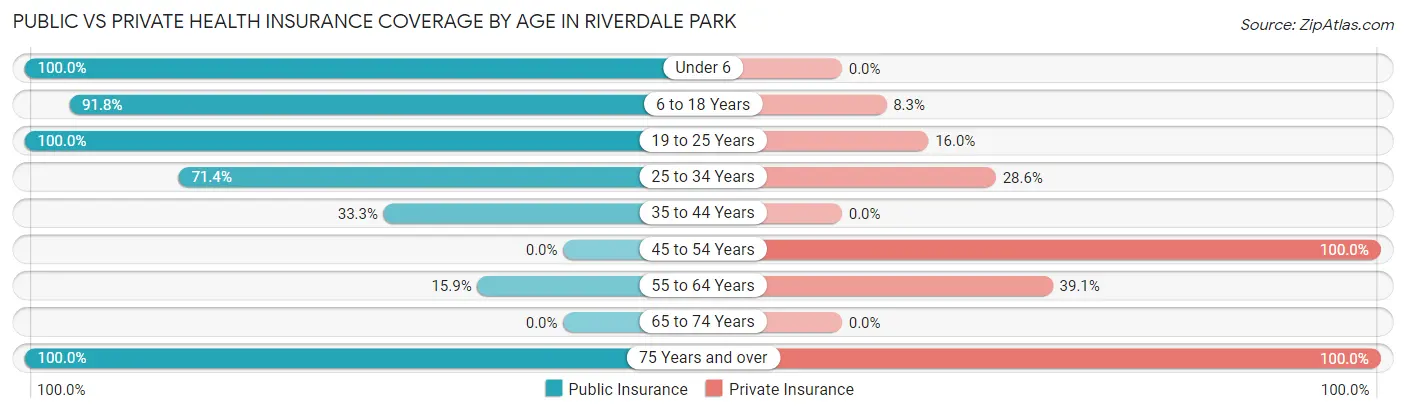
| Age Bracket | Public Insurance | Private Insurance |
| Under 6 | 66 (100.0%) | 0 (0.0%) |
| 6 to 18 Years | 289 (91.7%) | 26 (8.3%) |
| 19 to 25 Years | 106 (100.0%) | 17 (16.0%) |
| 25 to 34 Years | 45 (71.4%) | 18 (28.6%) |
| 35 to 44 Years | 42 (33.3%) | 0 (0.0%) |
| 45 to 54 Years | 0 (0.0%) | 24 (100.0%) |
| 55 to 64 Years | 11 (15.9%) | 27 (39.1%) |
| 65 to 74 Years | 0 (0.0%) | 0 (0.0%) |
| 75 Years and over | 26 (100.0%) | 26 (100.0%) |
| Total | 585 (73.6%) | 138 (17.4%) |
Disability Status by Sex by Age in Riverdale Park
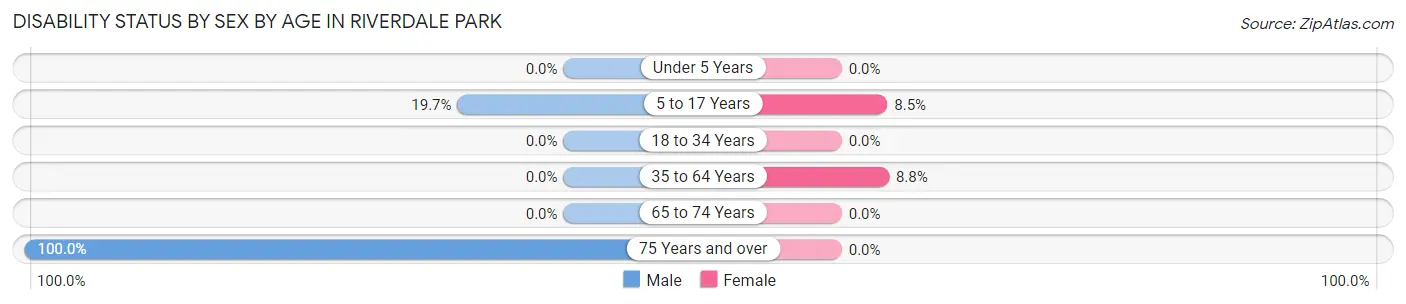
| Age Bracket | Male | Female |
| Under 5 Years | 0 (0.0%) | 0 (0.0%) |
| 5 to 17 Years | 48 (19.7%) | 6 (8.5%) |
| 18 to 34 Years | 0 (0.0%) | 0 (0.0%) |
| 35 to 64 Years | 0 (0.0%) | 12 (8.8%) |
| 65 to 74 Years | 0 (0.0%) | 0 (0.0%) |
| 75 Years and over | 19 (100.0%) | 0 (0.0%) |
Disability Class by Sex by Age in Riverdale Park
Disability Class: Hearing Difficulty
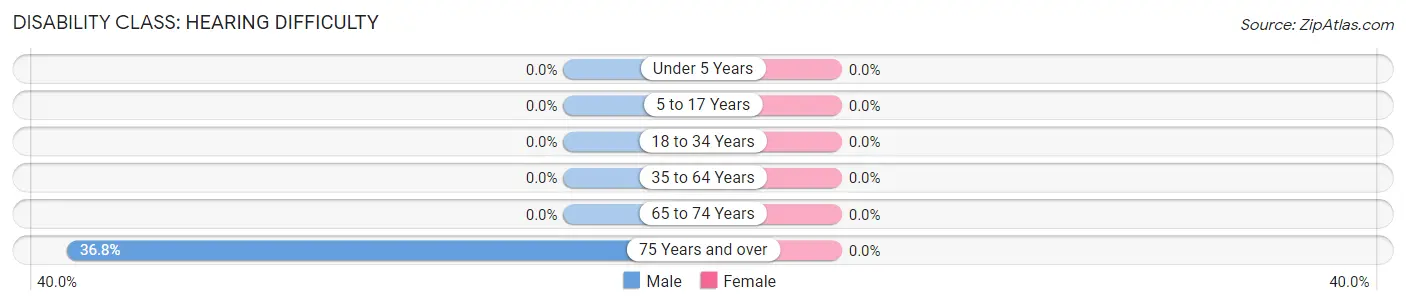
| Age Bracket | Male | Female |
| Under 5 Years | 0 (0.0%) | 0 (0.0%) |
| 5 to 17 Years | 0 (0.0%) | 0 (0.0%) |
| 18 to 34 Years | 0 (0.0%) | 0 (0.0%) |
| 35 to 64 Years | 0 (0.0%) | 0 (0.0%) |
| 65 to 74 Years | 0 (0.0%) | 0 (0.0%) |
| 75 Years and over | 7 (36.8%) | 0 (0.0%) |
Disability Class: Vision Difficulty
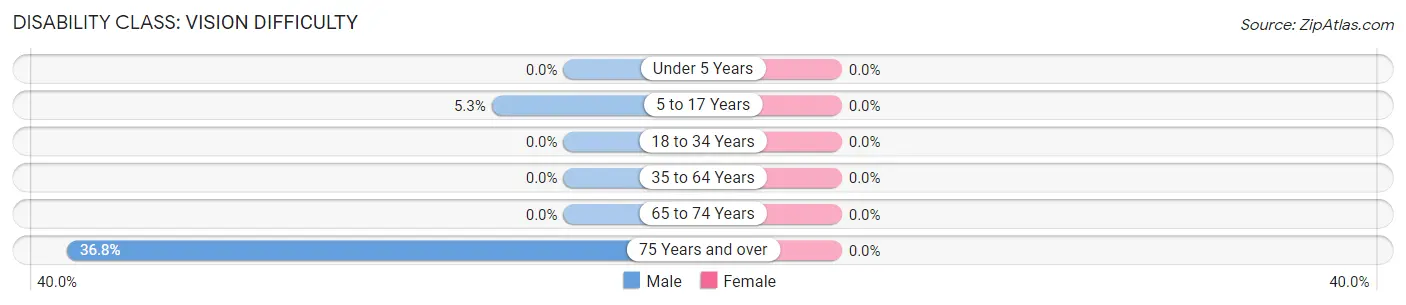
| Age Bracket | Male | Female |
| Under 5 Years | 0 (0.0%) | 0 (0.0%) |
| 5 to 17 Years | 13 (5.3%) | 0 (0.0%) |
| 18 to 34 Years | 0 (0.0%) | 0 (0.0%) |
| 35 to 64 Years | 0 (0.0%) | 0 (0.0%) |
| 65 to 74 Years | 0 (0.0%) | 0 (0.0%) |
| 75 Years and over | 7 (36.8%) | 0 (0.0%) |
Disability Class: Cognitive Difficulty
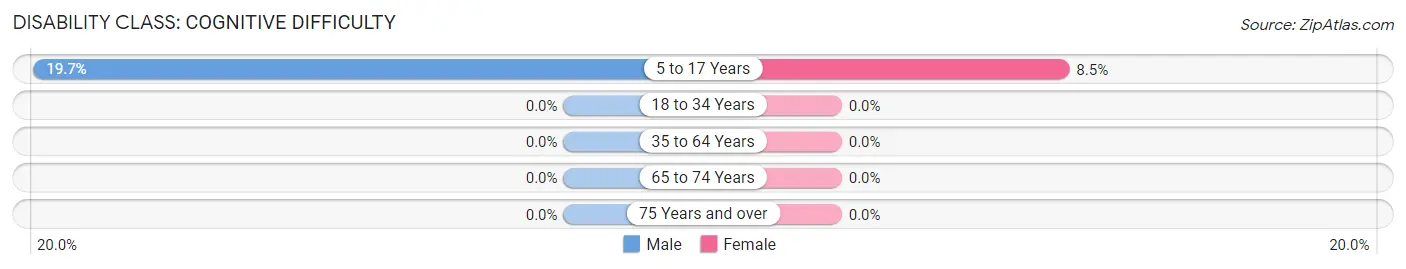
| Age Bracket | Male | Female |
| 5 to 17 Years | 48 (19.7%) | 6 (8.5%) |
| 18 to 34 Years | 0 (0.0%) | 0 (0.0%) |
| 35 to 64 Years | 0 (0.0%) | 0 (0.0%) |
| 65 to 74 Years | 0 (0.0%) | 0 (0.0%) |
| 75 Years and over | 0 (0.0%) | 0 (0.0%) |
Disability Class: Ambulatory Difficulty
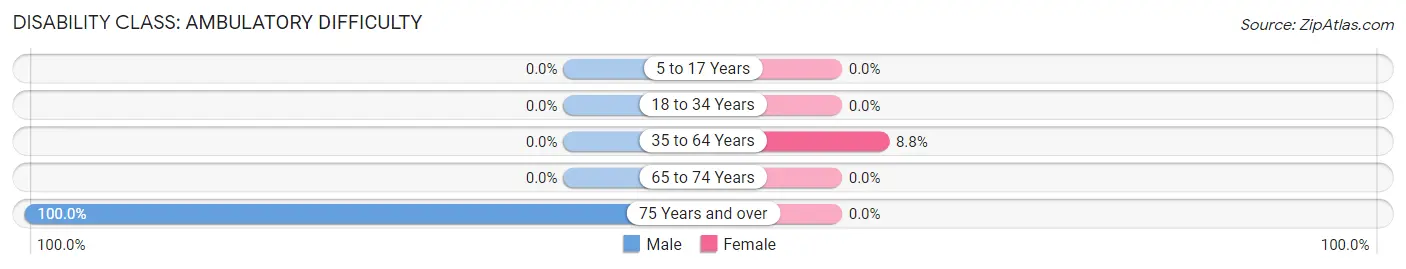
| Age Bracket | Male | Female |
| 5 to 17 Years | 0 (0.0%) | 0 (0.0%) |
| 18 to 34 Years | 0 (0.0%) | 0 (0.0%) |
| 35 to 64 Years | 0 (0.0%) | 12 (8.8%) |
| 65 to 74 Years | 0 (0.0%) | 0 (0.0%) |
| 75 Years and over | 19 (100.0%) | 0 (0.0%) |
Disability Class: Self-Care Difficulty
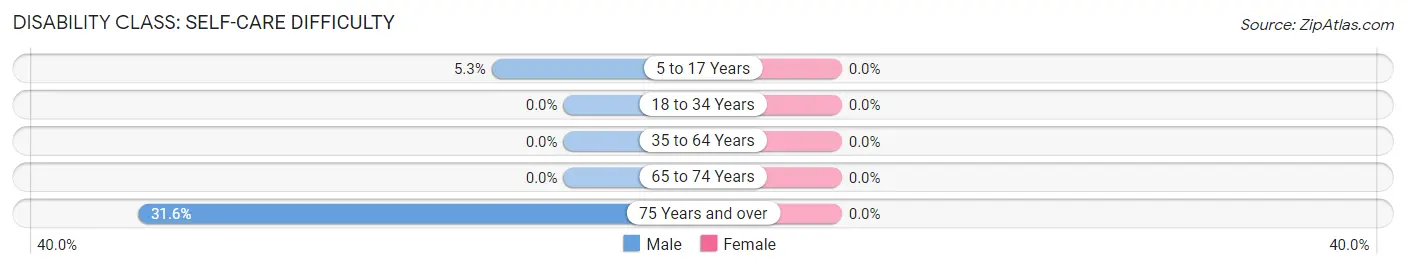
| Age Bracket | Male | Female |
| 5 to 17 Years | 13 (5.3%) | 0 (0.0%) |
| 18 to 34 Years | 0 (0.0%) | 0 (0.0%) |
| 35 to 64 Years | 0 (0.0%) | 0 (0.0%) |
| 65 to 74 Years | 0 (0.0%) | 0 (0.0%) |
| 75 Years and over | 6 (31.6%) | 0 (0.0%) |
Technology Access in Riverdale Park
Computing Device Access in Riverdale Park
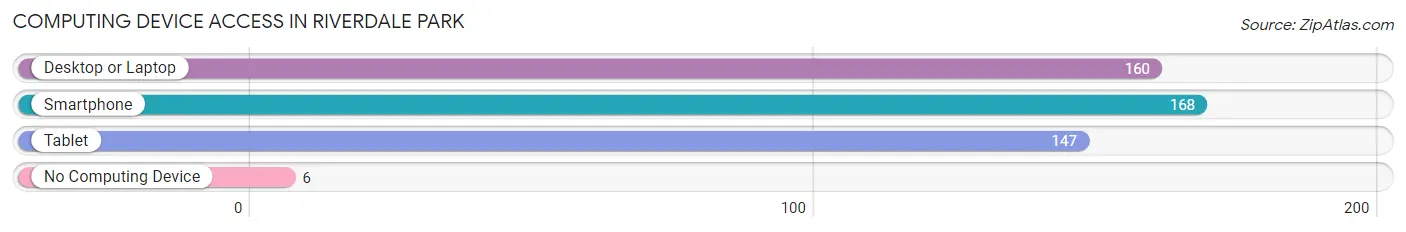
| Device Type | # Households | % Households |
| Desktop or Laptop | 160 | 91.9% |
| Smartphone | 168 | 96.6% |
| Tablet | 147 | 84.5% |
| No Computing Device | 6 | 3.5% |
| Total | 174 | 100.0% |
Internet Access in Riverdale Park
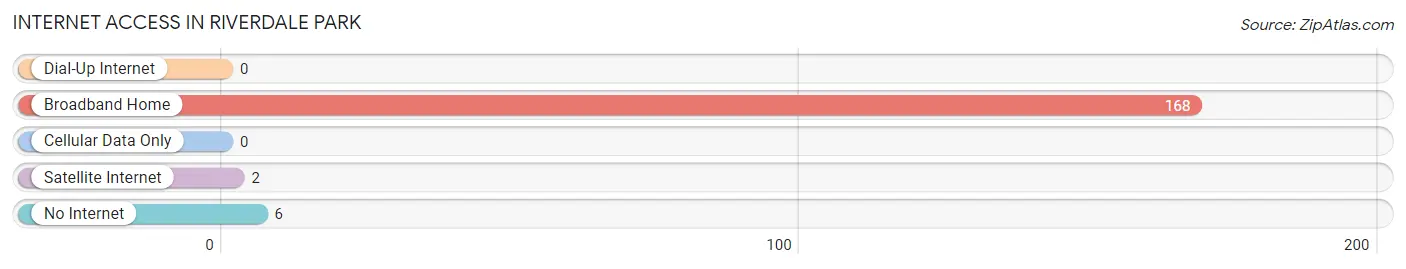
| Internet Type | # Households | % Households |
| Dial-Up Internet | 0 | 0.0% |
| Broadband Home | 168 | 96.6% |
| Cellular Data Only | 0 | 0.0% |
| Satellite Internet | 2 | 1.1% |
| No Internet | 6 | 3.5% |
| Total | 174 | 100.0% |
Riverdale Park Summary
Riverdale Park is a small unincorporated community located in the San Gabriel Valley of Los Angeles County, California. It is situated in the foothills of the San Gabriel Mountains, approximately 25 miles northeast of downtown Los Angeles. The community is bordered by the cities of Arcadia, Monrovia, and Duarte. The population of Riverdale Park was estimated to be 1,845 in 2019.
History
The area that is now Riverdale Park was originally inhabited by the Tongva people, who were the original inhabitants of the Los Angeles Basin. The area was later settled by Spanish missionaries in the late 18th century. The area was part of the Rancho Santa Anita land grant, which was granted to Hugo Reid in 1839. The area was later subdivided and sold to settlers in the late 19th century.
The community of Riverdale Park was established in the early 20th century. The community was named after the nearby Riverdale Country Club, which was founded in 1906. The community was originally a rural farming community, but it began to develop into a residential area in the 1950s.
Geography
Riverdale Park is located in the San Gabriel Valley of Los Angeles County, California. It is situated in the foothills of the San Gabriel Mountains, approximately 25 miles northeast of downtown Los Angeles. The community is bordered by the cities of Arcadia, Monrovia, and Duarte. The area is characterized by rolling hills and is home to several parks and open spaces.
The climate in Riverdale Park is classified as a Mediterranean climate, with hot, dry summers and mild, wet winters. The average annual temperature is 68°F, with an average high of 86°F in the summer and an average low of 50°F in the winter. The average annual precipitation is 15.5 inches.
Economy
The economy of Riverdale Park is largely based on the service industry. The community is home to several restaurants, retail stores, and other businesses. The community is also home to several medical and professional offices.
The median household income in Riverdale Park is $68,845, which is higher than the national average of $61,937. The median home value is $717,000, which is higher than the national average of $184,700.
Demographics
The population of Riverdale Park was estimated to be 1,845 in 2019. The population is composed of a diverse mix of ethnicities, with the largest groups being White (45.3%), Hispanic or Latino (30.2%), Asian (14.2%), and African American (4.2%). The median age is 39.3 years, and the gender ratio is almost even, with 50.3% female and 49.7% male.
The majority of the population (77.2%) is employed, with the largest industries being healthcare and social assistance (14.2%), retail trade (13.2%), and professional, scientific, and technical services (11.2%). The median household income is $68,845, and the median home value is $717,000.
Conclusion
Riverdale Park is a small unincorporated community located in the San Gabriel Valley of Los Angeles County, California. It is situated in the foothills of the San Gabriel Mountains, approximately 25 miles northeast of downtown Los Angeles. The community is bordered by the cities of Arcadia, Monrovia, and Duarte. The population of Riverdale Park was estimated to be 1,845 in 2019. The economy of Riverdale Park is largely based on the service industry, and the population is composed of a diverse mix of ethnicities. The median household income is $68,845, and the median home value is $717,000.
Common Questions
What is Per Capita Income in Riverdale Park?
Per Capita income in Riverdale Park is $16,077.
What is the Median Family Income in Riverdale Park?
Median Family Income in Riverdale Park is $36,504.
What is Inequality or Gini Index in Riverdale Park?
Inequality or Gini Index in Riverdale Park is 0.33.
What is the Total Population of Riverdale Park?
Total Population of Riverdale Park is 795.
What is the Total Male Population of Riverdale Park?
Total Male Population of Riverdale Park is 519.
What is the Total Female Population of Riverdale Park?
Total Female Population of Riverdale Park is 276.
What is the Ratio of Males per 100 Females in Riverdale Park?
There are 188.04 Males per 100 Females in Riverdale Park.
What is the Ratio of Females per 100 Males in Riverdale Park?
There are 53.18 Females per 100 Males in Riverdale Park.
What is the Median Population Age in Riverdale Park?
Median Population Age in Riverdale Park is 20.2 Years.
What is the Average Family Size in Riverdale Park
Average Family Size in Riverdale Park is 5.4 People.
What is the Average Household Size in Riverdale Park
Average Household Size in Riverdale Park is 4.6 People.
How Large is the Labor Force in Riverdale Park?
There are 205 People in the Labor Forcein in Riverdale Park.
What is the Percentage of People in the Labor Force in Riverdale Park?
44.4% of People are in the Labor Force in Riverdale Park.