Cities with the Highest Percentage of Population with a Degree in Computers and Mathematics in Mississippi
RELATED REPORTS & OPTIONS
Computers and Mathematics
Mississippi
Compare Cities
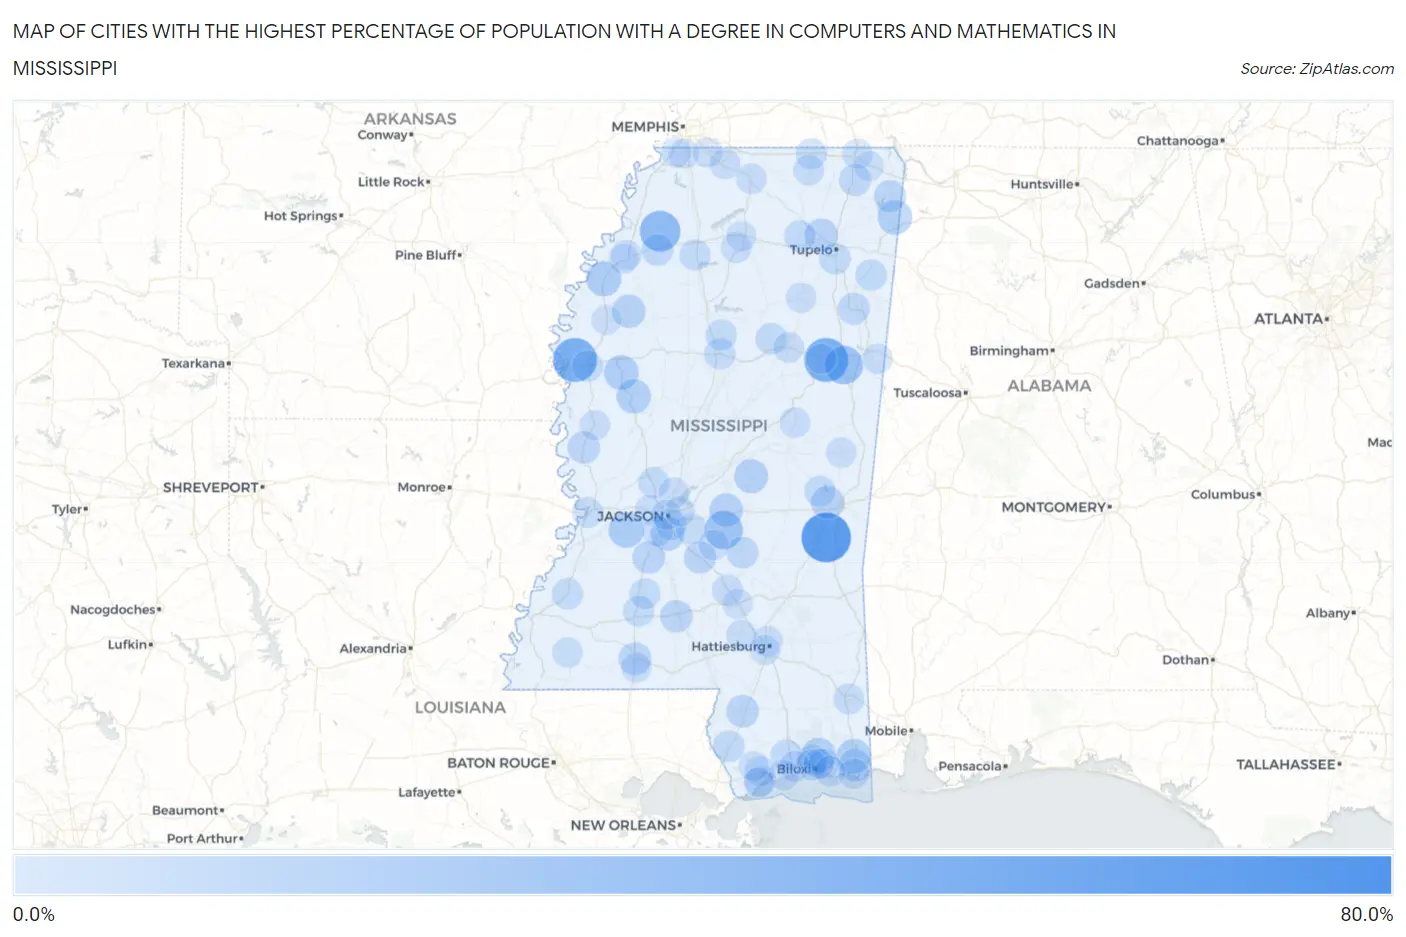
Map of Cities with the Highest Percentage of Population with a Degree in Computers and Mathematics in Mississippi
0.0%
80.0%
Cities with the Highest Percentage of Population with a Degree in Computers and Mathematics in Mississippi
| City | % Graduates | vs State | vs National | |
| 1. | Bogue Chitto Cdp Kemper And Neshoba Counties | 67.9% | 3.2%(+64.6)#1 | 4.9%(+63.0)#57 |
| 2. | Stonewall | 59.6% | 3.2%(+56.3)#2 | 4.9%(+54.7)#74 |
| 3. | Bobo | 53.1% | 3.2%(+49.9)#3 | 4.9%(+48.2)#90 |
| 4. | Mississippi State | 43.2% | 3.2%(+40.0)#4 | 4.9%(+38.3)#144 |
| 5. | Metcalfe | 43.2% | 3.2%(+40.0)#5 | 4.9%(+38.3)#145 |
| 6. | Falcon | 33.3% | 3.2%(+30.1)#6 | 4.9%(+28.4)#240 |
| 7. | Artesia | 26.9% | 3.2%(+23.7)#7 | 4.9%(+22.0)#358 |
| 8. | Polkville | 25.9% | 3.2%(+22.7)#8 | 4.9%(+21.0)#382 |
| 9. | Learned | 18.2% | 3.2%(+15.0)#9 | 4.9%(+13.3)#738 |
| 10. | Duncan | 17.1% | 3.2%(+13.9)#10 | 4.9%(+12.2)#817 |
| 11. | Inverness | 15.8% | 3.2%(+12.6)#11 | 4.9%(+10.9)#949 |
| 12. | Escatawpa | 15.5% | 3.2%(+12.3)#12 | 4.9%(+10.6)#983 |
| 13. | Belzoni | 15.4% | 3.2%(+12.1)#13 | 4.9%(+10.5)#1,003 |
| 14. | Latimer | 15.2% | 3.2%(+12.0)#14 | 4.9%(+10.3)#1,012 |
| 15. | Golden | 15.2% | 3.2%(+11.9)#15 | 4.9%(+10.3)#1,031 |
| 16. | Cleary | 13.5% | 3.2%(+10.3)#16 | 4.9%(+8.65)#1,231 |
| 17. | Walnut Grove | 13.5% | 3.2%(+10.3)#17 | 4.9%(+8.57)#1,247 |
| 18. | Morton | 13.1% | 3.2%(+9.89)#18 | 4.9%(+8.20)#1,316 |
| 19. | Drew | 12.4% | 3.2%(+9.16)#19 | 4.9%(+7.48)#1,464 |
| 20. | Longview | 12.0% | 3.2%(+8.83)#20 | 4.9%(+7.14)#1,520 |
| 21. | Sherman | 11.6% | 3.2%(+8.38)#21 | 4.9%(+6.70)#1,629 |
| 22. | Nellieburg | 11.5% | 3.2%(+8.27)#22 | 4.9%(+6.58)#1,655 |
| 23. | Mccomb | 10.6% | 3.2%(+7.42)#23 | 4.9%(+5.74)#1,899 |
| 24. | Poplarville | 10.4% | 3.2%(+7.23)#24 | 4.9%(+5.55)#1,966 |
| 25. | Crystal Springs | 10.2% | 3.2%(+6.99)#25 | 4.9%(+5.30)#2,059 |
| 26. | Moss Point | 10.1% | 3.2%(+6.86)#26 | 4.9%(+5.18)#2,098 |
| 27. | Monticello | 10.0% | 3.2%(+6.79)#27 | 4.9%(+5.11)#2,125 |
| 28. | Cary | 10.0% | 3.2%(+6.79)#28 | 4.9%(+5.11)#2,143 |
| 29. | D Lo | 9.1% | 3.2%(+5.88)#29 | 4.9%(+4.20)#2,572 |
| 30. | Tishomingo | 9.1% | 3.2%(+5.88)#30 | 4.9%(+4.20)#2,574 |
| 31. | Raleigh | 8.9% | 3.2%(+5.65)#31 | 4.9%(+3.97)#2,700 |
| 32. | Aberdeen | 8.7% | 3.2%(+5.52)#32 | 4.9%(+3.83)#2,776 |
| 33. | Rienzi | 8.3% | 3.2%(+5.12)#33 | 4.9%(+3.44)#3,003 |
| 34. | Marks | 8.1% | 3.2%(+4.86)#34 | 4.9%(+3.17)#3,172 |
| 35. | Hide A Way Lake | 7.8% | 3.2%(+4.57)#35 | 4.9%(+2.88)#3,393 |
| 36. | Verona | 7.4% | 3.2%(+4.20)#36 | 4.9%(+2.51)#3,656 |
| 37. | Walthall | 7.3% | 3.2%(+4.11)#37 | 4.9%(+2.42)#3,741 |
| 38. | Ecru | 7.2% | 3.2%(+4.04)#38 | 4.9%(+2.35)#3,791 |
| 39. | Smithville | 6.9% | 3.2%(+3.74)#39 | 4.9%(+2.05)#4,089 |
| 40. | Winona | 6.8% | 3.2%(+3.61)#40 | 4.9%(+1.92)#4,193 |
| 41. | Fayette | 6.6% | 3.2%(+3.42)#41 | 4.9%(+1.73)#4,409 |
| 42. | Leland | 6.5% | 3.2%(+3.29)#42 | 4.9%(+1.61)#4,556 |
| 43. | Gluckstadt | 6.5% | 3.2%(+3.26)#43 | 4.9%(+1.57)#4,590 |
| 44. | Lyman | 6.5% | 3.2%(+3.26)#44 | 4.9%(+1.57)#4,592 |
| 45. | Duck Hill | 6.5% | 3.2%(+3.24)#45 | 4.9%(+1.56)#4,607 |
| 46. | Collinsville | 6.2% | 3.2%(+3.01)#46 | 4.9%(+1.32)#4,884 |
| 47. | Brookhaven | 6.2% | 3.2%(+2.95)#47 | 4.9%(+1.27)#4,936 |
| 48. | D Iberville | 6.1% | 3.2%(+2.90)#48 | 4.9%(+1.22)#5,003 |
| 49. | Pope | 6.1% | 3.2%(+2.85)#49 | 4.9%(+1.17)#5,067 |
| 50. | Beauregard | 5.9% | 3.2%(+2.67)#50 | 4.9%(+0.988)#5,310 |
| 51. | Flora | 5.8% | 3.2%(+2.61)#51 | 4.9%(+0.926)#5,394 |
| 52. | Mount Olive | 5.8% | 3.2%(+2.58)#52 | 4.9%(+0.891)#5,437 |
| 53. | Gulfport | 5.7% | 3.2%(+2.54)#53 | 4.9%(+0.854)#5,484 |
| 54. | Bay St Louis | 5.7% | 3.2%(+2.48)#54 | 4.9%(+0.791)#5,554 |
| 55. | Walnut | 5.6% | 3.2%(+2.35)#55 | 4.9%(+0.662)#5,751 |
| 56. | Lucedale | 5.5% | 3.2%(+2.33)#56 | 4.9%(+0.646)#5,800 |
| 57. | Glendale | 5.3% | 3.2%(+2.08)#57 | 4.9%(+0.392)#6,171 |
| 58. | Richland | 5.3% | 3.2%(+2.08)#58 | 4.9%(+0.391)#6,175 |
| 59. | Vicksburg | 5.3% | 3.2%(+2.04)#59 | 4.9%(+0.358)#6,259 |
| 60. | Falkner | 5.1% | 3.2%(+1.89)#60 | 4.9%(+0.208)#6,506 |
| 61. | Gulf Hills | 5.1% | 3.2%(+1.86)#61 | 4.9%(+0.180)#6,546 |
| 62. | Biloxi | 5.0% | 3.2%(+1.81)#62 | 4.9%(+0.121)#6,641 |
| 63. | Taylor | 5.0% | 3.2%(+1.79)#63 | 4.9%(+0.106)#6,694 |
| 64. | Robinhood | 4.9% | 3.2%(+1.65)#64 | 4.9%(-0.040)#6,967 |
| 65. | Mathiston | 4.8% | 3.2%(+1.62)#65 | 4.9%(-0.066)#7,012 |
| 66. | Byhalia | 4.8% | 3.2%(+1.61)#66 | 4.9%(-0.075)#7,022 |
| 67. | Gulf Park Estates | 4.8% | 3.2%(+1.54)#67 | 4.9%(-0.142)#7,164 |
| 68. | St Martin | 4.7% | 3.2%(+1.44)#68 | 4.9%(-0.243)#7,369 |
| 69. | Long Beach | 4.6% | 3.2%(+1.40)#69 | 4.9%(-0.289)#7,469 |
| 70. | Byram | 4.6% | 3.2%(+1.35)#70 | 4.9%(-0.339)#7,552 |
| 71. | Noxapater | 4.5% | 3.2%(+1.34)#71 | 4.9%(-0.349)#7,587 |
| 72. | Holly Springs | 4.5% | 3.2%(+1.30)#72 | 4.9%(-0.385)#7,666 |
| 73. | Diamondhead | 4.4% | 3.2%(+1.14)#73 | 4.9%(-0.540)#7,970 |
| 74. | New Hope | 4.3% | 3.2%(+1.09)#74 | 4.9%(-0.591)#8,101 |
| 75. | Starkville | 4.2% | 3.2%(+1.04)#75 | 4.9%(-0.644)#8,208 |
| 76. | Houston | 4.2% | 3.2%(+0.994)#76 | 4.9%(-0.690)#8,311 |
| 77. | Clinton | 4.2% | 3.2%(+0.978)#77 | 4.9%(-0.707)#8,343 |
| 78. | Puckett | 4.2% | 3.2%(+0.957)#78 | 4.9%(-0.727)#8,398 |
| 79. | Crosby | 4.2% | 3.2%(+0.957)#79 | 4.9%(-0.727)#8,406 |
| 80. | Pascagoula | 4.1% | 3.2%(+0.901)#80 | 4.9%(-0.783)#8,513 |
| 81. | De Kalb | 4.0% | 3.2%(+0.759)#81 | 4.9%(-0.926)#8,824 |
| 82. | Madison | 3.9% | 3.2%(+0.675)#82 | 4.9%(-1.01)#9,023 |
| 83. | Corinth | 3.8% | 3.2%(+0.593)#83 | 4.9%(-1.09)#9,235 |
| 84. | Sumrall | 3.8% | 3.2%(+0.554)#84 | 4.9%(-1.13)#9,320 |
| 85. | Magnolia | 3.7% | 3.2%(+0.520)#85 | 4.9%(-1.17)#9,396 |
| 86. | Anguilla | 3.7% | 3.2%(+0.494)#86 | 4.9%(-1.19)#9,454 |
| 87. | Lyon | 3.7% | 3.2%(+0.494)#87 | 4.9%(-1.19)#9,461 |
| 88. | Hattiesburg | 3.6% | 3.2%(+0.395)#88 | 4.9%(-1.29)#9,694 |
| 89. | Horn Lake | 3.5% | 3.2%(+0.332)#89 | 4.9%(-1.35)#9,839 |
| 90. | Cleveland | 3.5% | 3.2%(+0.312)#90 | 4.9%(-1.37)#9,892 |
| 91. | Oxford | 3.5% | 3.2%(+0.297)#91 | 4.9%(-1.39)#9,929 |
| 92. | Clarksdale | 3.5% | 3.2%(+0.246)#92 | 4.9%(-1.44)#10,027 |
| 93. | Collins | 3.4% | 3.2%(+0.239)#93 | 4.9%(-1.45)#10,044 |
| 94. | Kiln | 3.4% | 3.2%(+0.205)#94 | 4.9%(-1.48)#10,152 |
| 95. | Olive Branch | 3.4% | 3.2%(+0.190)#95 | 4.9%(-1.49)#10,190 |
| 96. | Glen | 3.3% | 3.2%(+0.124)#96 | 4.9%(-1.56)#10,373 |
| 97. | Waveland | 3.3% | 3.2%(+0.113)#97 | 4.9%(-1.57)#10,402 |
| 98. | Lynchburg | 3.3% | 3.2%(+0.095)#98 | 4.9%(-1.59)#10,452 |
| 99. | Jackson | 3.2% | 3.2%(-0.027)#99 | 4.9%(-1.71)#10,753 |
| 100. | Flowood | 3.1% | 3.2%(-0.117)#100 | 4.9%(-1.80)#10,959 |
Common Questions
What are the Top 10 Cities with the Highest Percentage of Population with a Degree in Computers and Mathematics in Mississippi?
Top 10 Cities with the Highest Percentage of Population with a Degree in Computers and Mathematics in Mississippi are:
What city has the Highest Percentage of Population with a Degree in Computers and Mathematics in Mississippi?
Stonewall has the Highest Percentage of Population with a Degree in Computers and Mathematics in Mississippi with 59.6%.
What is the Percentage of Population with a Degree in Computers and Mathematics in the State of Mississippi?
Percentage of Population with a Degree in Computers and Mathematics in Mississippi is 3.2%.
What is the Percentage of Population with a Degree in Computers and Mathematics in the United States?
Percentage of Population with a Degree in Computers and Mathematics in the United States is 4.9%.