Cities with the Highest Percentage of Population with a Degree in Computers and Mathematics in New Mexico
RELATED REPORTS & OPTIONS
Computers and Mathematics
New Mexico
Compare Cities
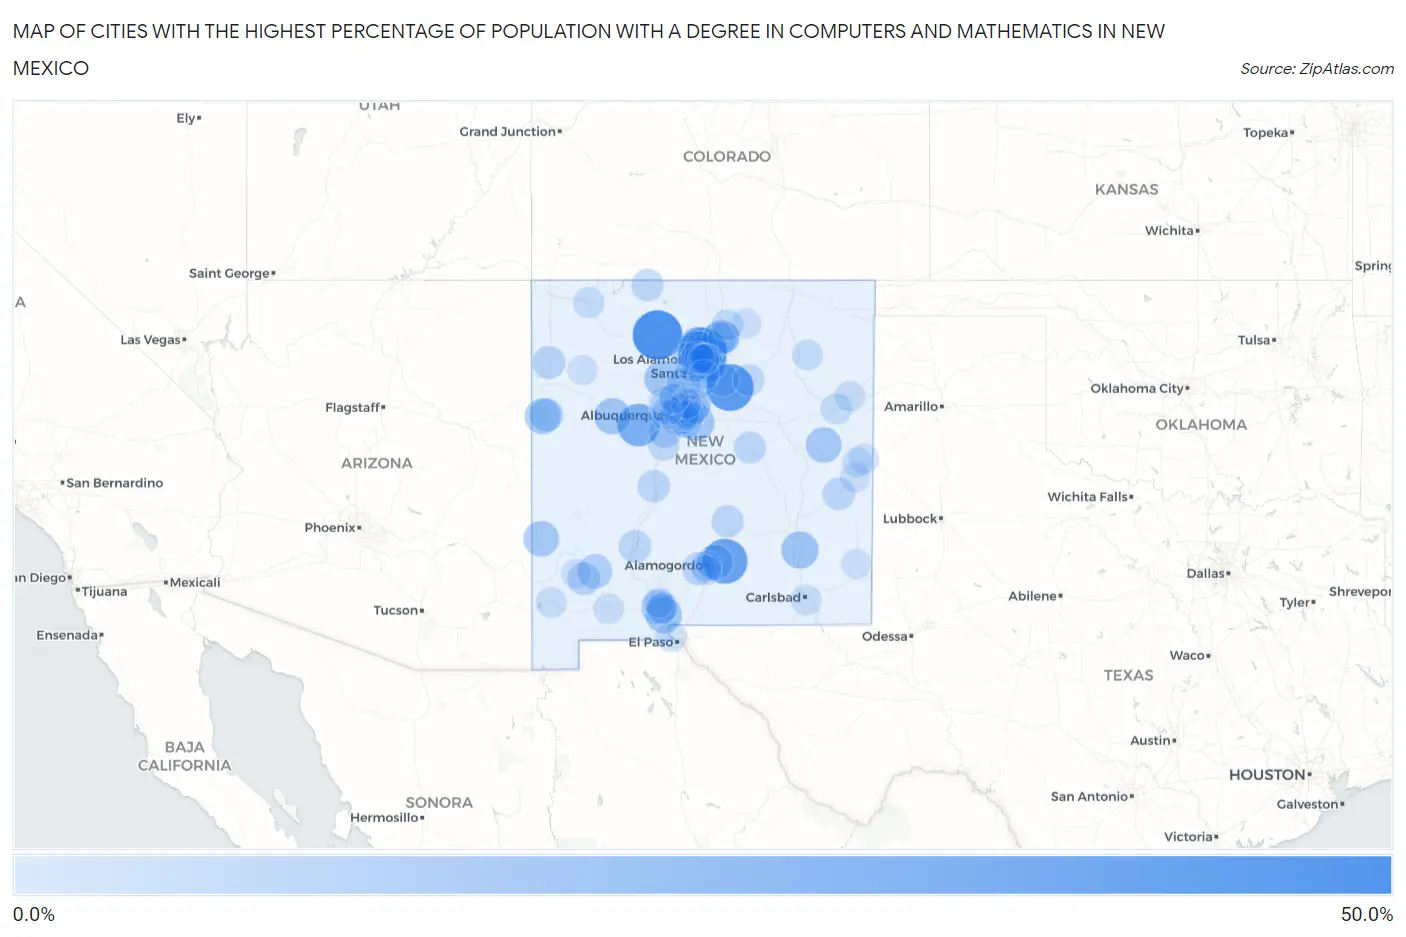
Map of Cities with the Highest Percentage of Population with a Degree in Computers and Mathematics in New Mexico
0.0%
50.0%
Cities with the Highest Percentage of Population with a Degree in Computers and Mathematics in New Mexico
| City | % Graduates | vs State | vs National | |
| 1. | Gallina | 50.0% | 3.7%(+46.3)#1 | 4.9%(+45.1)#104 |
| 2. | Sombrillo | 48.5% | 3.7%(+44.8)#2 | 4.9%(+43.6)#123 |
| 3. | North San Ysidro | 44.3% | 3.7%(+40.6)#3 | 4.9%(+39.4)#140 |
| 4. | Twin Forks | 39.2% | 3.7%(+35.5)#4 | 4.9%(+34.3)#175 |
| 5. | Highland Meadows | 33.0% | 3.7%(+29.3)#5 | 4.9%(+28.1)#257 |
| 6. | Chamita | 24.3% | 3.7%(+20.6)#6 | 4.9%(+19.4)#440 |
| 7. | El Valle De Arroyo Seco | 21.5% | 3.7%(+17.8)#7 | 4.9%(+16.6)#545 |
| 8. | Carnuel | 20.4% | 3.7%(+16.7)#8 | 4.9%(+15.5)#581 |
| 9. | Hagerman | 19.8% | 3.7%(+16.0)#9 | 4.9%(+14.9)#631 |
| 10. | Indian Hills | 18.2% | 3.7%(+14.5)#10 | 4.9%(+13.3)#731 |
| 11. | Jemez Pueblo | 18.1% | 3.7%(+14.4)#11 | 4.9%(+13.2)#740 |
| 12. | Acomita Lake | 17.9% | 3.7%(+14.2)#12 | 4.9%(+13.0)#759 |
| 13. | San Miguel | 17.9% | 3.7%(+14.2)#13 | 4.9%(+13.0)#760 |
| 14. | Canada De Los Alamos | 17.1% | 3.7%(+13.4)#14 | 4.9%(+12.2)#816 |
| 15. | House | 16.7% | 3.7%(+13.0)#15 | 4.9%(+11.8)#874 |
| 16. | La Cienega | 16.5% | 3.7%(+12.8)#16 | 4.9%(+11.6)#883 |
| 17. | Zuni Pueblo | 16.4% | 3.7%(+12.7)#17 | 4.9%(+11.5)#889 |
| 18. | La Mesilla | 16.4% | 3.7%(+12.6)#18 | 4.9%(+11.5)#895 |
| 19. | Pleasanton | 16.3% | 3.7%(+12.6)#19 | 4.9%(+11.4)#901 |
| 20. | Rio Lucio | 15.7% | 3.7%(+12.0)#20 | 4.9%(+10.8)#965 |
| 21. | High Rolls | 15.6% | 3.7%(+11.9)#21 | 4.9%(+10.7)#970 |
| 22. | Mesilla | 15.1% | 3.7%(+11.4)#22 | 4.9%(+10.2)#1,037 |
| 23. | San Lorenzo | 13.6% | 3.7%(+9.85)#23 | 4.9%(+8.67)#1,229 |
| 24. | Santo Domingo Pueblo | 13.5% | 3.7%(+9.81)#24 | 4.9%(+8.62)#1,234 |
| 25. | San Pedro | 13.2% | 3.7%(+9.45)#25 | 4.9%(+8.26)#1,308 |
| 26. | Peak Place | 12.5% | 3.7%(+8.79)#26 | 4.9%(+7.61)#1,433 |
| 27. | White Rock | 12.3% | 3.7%(+8.57)#27 | 4.9%(+7.38)#1,478 |
| 28. | Black Rock | 11.6% | 3.7%(+7.92)#28 | 4.9%(+6.73)#1,617 |
| 29. | Paa-Ko | 11.5% | 3.7%(+7.79)#29 | 4.9%(+6.60)#1,651 |
| 30. | Chupadero | 11.4% | 3.7%(+7.70)#30 | 4.9%(+6.51)#1,671 |
| 31. | Chamisal | 11.1% | 3.7%(+7.40)#31 | 4.9%(+6.22)#1,746 |
| 32. | Sandia Park | 10.7% | 3.7%(+7.03)#32 | 4.9%(+5.84)#1,864 |
| 33. | Tohatchi | 10.4% | 3.7%(+6.71)#33 | 4.9%(+5.52)#1,975 |
| 34. | Hurley | 10.4% | 3.7%(+6.69)#34 | 4.9%(+5.51)#1,984 |
| 35. | Hernandez | 10.4% | 3.7%(+6.68)#35 | 4.9%(+5.50)#1,986 |
| 36. | Angustura | 10.2% | 3.7%(+6.52)#36 | 4.9%(+5.33)#2,045 |
| 37. | Bosque Farms | 10.1% | 3.7%(+6.40)#37 | 4.9%(+5.21)#2,087 |
| 38. | Holloman Afb | 9.8% | 3.7%(+6.12)#38 | 4.9%(+4.93)#2,220 |
| 39. | Pecos | 9.6% | 3.7%(+5.86)#39 | 4.9%(+4.67)#2,334 |
| 40. | Los Alamos | 9.2% | 3.7%(+5.49)#40 | 4.9%(+4.30)#2,520 |
| 41. | Elephant Butte | 9.1% | 3.7%(+5.35)#41 | 4.9%(+4.17)#2,599 |
| 42. | San Antonito Cdp Bernalillo County | 9.0% | 3.7%(+5.26)#42 | 4.9%(+4.07)#2,640 |
| 43. | Dulce | 8.7% | 3.7%(+4.97)#43 | 4.9%(+3.78)#2,803 |
| 44. | Socorro | 8.6% | 3.7%(+4.91)#44 | 4.9%(+3.72)#2,836 |
| 45. | Elida | 8.6% | 3.7%(+4.87)#45 | 4.9%(+3.68)#2,856 |
| 46. | Ohkay Owingeh | 8.2% | 3.7%(+4.49)#46 | 4.9%(+3.30)#3,084 |
| 47. | San Ildefonso Pueblo | 8.2% | 3.7%(+4.48)#47 | 4.9%(+3.29)#3,095 |
| 48. | Capitan | 8.0% | 3.7%(+4.25)#48 | 4.9%(+3.06)#3,250 |
| 49. | Vaughn | 7.7% | 3.7%(+3.99)#49 | 4.9%(+2.80)#3,449 |
| 50. | Las Vegas | 7.1% | 3.7%(+3.35)#50 | 4.9%(+2.17)#3,976 |
| 51. | Ponderosa Pine | 7.0% | 3.7%(+3.28)#51 | 4.9%(+2.09)#4,040 |
| 52. | Vadito | 7.0% | 3.7%(+3.27)#52 | 4.9%(+2.08)#4,055 |
| 53. | Rio Communities | 6.8% | 3.7%(+3.14)#53 | 4.9%(+1.95)#4,180 |
| 54. | University Park | 6.8% | 3.7%(+3.07)#54 | 4.9%(+1.89)#4,234 |
| 55. | Valle Vista | 6.5% | 3.7%(+2.79)#55 | 4.9%(+1.60)#4,562 |
| 56. | Tucumcari | 6.2% | 3.7%(+2.50)#56 | 4.9%(+1.31)#4,896 |
| 57. | Ranchos De Taos | 6.1% | 3.7%(+2.39)#57 | 4.9%(+1.21)#5,019 |
| 58. | Edgewood | 6.0% | 3.7%(+2.31)#58 | 4.9%(+1.13)#5,128 |
| 59. | Sunland Park | 6.0% | 3.7%(+2.26)#59 | 4.9%(+1.07)#5,212 |
| 60. | West Hammond | 6.0% | 3.7%(+2.25)#60 | 4.9%(+1.06)#5,224 |
| 61. | Cuyamungue | 5.6% | 3.7%(+1.93)#61 | 4.9%(+0.740)#5,627 |
| 62. | San Jose Cdp Rio Arriba County | 5.4% | 3.7%(+1.70)#62 | 4.9%(+0.511)#5,985 |
| 63. | Roy | 5.3% | 3.7%(+1.56)#63 | 4.9%(+0.369)#6,230 |
| 64. | Ventura | 5.2% | 3.7%(+1.47)#64 | 4.9%(+0.278)#6,385 |
| 65. | Lordsburg | 5.1% | 3.7%(+1.44)#65 | 4.9%(+0.253)#6,431 |
| 66. | South River | 5.1% | 3.7%(+1.38)#66 | 4.9%(+0.195)#6,525 |
| 67. | Sandia Heights | 5.1% | 3.7%(+1.35)#67 | 4.9%(+0.159)#6,586 |
| 68. | Carlsbad | 5.0% | 3.7%(+1.29)#68 | 4.9%(+0.106)#6,666 |
| 69. | Santa Ana Pueblo | 4.8% | 3.7%(+1.13)#69 | 4.9%(-0.055)#6,989 |
| 70. | Barton | 4.8% | 3.7%(+1.09)#70 | 4.9%(-0.099)#7,073 |
| 71. | Logan | 4.5% | 3.7%(+0.839)#71 | 4.9%(-0.349)#7,575 |
| 72. | Edith Enclave | 4.5% | 3.7%(+0.771)#72 | 4.9%(-0.416)#7,718 |
| 73. | San Pablo | 4.4% | 3.7%(+0.738)#73 | 4.9%(-0.450)#7,782 |
| 74. | Paradise Hills | 4.4% | 3.7%(+0.650)#74 | 4.9%(-0.538)#7,965 |
| 75. | Alamogordo | 4.3% | 3.7%(+0.613)#75 | 4.9%(-0.575)#8,062 |
| 76. | Espanola | 4.3% | 3.7%(+0.594)#76 | 4.9%(-0.594)#8,110 |
| 77. | Pojoaque | 4.3% | 3.7%(+0.576)#77 | 4.9%(-0.612)#8,145 |
| 78. | Tijeras | 4.3% | 3.7%(+0.549)#78 | 4.9%(-0.639)#8,196 |
| 79. | El Rancho | 4.2% | 3.7%(+0.498)#79 | 4.9%(-0.690)#8,310 |
| 80. | Portales | 4.1% | 3.7%(+0.443)#80 | 4.9%(-0.745)#8,434 |
| 81. | Center Point | 4.1% | 3.7%(+0.438)#81 | 4.9%(-0.750)#8,448 |
| 82. | Nambe | 4.1% | 3.7%(+0.390)#82 | 4.9%(-0.798)#8,537 |
| 83. | Albuquerque | 4.1% | 3.7%(+0.349)#83 | 4.9%(-0.839)#8,632 |
| 84. | Clovis | 4.0% | 3.7%(+0.337)#84 | 4.9%(-0.851)#8,656 |
| 85. | Cedar Grove | 4.0% | 3.7%(+0.267)#85 | 4.9%(-0.920)#8,815 |
| 86. | Cannon Afb | 3.9% | 3.7%(+0.193)#86 | 4.9%(-0.995)#8,997 |
| 87. | Las Cruces | 3.9% | 3.7%(+0.184)#87 | 4.9%(-1.00)#9,016 |
| 88. | Placitas Cdp Sandoval County | 3.9% | 3.7%(+0.170)#88 | 4.9%(-1.02)#9,039 |
| 89. | Boles Acres | 3.8% | 3.7%(+0.140)#89 | 4.9%(-1.05)#9,103 |
| 90. | Tano Road | 3.8% | 3.7%(+0.140)#90 | 4.9%(-1.05)#9,106 |
| 91. | Sedillo | 3.8% | 3.7%(+0.124)#91 | 4.9%(-1.06)#9,175 |
| 92. | Lovington | 3.7% | 3.7%(-0.043)#92 | 4.9%(-1.23)#9,552 |
| 93. | Rio Rancho | 3.7% | 3.7%(-0.048)#93 | 4.9%(-1.24)#9,566 |
| 94. | Crownpoint | 3.6% | 3.7%(-0.062)#94 | 4.9%(-1.25)#9,596 |
| 95. | Los Ranchos De Albuquerque | 3.6% | 3.7%(-0.068)#95 | 4.9%(-1.26)#9,608 |
| 96. | Angel Fire | 3.6% | 3.7%(-0.088)#96 | 4.9%(-1.28)#9,659 |
| 97. | Silver City | 3.6% | 3.7%(-0.105)#97 | 4.9%(-1.29)#9,701 |
| 98. | La Madera | 3.6% | 3.7%(-0.124)#98 | 4.9%(-1.31)#9,740 |
| 99. | Bernalillo | 3.4% | 3.7%(-0.283)#99 | 4.9%(-1.47)#10,134 |
| 100. | Agua Fria | 3.3% | 3.7%(-0.417)#100 | 4.9%(-1.60)#10,488 |
Common Questions
What are the Top 10 Cities with the Highest Percentage of Population with a Degree in Computers and Mathematics in New Mexico?
Top 10 Cities with the Highest Percentage of Population with a Degree in Computers and Mathematics in New Mexico are:
#1
50.0%
#2
48.5%
#3
44.3%
#4
39.2%
#5
33.0%
#6
24.3%
#7
21.5%
#8
20.4%
#9
19.8%
#10
18.2%
What city has the Highest Percentage of Population with a Degree in Computers and Mathematics in New Mexico?
Gallina has the Highest Percentage of Population with a Degree in Computers and Mathematics in New Mexico with 50.0%.
What is the Percentage of Population with a Degree in Computers and Mathematics in the State of New Mexico?
Percentage of Population with a Degree in Computers and Mathematics in New Mexico is 3.7%.
What is the Percentage of Population with a Degree in Computers and Mathematics in the United States?
Percentage of Population with a Degree in Computers and Mathematics in the United States is 4.9%.