Winter Gardens, CA Map & Demographics
Winter Gardens Map
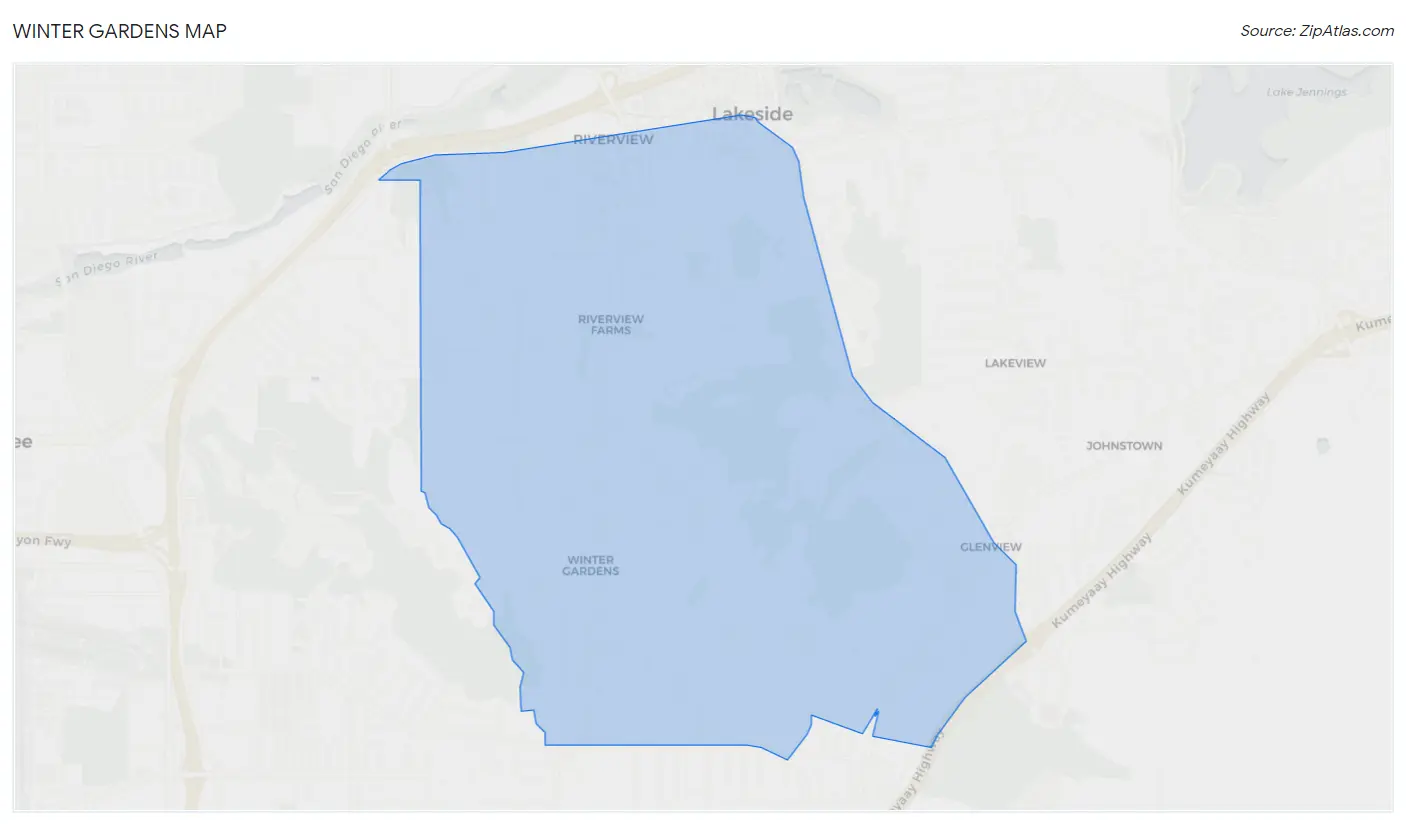
Winter Gardens Overview
$37,612
PER CAPITA INCOME
$98,083
AVG FAMILY INCOME
$86,009
AVG HOUSEHOLD INCOME
28.4%
WAGE / INCOME GAP [ % ]
71.6¢/ $1
WAGE / INCOME GAP [ $ ]
0.40
INEQUALITY / GINI INDEX
21,320
TOTAL POPULATION
10,171
MALE POPULATION
11,149
FEMALE POPULATION
91.23
MALES / 100 FEMALES
109.62
FEMALES / 100 MALES
39.2
MEDIAN AGE
3.3
AVG FAMILY SIZE
2.8
AVG HOUSEHOLD SIZE
10,911
LABOR FORCE [ PEOPLE ]
64.8%
PERCENT IN LABOR FORCE
7.4%
UNEMPLOYMENT RATE
Income in Winter Gardens
Income Overview in Winter Gardens
Per Capita Income in Winter Gardens is $37,612, while median incomes of families and households are $98,083 and $86,009 respectively.
| Characteristic | Number | Measure |
| Per Capita Income | 21,320 | $37,612 |
| Median Family Income | 5,466 | $98,083 |
| Mean Family Income | 5,466 | $114,708 |
| Median Household Income | 7,435 | $86,009 |
| Mean Household Income | 7,435 | $103,312 |
| Income Deficit | 5,466 | $0 |
| Wage / Income Gap (%) | 21,320 | 28.39% |
| Wage / Income Gap ($) | 21,320 | 71.61¢ per $1 |
| Gini / Inequality Index | 21,320 | 0.40 |
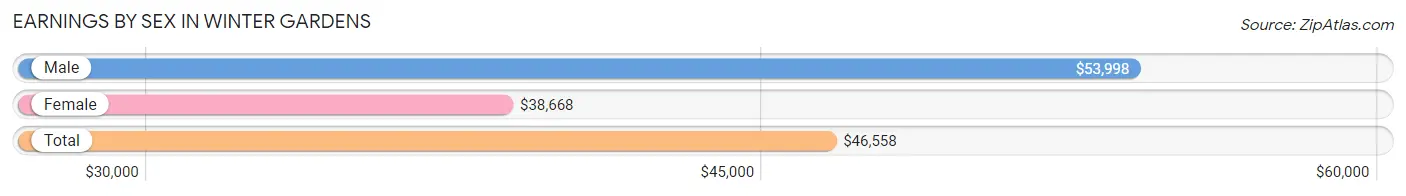
Earnings by Sex in Winter Gardens
Average Earnings in Winter Gardens are $46,558, $53,998 for men and $38,668 for women, a difference of 28.4%.
| Sex | Number | Average Earnings |
| Male | 6,161 (55.8%) | $53,998 |
| Female | 4,884 (44.2%) | $38,668 |
| Total | 11,045 (100.0%) | $46,558 |
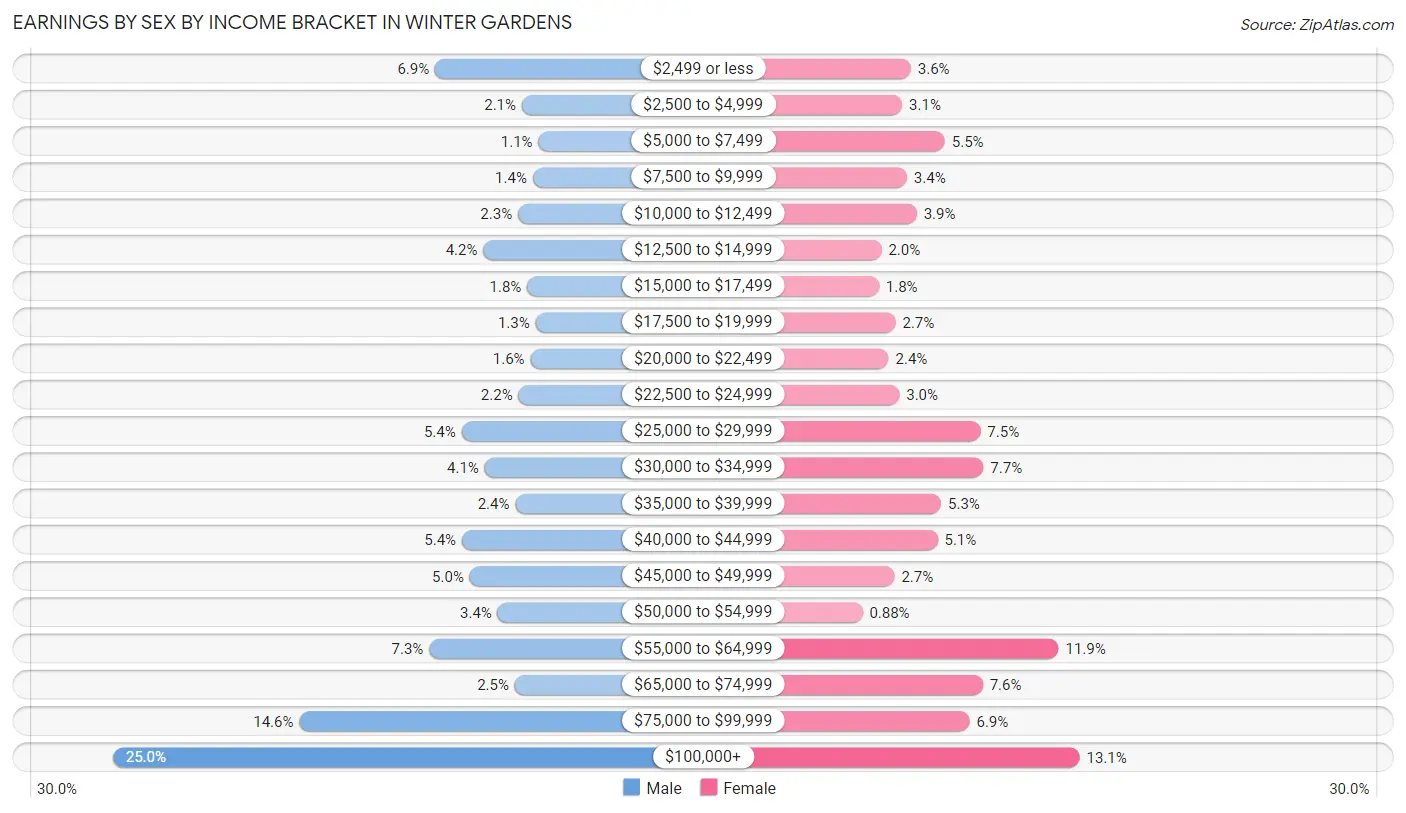
Earnings by Sex by Income Bracket in Winter Gardens
The most common earnings brackets in Winter Gardens are $100,000+ for men (1,543 | 25.0%) and $100,000+ for women (639 | 13.1%).
| Income | Male | Female |
| $2,499 or less | 427 (6.9%) | 176 (3.6%) |
| $2,500 to $4,999 | 126 (2.1%) | 152 (3.1%) |
| $5,000 to $7,499 | 69 (1.1%) | 269 (5.5%) |
| $7,500 to $9,999 | 89 (1.4%) | 165 (3.4%) |
| $10,000 to $12,499 | 140 (2.3%) | 192 (3.9%) |
| $12,500 to $14,999 | 260 (4.2%) | 95 (1.9%) |
| $15,000 to $17,499 | 108 (1.8%) | 88 (1.8%) |
| $17,500 to $19,999 | 79 (1.3%) | 134 (2.7%) |
| $20,000 to $22,499 | 97 (1.6%) | 115 (2.4%) |
| $22,500 to $24,999 | 138 (2.2%) | 144 (2.9%) |
| $25,000 to $29,999 | 335 (5.4%) | 367 (7.5%) |
| $30,000 to $34,999 | 255 (4.1%) | 375 (7.7%) |
| $35,000 to $39,999 | 149 (2.4%) | 259 (5.3%) |
| $40,000 to $44,999 | 334 (5.4%) | 249 (5.1%) |
| $45,000 to $49,999 | 307 (5.0%) | 131 (2.7%) |
| $50,000 to $54,999 | 210 (3.4%) | 43 (0.9%) |
| $55,000 to $64,999 | 447 (7.3%) | 581 (11.9%) |
| $65,000 to $74,999 | 151 (2.5%) | 373 (7.6%) |
| $75,000 to $99,999 | 897 (14.6%) | 337 (6.9%) |
| $100,000+ | 1,543 (25.0%) | 639 (13.1%) |
| Total | 6,161 (100.0%) | 4,884 (100.0%) |
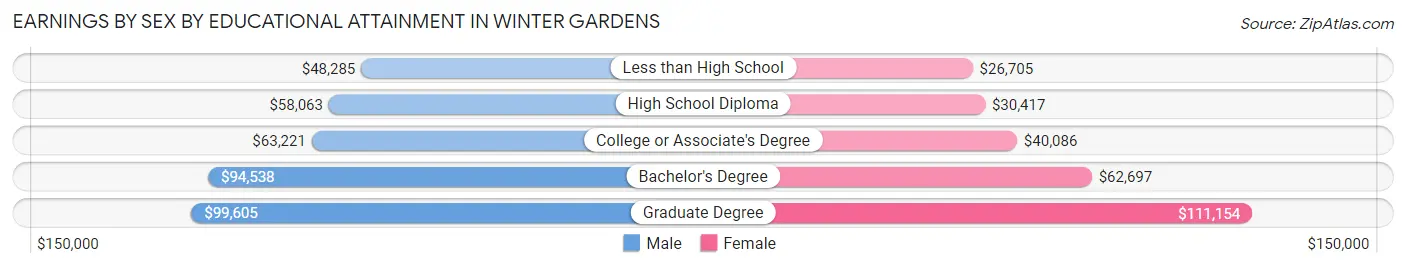
Earnings by Sex by Educational Attainment in Winter Gardens
Average earnings in Winter Gardens are $62,759 for men and $41,809 for women, a difference of 33.4%. Men with an educational attainment of graduate degree enjoy the highest average annual earnings of $99,605, while those with less than high school education earn the least with $48,285. Women with an educational attainment of graduate degree earn the most with the average annual earnings of $111,154, while those with less than high school education have the smallest earnings of $26,705.
| Educational Attainment | Male Income | Female Income |
| Less than High School | $48,285 | $26,705 |
| High School Diploma | $58,063 | $30,417 |
| College or Associate's Degree | $63,221 | $40,086 |
| Bachelor's Degree | $94,538 | $62,697 |
| Graduate Degree | $99,605 | $111,154 |
| Total | $62,759 | $41,809 |
Family Income in Winter Gardens
Family Income Brackets in Winter Gardens
According to the Winter Gardens family income data, there are 1,153 families falling into the $100,000 to $149,999 income range, which is the most common income bracket and makes up 21.1% of all families. Conversely, the $10,000 to $14,999 income bracket is the least frequent group with only 49 families (0.9%) belonging to this category.
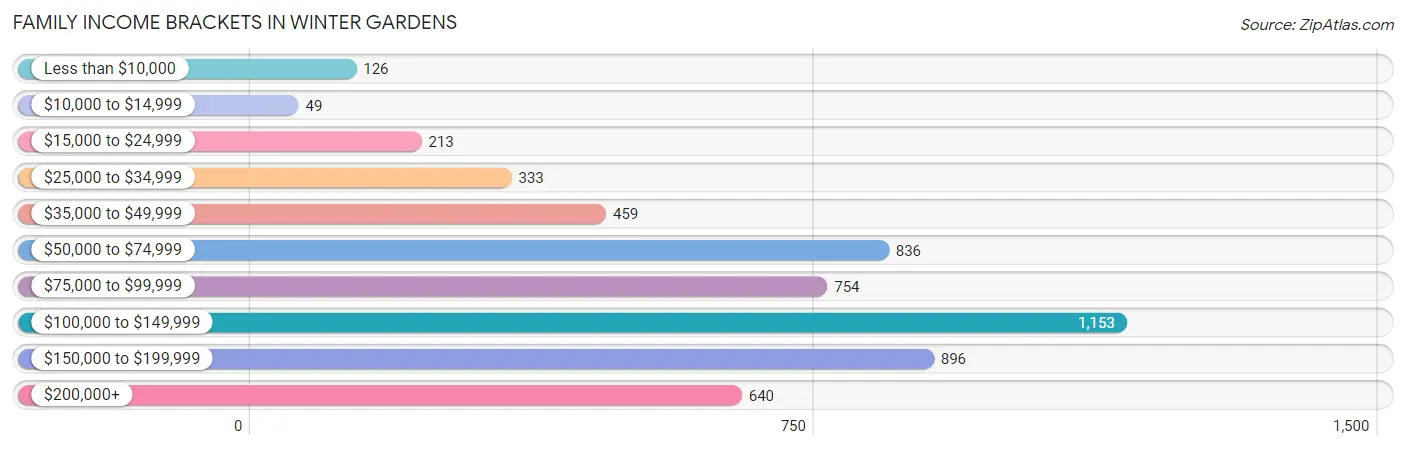
| Income Bracket | # Families | % Families |
| Less than $10,000 | 126 | 2.3% |
| $10,000 to $14,999 | 49 | 0.9% |
| $15,000 to $24,999 | 213 | 3.9% |
| $25,000 to $34,999 | 333 | 6.1% |
| $35,000 to $49,999 | 459 | 8.4% |
| $50,000 to $74,999 | 836 | 15.3% |
| $75,000 to $99,999 | 754 | 13.8% |
| $100,000 to $149,999 | 1,153 | 21.1% |
| $150,000 to $199,999 | 896 | 16.4% |
| $200,000+ | 640 | 11.7% |
Family Income by Famaliy Size in Winter Gardens
4-person families (1,128 | 20.6%) account for the highest median family income in Winter Gardens with $140,625 per family, while 2-person families (2,137 | 39.1%) have the highest median income of $39,306 per family member.
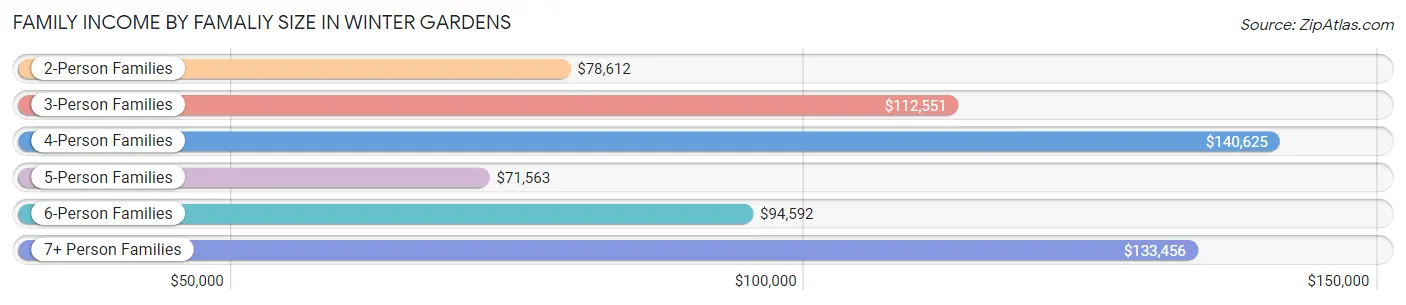
| Income Bracket | # Families | Median Income |
| 2-Person Families | 2,137 (39.1%) | $78,612 |
| 3-Person Families | 1,444 (26.4%) | $112,551 |
| 4-Person Families | 1,128 (20.6%) | $140,625 |
| 5-Person Families | 487 (8.9%) | $71,563 |
| 6-Person Families | 223 (4.1%) | $94,592 |
| 7+ Person Families | 47 (0.9%) | $133,456 |
| Total | 5,466 (100.0%) | $98,083 |
Family Income by Number of Earners in Winter Gardens
The median family income in Winter Gardens is $98,083, with families comprising 3+ earners (532) having the highest median family income of $163,269, while families with no earners (535) have the lowest median family income of $29,031, accounting for 9.7% and 9.8% of families, respectively.
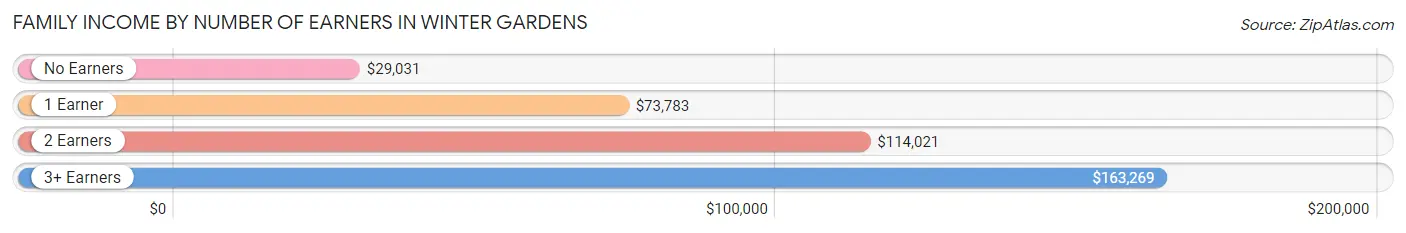
| Number of Earners | # Families | Median Income |
| No Earners | 535 (9.8%) | $29,031 |
| 1 Earner | 1,856 (34.0%) | $73,783 |
| 2 Earners | 2,543 (46.5%) | $114,021 |
| 3+ Earners | 532 (9.7%) | $163,269 |
| Total | 5,466 (100.0%) | $98,083 |
Household Income in Winter Gardens
Household Income Brackets in Winter Gardens
With 1,405 households falling in the category, the $100,000 to $149,999 income range is the most frequent in Winter Gardens, accounting for 18.9% of all households. In contrast, only 119 households (1.6%) fall into the $10,000 to $14,999 income bracket, making it the least populous group.
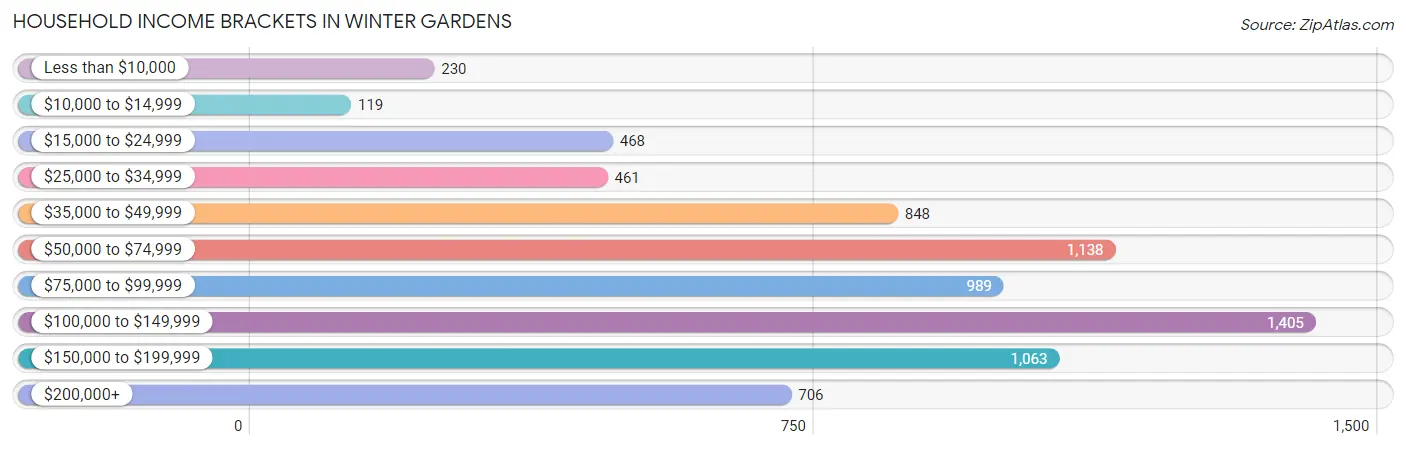
| Income Bracket | # Households | % Households |
| Less than $10,000 | 230 | 3.1% |
| $10,000 to $14,999 | 119 | 1.6% |
| $15,000 to $24,999 | 468 | 6.3% |
| $25,000 to $34,999 | 461 | 6.2% |
| $35,000 to $49,999 | 848 | 11.4% |
| $50,000 to $74,999 | 1,138 | 15.3% |
| $75,000 to $99,999 | 989 | 13.3% |
| $100,000 to $149,999 | 1,405 | 18.9% |
| $150,000 to $199,999 | 1,063 | 14.3% |
| $200,000+ | 706 | 9.5% |
Household Income by Householder Age in Winter Gardens
The median household income in Winter Gardens is $86,009, with the highest median household income of $100,884 found in the 45 to 64 years age bracket for the primary householder. A total of 3,463 households (46.6%) fall into this category. Meanwhile, the 65+ years age bracket for the primary householder has the lowest median household income of $46,202, with 1,521 households (20.5%) in this group.
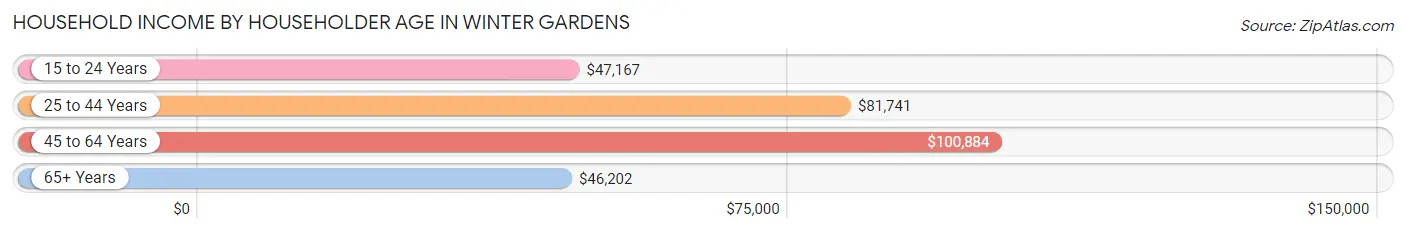
| Income Bracket | # Households | Median Income |
| 15 to 24 Years | 84 (1.1%) | $47,167 |
| 25 to 44 Years | 2,367 (31.8%) | $81,741 |
| 45 to 64 Years | 3,463 (46.6%) | $100,884 |
| 65+ Years | 1,521 (20.5%) | $46,202 |
| Total | 7,435 (100.0%) | $86,009 |
Poverty in Winter Gardens
Income Below Poverty by Sex and Age in Winter Gardens
With 6.9% poverty level for males and 8.5% for females among the residents of Winter Gardens, 12 to 14 year old males and 5 year old females are the most vulnerable to poverty, with 66 males (16.8%) and 37 females (42.5%) in their respective age groups living below the poverty level.
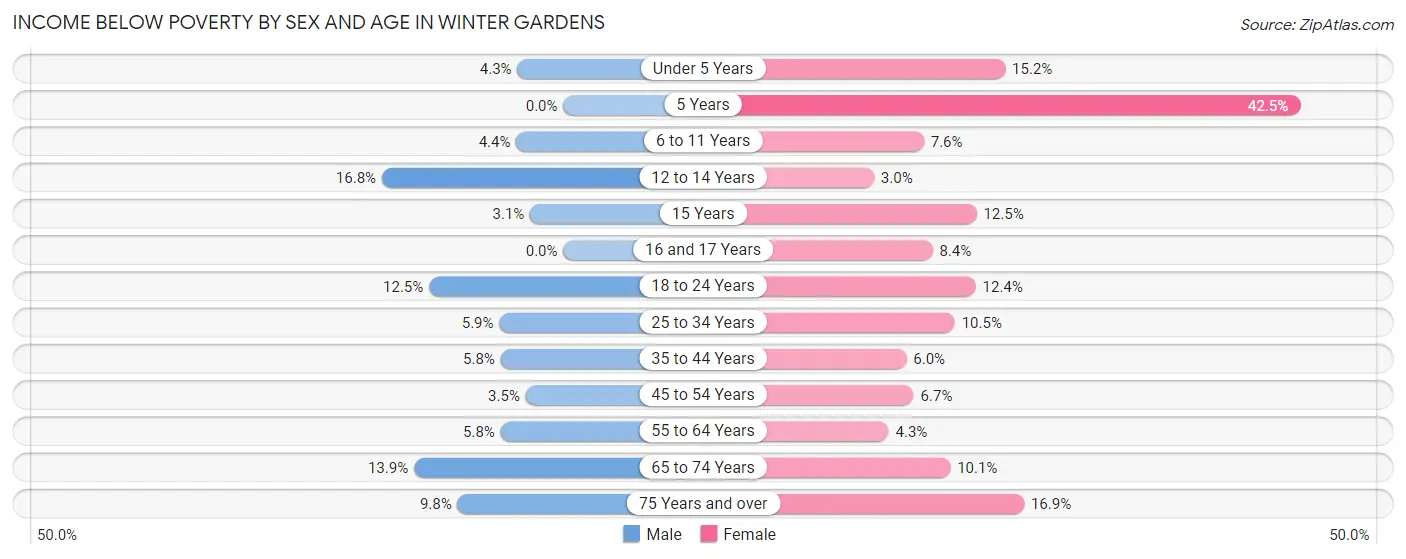
| Age Bracket | Male | Female |
| Under 5 Years | 19 (4.3%) | 92 (15.2%) |
| 5 Years | 0 (0.0%) | 37 (42.5%) |
| 6 to 11 Years | 25 (4.4%) | 87 (7.6%) |
| 12 to 14 Years | 66 (16.8%) | 20 (3.0%) |
| 15 Years | 7 (3.1%) | 24 (12.5%) |
| 16 and 17 Years | 0 (0.0%) | 34 (8.4%) |
| 18 to 24 Years | 118 (12.5%) | 77 (12.4%) |
| 25 to 34 Years | 73 (5.9%) | 132 (10.5%) |
| 35 to 44 Years | 85 (5.8%) | 97 (6.0%) |
| 45 to 54 Years | 46 (3.5%) | 103 (6.7%) |
| 55 to 64 Years | 96 (5.8%) | 66 (4.3%) |
| 65 to 74 Years | 116 (13.9%) | 99 (10.1%) |
| 75 Years and over | 48 (9.8%) | 82 (16.9%) |
| Total | 699 (6.9%) | 950 (8.5%) |
Income Above Poverty by Sex and Age in Winter Gardens
According to the poverty statistics in Winter Gardens, males aged 5 years and females aged 12 to 14 years are the age groups that are most secure financially, with 100.0% of males and 97.0% of females in these age groups living above the poverty line.
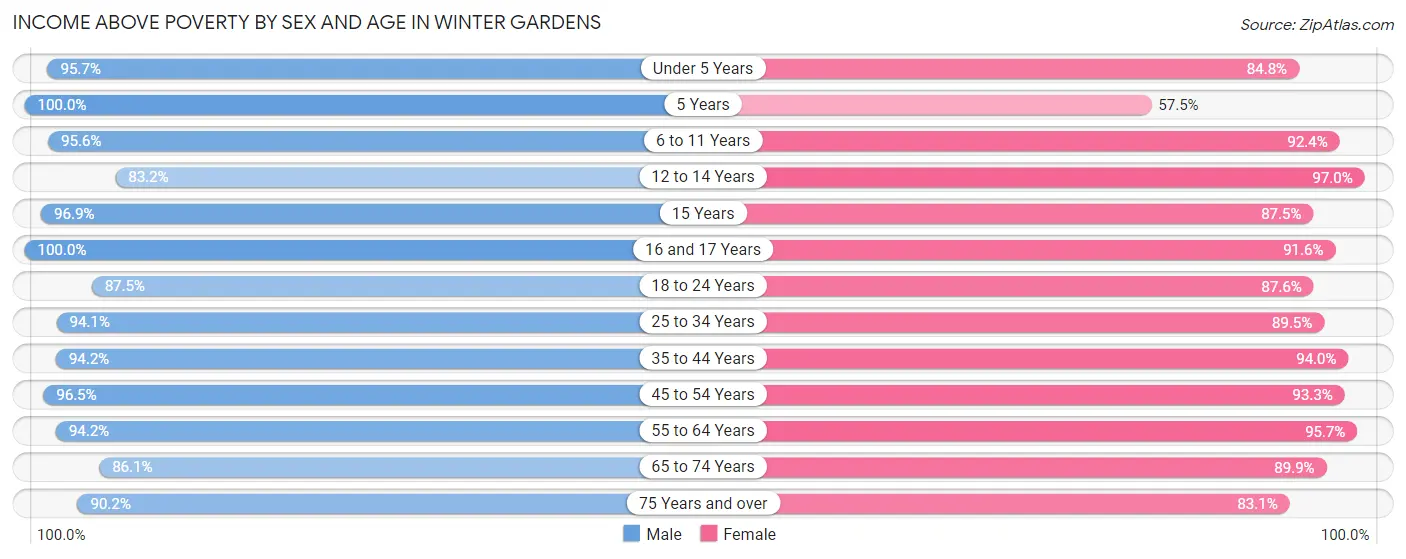
| Age Bracket | Male | Female |
| Under 5 Years | 427 (95.7%) | 515 (84.8%) |
| 5 Years | 125 (100.0%) | 50 (57.5%) |
| 6 to 11 Years | 547 (95.6%) | 1,056 (92.4%) |
| 12 to 14 Years | 326 (83.2%) | 652 (97.0%) |
| 15 Years | 220 (96.9%) | 168 (87.5%) |
| 16 and 17 Years | 450 (100.0%) | 370 (91.6%) |
| 18 to 24 Years | 829 (87.5%) | 543 (87.6%) |
| 25 to 34 Years | 1,155 (94.1%) | 1,127 (89.5%) |
| 35 to 44 Years | 1,376 (94.2%) | 1,523 (94.0%) |
| 45 to 54 Years | 1,272 (96.5%) | 1,441 (93.3%) |
| 55 to 64 Years | 1,554 (94.2%) | 1,453 (95.7%) |
| 65 to 74 Years | 721 (86.1%) | 885 (89.9%) |
| 75 Years and over | 441 (90.2%) | 403 (83.1%) |
| Total | 9,443 (93.1%) | 10,186 (91.5%) |
Income Below Poverty Among Married-Couple Families in Winter Gardens
The poverty statistics for married-couple families in Winter Gardens show that 5.4% or 214 of the total 3,959 families live below the poverty line. Families with 3 or 4 children have the highest poverty rate of 15.2%, comprising of 46 families. On the other hand, families with 1 or 2 children have the lowest poverty rate of 4.4%, which includes 72 families.
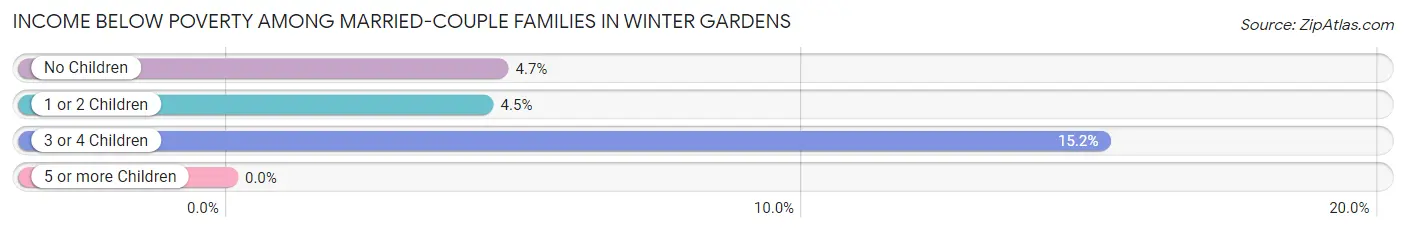
| Children | Above Poverty | Below Poverty |
| No Children | 1,941 (95.3%) | 96 (4.7%) |
| 1 or 2 Children | 1,547 (95.6%) | 72 (4.4%) |
| 3 or 4 Children | 257 (84.8%) | 46 (15.2%) |
| 5 or more Children | 0 (0.0%) | 0 (0.0%) |
| Total | 3,745 (94.6%) | 214 (5.4%) |
Income Below Poverty Among Single-Parent Households in Winter Gardens
According to the poverty data in Winter Gardens, 1.4% or 7 single-father households and 4.8% or 49 single-mother households are living below the poverty line. Among single-father households, those with 1 or 2 children have the highest poverty rate, with 7 households (3.1%) experiencing poverty. Likewise, among single-mother households, those with 1 or 2 children have the highest poverty rate, with 40 households (8.2%) falling below the poverty line.
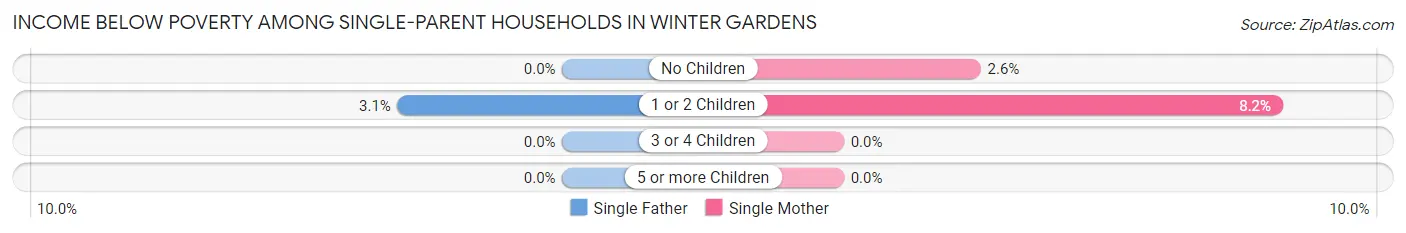
| Children | Single Father | Single Mother |
| No Children | 0 (0.0%) | 9 (2.5%) |
| 1 or 2 Children | 7 (3.1%) | 40 (8.2%) |
| 3 or 4 Children | 0 (0.0%) | 0 (0.0%) |
| 5 or more Children | 0 (0.0%) | 0 (0.0%) |
| Total | 7 (1.4%) | 49 (4.8%) |
Income Below Poverty Among Married-Couple vs Single-Parent Households in Winter Gardens
The poverty data for Winter Gardens shows that 214 of the married-couple family households (5.4%) and 56 of the single-parent households (3.7%) are living below the poverty level. Within the married-couple family households, those with 3 or 4 children have the highest poverty rate, with 46 households (15.2%) falling below the poverty line. Among the single-parent households, those with 1 or 2 children have the highest poverty rate, with 47 household (6.6%) living below poverty.
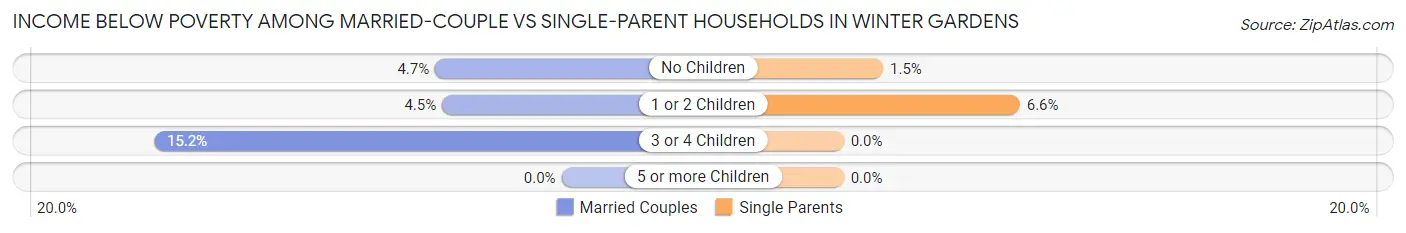
| Children | Married-Couple Families | Single-Parent Households |
| No Children | 96 (4.7%) | 9 (1.5%) |
| 1 or 2 Children | 72 (4.4%) | 47 (6.6%) |
| 3 or 4 Children | 46 (15.2%) | 0 (0.0%) |
| 5 or more Children | 0 (0.0%) | 0 (0.0%) |
| Total | 214 (5.4%) | 56 (3.7%) |
Race in Winter Gardens
The most populous races in Winter Gardens are White / Caucasian (15,737 | 73.8%), Hispanic or Latino (5,950 | 27.9%), and Some other Race (2,922 | 13.7%).
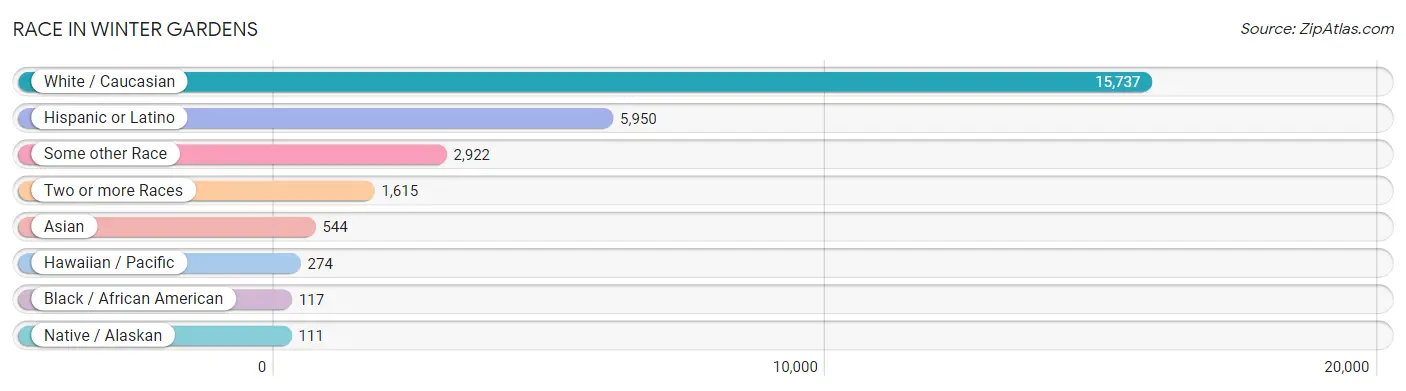
| Race | # Population | % Population |
| Asian | 544 | 2.5% |
| Black / African American | 117 | 0.5% |
| Hawaiian / Pacific | 274 | 1.3% |
| Hispanic or Latino | 5,950 | 27.9% |
| Native / Alaskan | 111 | 0.5% |
| White / Caucasian | 15,737 | 73.8% |
| Two or more Races | 1,615 | 7.6% |
| Some other Race | 2,922 | 13.7% |
| Total | 21,320 | 100.0% |
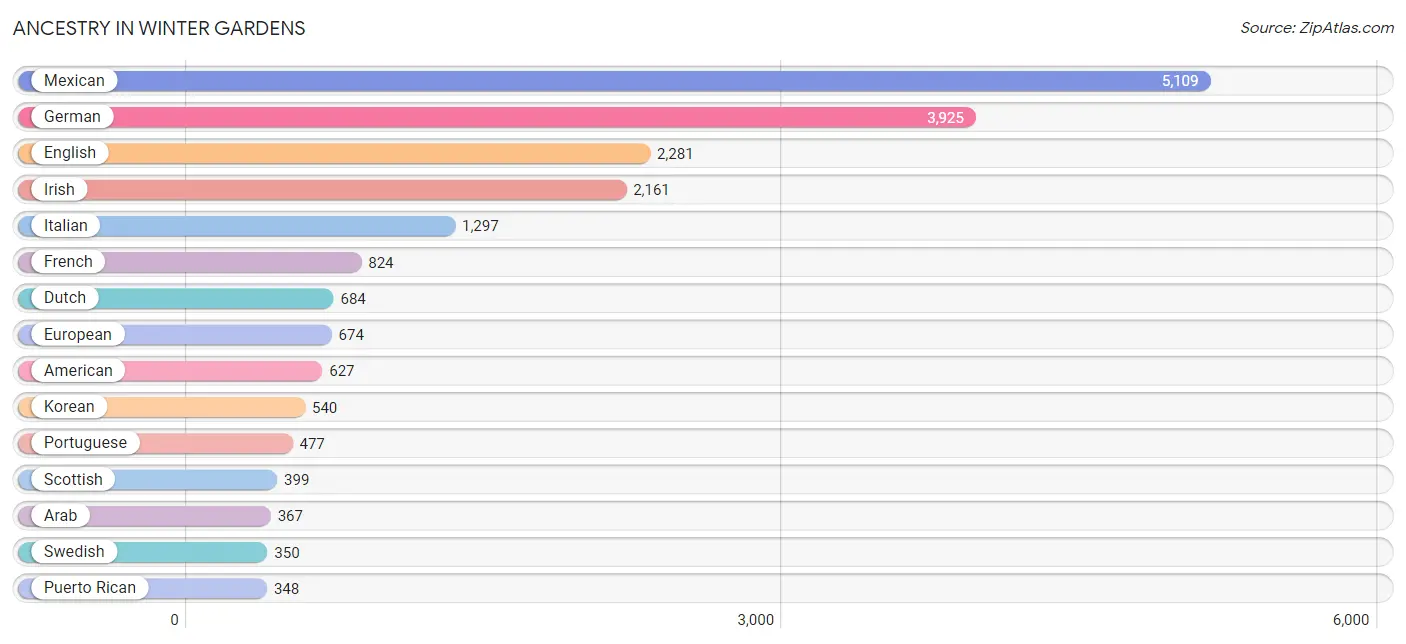
Ancestry in Winter Gardens
The most populous ancestries reported in Winter Gardens are Mexican (5,109 | 24.0%), German (3,925 | 18.4%), English (2,281 | 10.7%), Irish (2,161 | 10.1%), and Italian (1,297 | 6.1%), together accounting for 69.3% of all Winter Gardens residents.
| Ancestry | # Population | % Population |
| African | 8 | 0.0% |
| American | 627 | 2.9% |
| Apache | 15 | 0.1% |
| Arab | 367 | 1.7% |
| Austrian | 34 | 0.2% |
| Bhutanese | 73 | 0.3% |
| British | 248 | 1.2% |
| Bulgarian | 20 | 0.1% |
| Burmese | 50 | 0.2% |
| Canadian | 57 | 0.3% |
| Central American | 135 | 0.6% |
| Central American Indian | 3 | 0.0% |
| Cherokee | 47 | 0.2% |
| Chippewa | 42 | 0.2% |
| Choctaw | 52 | 0.2% |
| Costa Rican | 120 | 0.6% |
| Croatian | 42 | 0.2% |
| Cuban | 13 | 0.1% |
| Czech | 31 | 0.2% |
| Czechoslovakian | 16 | 0.1% |
| Danish | 79 | 0.4% |
| Dominican | 67 | 0.3% |
| Dutch | 684 | 3.2% |
| Dutch West Indian | 10 | 0.1% |
| English | 2,281 | 10.7% |
| European | 674 | 3.2% |
| Finnish | 20 | 0.1% |
| French | 824 | 3.9% |
| French Canadian | 8 | 0.0% |
| German | 3,925 | 18.4% |
| German Russian | 18 | 0.1% |
| Greek | 60 | 0.3% |
| Guamanian / Chamorro | 191 | 0.9% |
| Hungarian | 36 | 0.2% |
| Icelander | 9 | 0.0% |
| Indian (Asian) | 73 | 0.3% |
| Iranian | 80 | 0.4% |
| Iraqi | 289 | 1.4% |
| Irish | 2,161 | 10.1% |
| Italian | 1,297 | 6.1% |
| Korean | 540 | 2.5% |
| Malaysian | 42 | 0.2% |
| Maltese | 30 | 0.1% |
| Mexican | 5,109 | 24.0% |
| Mexican American Indian | 48 | 0.2% |
| Native Hawaiian | 66 | 0.3% |
| Nigerian | 8 | 0.0% |
| Northern European | 89 | 0.4% |
| Norwegian | 251 | 1.2% |
| Pakistani | 13 | 0.1% |
| Panamanian | 12 | 0.1% |
| Polish | 213 | 1.0% |
| Portuguese | 477 | 2.2% |
| Puerto Rican | 348 | 1.6% |
| Romanian | 9 | 0.0% |
| Russian | 128 | 0.6% |
| Salvadoran | 3 | 0.0% |
| Samoan | 111 | 0.5% |
| Scandinavian | 267 | 1.3% |
| Scotch-Irish | 90 | 0.4% |
| Scottish | 399 | 1.9% |
| Sioux | 8 | 0.0% |
| Spaniard | 92 | 0.4% |
| Spanish | 16 | 0.1% |
| Sri Lankan | 59 | 0.3% |
| Subsaharan African | 16 | 0.1% |
| Swedish | 350 | 1.6% |
| Syrian | 3 | 0.0% |
| Thai | 7 | 0.0% |
| Tongan | 6 | 0.0% |
| Ukrainian | 33 | 0.2% |
| Welsh | 87 | 0.4% |
| Yaqui | 70 | 0.3% | View All 73 Rows |
Immigrants in Winter Gardens
The most numerous immigrant groups reported in Winter Gardens came from Latin America (1,596 | 7.5%), Central America (1,553 | 7.3%), Mexico (1,516 | 7.1%), Asia (815 | 3.8%), and Iraq (461 | 2.2%), together accounting for 27.9% of all Winter Gardens residents.
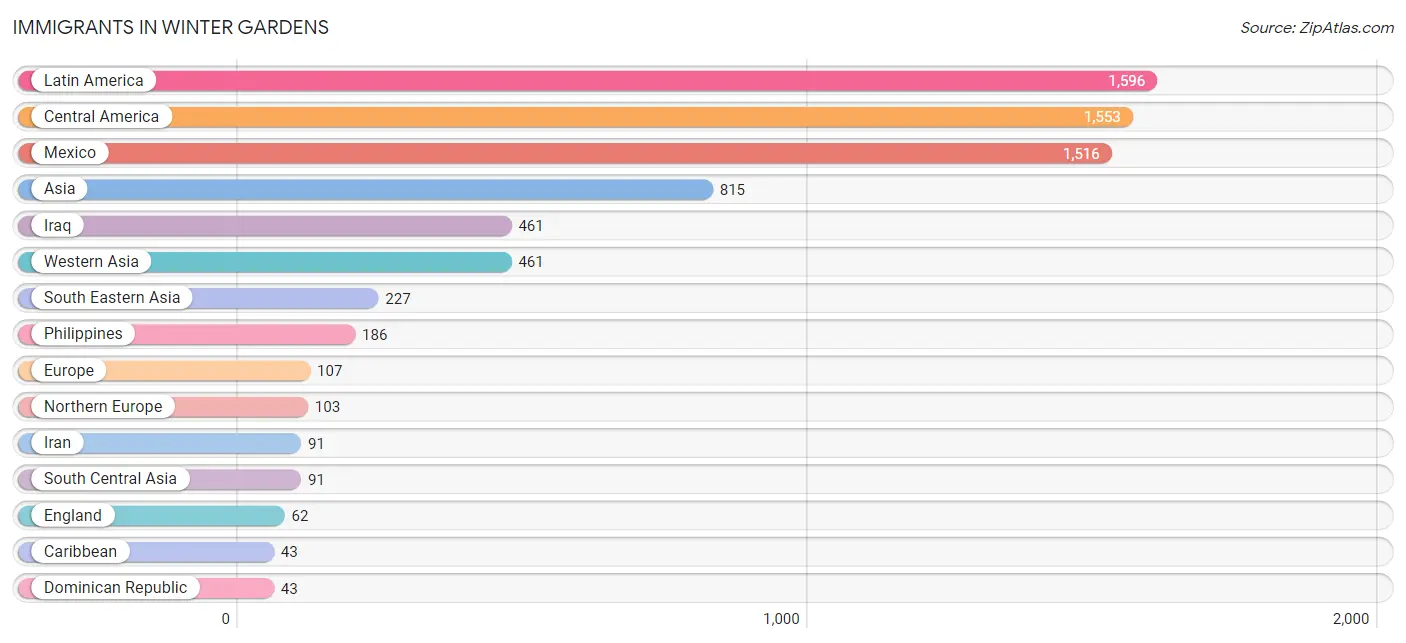
| Immigration Origin | # Population | % Population |
| Africa | 8 | 0.0% |
| Asia | 815 | 3.8% |
| Canada | 24 | 0.1% |
| Caribbean | 43 | 0.2% |
| Central America | 1,553 | 7.3% |
| China | 5 | 0.0% |
| Costa Rica | 34 | 0.2% |
| Dominican Republic | 43 | 0.2% |
| Eastern Asia | 36 | 0.2% |
| Eastern Europe | 4 | 0.0% |
| El Salvador | 3 | 0.0% |
| England | 62 | 0.3% |
| Europe | 107 | 0.5% |
| Hungary | 4 | 0.0% |
| Iran | 91 | 0.4% |
| Iraq | 461 | 2.2% |
| Japan | 16 | 0.1% |
| Korea | 15 | 0.1% |
| Latin America | 1,596 | 7.5% |
| Mexico | 1,516 | 7.1% |
| Nigeria | 8 | 0.0% |
| Northern Europe | 103 | 0.5% |
| Philippines | 186 | 0.9% |
| Scotland | 20 | 0.1% |
| South Central Asia | 91 | 0.4% |
| South Eastern Asia | 227 | 1.1% |
| Thailand | 13 | 0.1% |
| Vietnam | 28 | 0.1% |
| Western Africa | 8 | 0.0% |
| Western Asia | 461 | 2.2% | View All 30 Rows |
Sex and Age in Winter Gardens
Sex and Age in Winter Gardens
The most populous age groups in Winter Gardens are 60 to 64 Years (1,163 | 11.4%) for men and 5 to 9 Years (1,010 | 9.1%) for women.
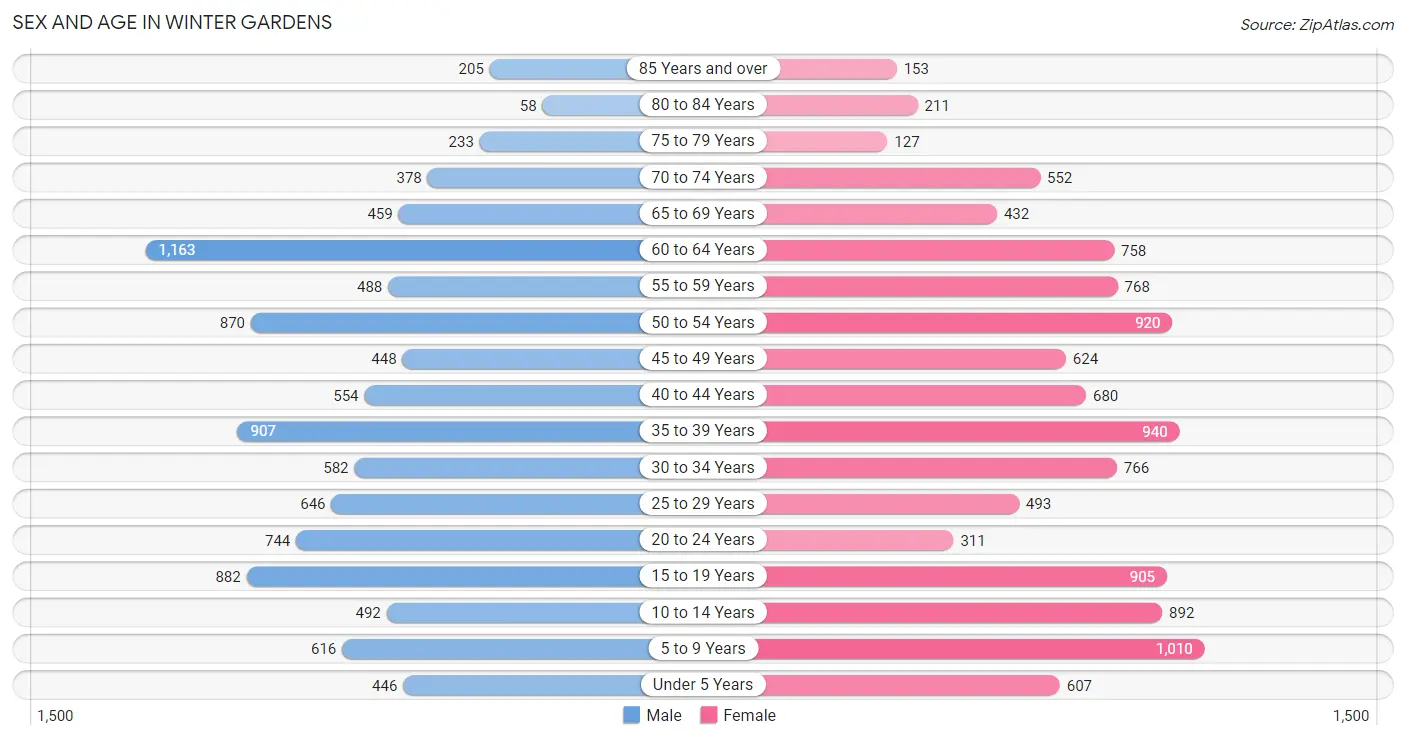
| Age Bracket | Male | Female |
| Under 5 Years | 446 (4.4%) | 607 (5.4%) |
| 5 to 9 Years | 616 (6.1%) | 1,010 (9.1%) |
| 10 to 14 Years | 492 (4.8%) | 892 (8.0%) |
| 15 to 19 Years | 882 (8.7%) | 905 (8.1%) |
| 20 to 24 Years | 744 (7.3%) | 311 (2.8%) |
| 25 to 29 Years | 646 (6.4%) | 493 (4.4%) |
| 30 to 34 Years | 582 (5.7%) | 766 (6.9%) |
| 35 to 39 Years | 907 (8.9%) | 940 (8.4%) |
| 40 to 44 Years | 554 (5.4%) | 680 (6.1%) |
| 45 to 49 Years | 448 (4.4%) | 624 (5.6%) |
| 50 to 54 Years | 870 (8.6%) | 920 (8.3%) |
| 55 to 59 Years | 488 (4.8%) | 768 (6.9%) |
| 60 to 64 Years | 1,163 (11.4%) | 758 (6.8%) |
| 65 to 69 Years | 459 (4.5%) | 432 (3.9%) |
| 70 to 74 Years | 378 (3.7%) | 552 (5.0%) |
| 75 to 79 Years | 233 (2.3%) | 127 (1.1%) |
| 80 to 84 Years | 58 (0.6%) | 211 (1.9%) |
| 85 Years and over | 205 (2.0%) | 153 (1.4%) |
| Total | 10,171 (100.0%) | 11,149 (100.0%) |
Families and Households in Winter Gardens
Median Family Size in Winter Gardens
The median family size in Winter Gardens is 3.31 persons per family, with married-couple families (3,959 | 72.4%) accounting for the largest median family size of 3.37 persons per family. On the other hand, single male/father families (489 | 8.9%) represent the smallest median family size with 3.14 persons per family.
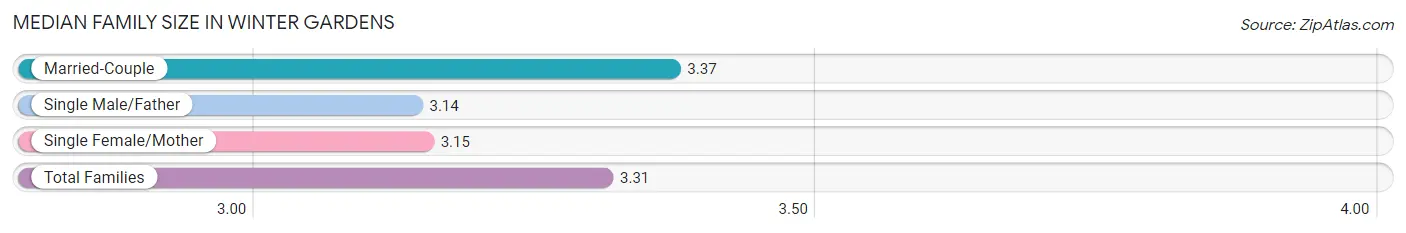
| Family Type | # Families | Family Size |
| Married-Couple | 3,959 (72.4%) | 3.37 |
| Single Male/Father | 489 (8.9%) | 3.14 |
| Single Female/Mother | 1,018 (18.6%) | 3.15 |
| Total Families | 5,466 (100.0%) | 3.31 |
Median Household Size in Winter Gardens
The median household size in Winter Gardens is 2.84 persons per household, with married-couple households (3,959 | 53.2%) accounting for the largest median household size of 3.45 persons per household. non-family households (1,969 | 26.5%) represent the smallest median household size with 1.31 persons per household.
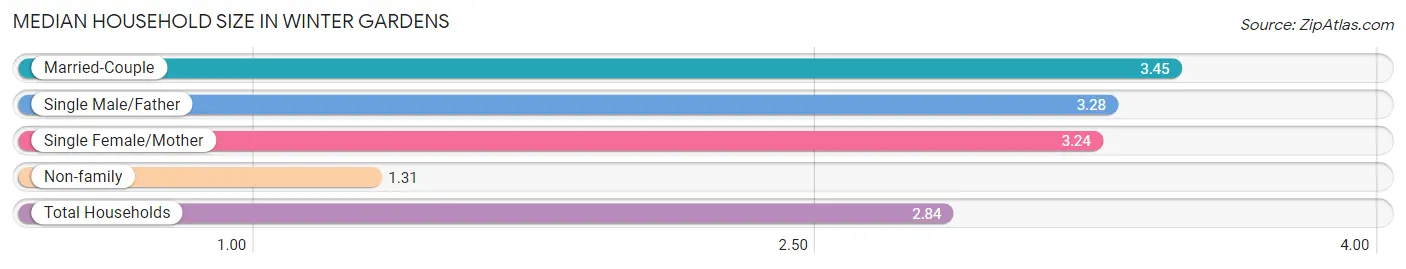
| Household Type | # Households | Household Size |
| Married-Couple | 3,959 (53.2%) | 3.45 |
| Single Male/Father | 489 (6.6%) | 3.28 |
| Single Female/Mother | 1,018 (13.7%) | 3.24 |
| Non-family | 1,969 (26.5%) | 1.31 |
| Total Households | 7,435 (100.0%) | 2.84 |
Household Size by Marriage Status in Winter Gardens
Out of a total of 7,435 households in Winter Gardens, 5,466 (73.5%) are family households, while 1,969 (26.5%) are nonfamily households. The most numerous type of family households are 2-person households, comprising 1,946, and the most common type of nonfamily households are 1-person households, comprising 1,579.
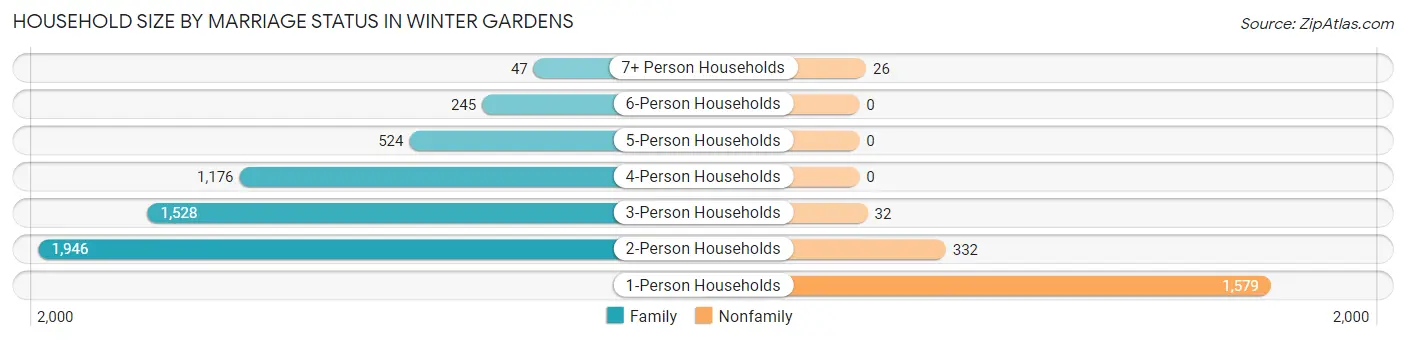
| Household Size | Family Households | Nonfamily Households |
| 1-Person Households | - | 1,579 (21.2%) |
| 2-Person Households | 1,946 (26.2%) | 332 (4.5%) |
| 3-Person Households | 1,528 (20.5%) | 32 (0.4%) |
| 4-Person Households | 1,176 (15.8%) | 0 (0.0%) |
| 5-Person Households | 524 (7.0%) | 0 (0.0%) |
| 6-Person Households | 245 (3.3%) | 0 (0.0%) |
| 7+ Person Households | 47 (0.6%) | 26 (0.4%) |
| Total | 5,466 (73.5%) | 1,969 (26.5%) |
Female Fertility in Winter Gardens
Fertility by Age in Winter Gardens
Average fertility rate in Winter Gardens is 48.0 births per 1,000 women. Women in the age bracket of 20 to 34 years have the highest fertility rate with 121.0 births per 1,000 women. Women in the age bracket of 20 to 34 years acount for 77.2% of all women with births.
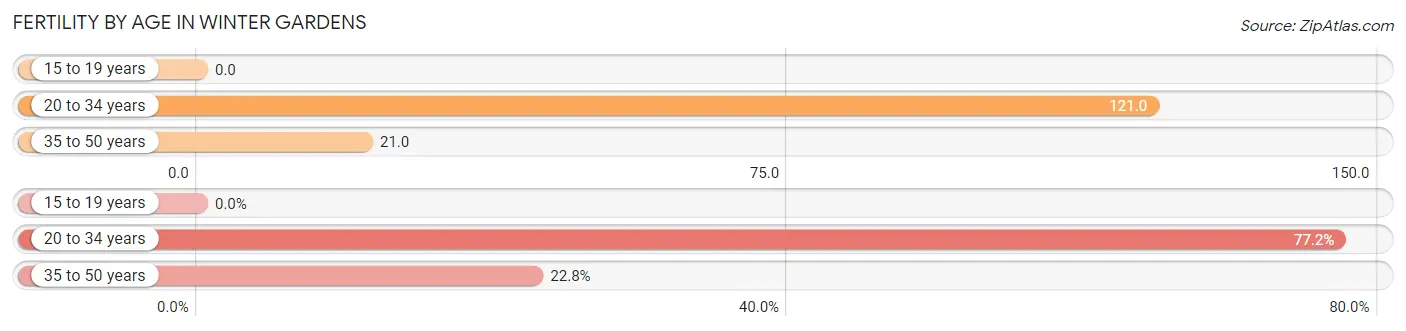
| Age Bracket | Women with Births | Births / 1,000 Women |
| 15 to 19 years | 0 (0.0%) | 0.0 |
| 20 to 34 years | 190 (77.2%) | 121.0 |
| 35 to 50 years | 56 (22.8%) | 21.0 |
| Total | 246 (100.0%) | 48.0 |
Fertility by Age by Marriage Status in Winter Gardens
80.5% of women with births (246) in Winter Gardens are married. The highest percentage of unmarried women with births falls into 35 to 50 years age bracket with 48.2% of them unmarried at the time of birth, while the lowest percentage of unmarried women with births belong to 20 to 34 years age bracket with 11.1% of them unmarried.
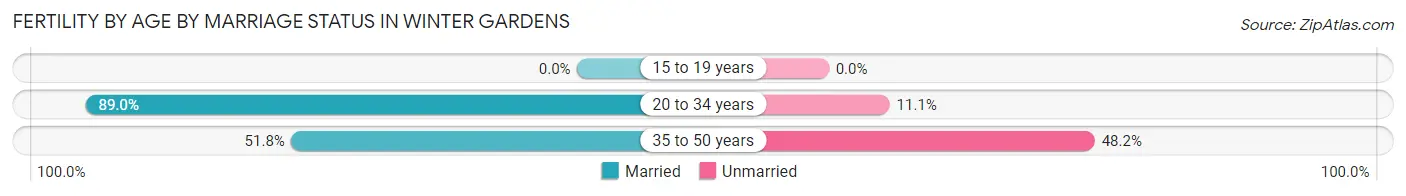
| Age Bracket | Married | Unmarried |
| 15 to 19 years | 0 (0.0%) | 0 (0.0%) |
| 20 to 34 years | 169 (88.9%) | 21 (11.1%) |
| 35 to 50 years | 29 (51.8%) | 27 (48.2%) |
| Total | 198 (80.5%) | 48 (19.5%) |
Fertility by Education in Winter Gardens
Average fertility rate in Winter Gardens is 48.0 births per 1,000 women. Women with the education attainment of high school diploma have the highest fertility rate of 99.0 births per 1,000 women, while women with the education attainment of less than high school have the lowest fertility at 12.0 births per 1,000 women. Women with the education attainment of high school diploma represent 44.7% of all women with births.
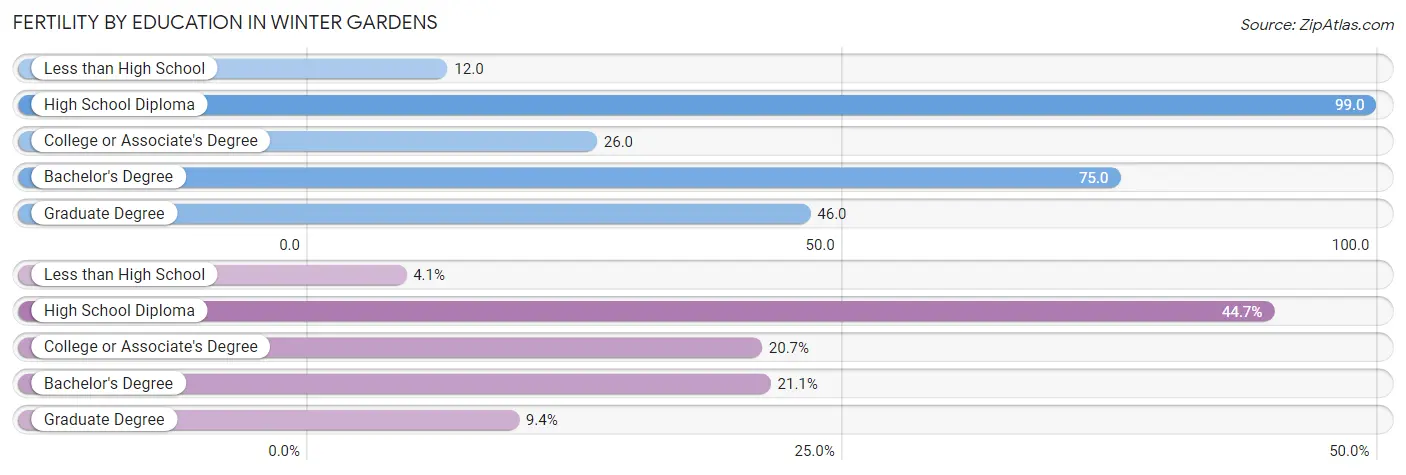
| Educational Attainment | Women with Births | Births / 1,000 Women |
| Less than High School | 10 (4.1%) | 12.0 |
| High School Diploma | 110 (44.7%) | 99.0 |
| College or Associate's Degree | 51 (20.7%) | 26.0 |
| Bachelor's Degree | 52 (21.1%) | 75.0 |
| Graduate Degree | 23 (9.3%) | 46.0 |
| Total | 246 (100.0%) | 48.0 |
Fertility by Education by Marriage Status in Winter Gardens
19.5% of women with births in Winter Gardens are unmarried. Women with the educational attainment of less than high school are most likely to be married with 100.0% of them married at childbirth, while women with the educational attainment of high school diploma are least likely to be married with 33.6% of them unmarried at childbirth.
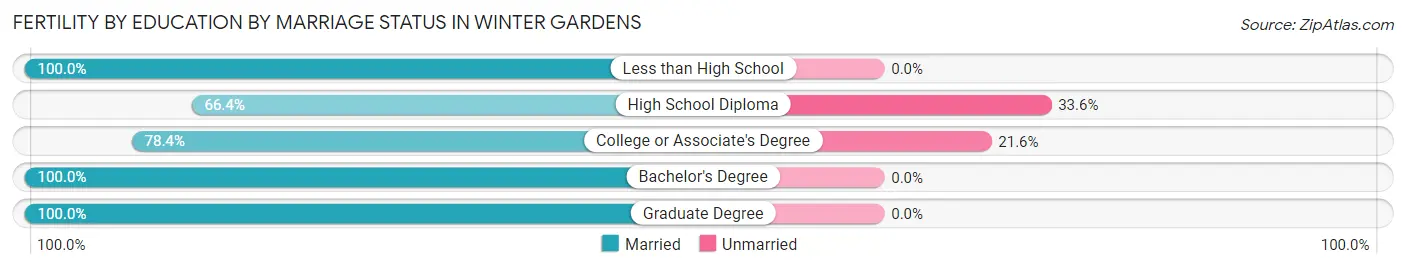
| Educational Attainment | Married | Unmarried |
| Less than High School | 10 (100.0%) | 0 (0.0%) |
| High School Diploma | 73 (66.4%) | 37 (33.6%) |
| College or Associate's Degree | 40 (78.4%) | 11 (21.6%) |
| Bachelor's Degree | 52 (100.0%) | 0 (0.0%) |
| Graduate Degree | 23 (100.0%) | 0 (0.0%) |
| Total | 198 (80.5%) | 48 (19.5%) |
Employment Characteristics in Winter Gardens
Employment by Class of Employer in Winter Gardens
Among the 9,877 employed individuals in Winter Gardens, private company employees (6,496 | 65.8%), local government employees (919 | 9.3%), and self-employed (not incorporated) (747 | 7.6%) make up the most common classes of employment.
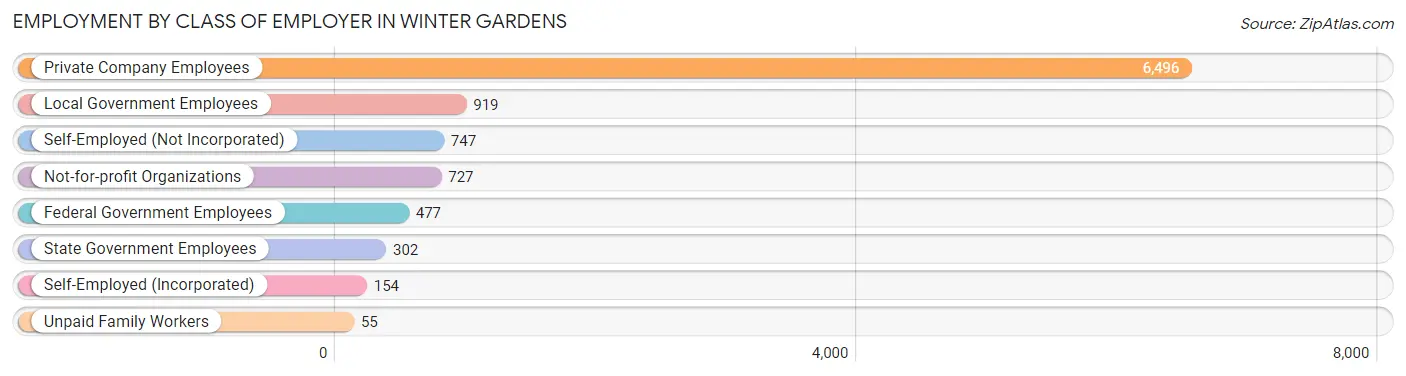
| Employer Class | # Employees | % Employees |
| Private Company Employees | 6,496 | 65.8% |
| Self-Employed (Incorporated) | 154 | 1.6% |
| Self-Employed (Not Incorporated) | 747 | 7.6% |
| Not-for-profit Organizations | 727 | 7.4% |
| Local Government Employees | 919 | 9.3% |
| State Government Employees | 302 | 3.1% |
| Federal Government Employees | 477 | 4.8% |
| Unpaid Family Workers | 55 | 0.6% |
| Total | 9,877 | 100.0% |
Employment Status by Age in Winter Gardens
According to the labor force statistics for Winter Gardens, out of the total population over 16 years of age (16,838), 64.8% or 10,911 individuals are in the labor force, with 7.4% or 807 of them unemployed. The age group with the highest labor force participation rate is 20 to 24 years, with 93.3% or 984 individuals in the labor force. Within the labor force, the 20 to 24 years age range has the highest percentage of unemployed individuals, with 21.0% or 207 of them being unemployed.
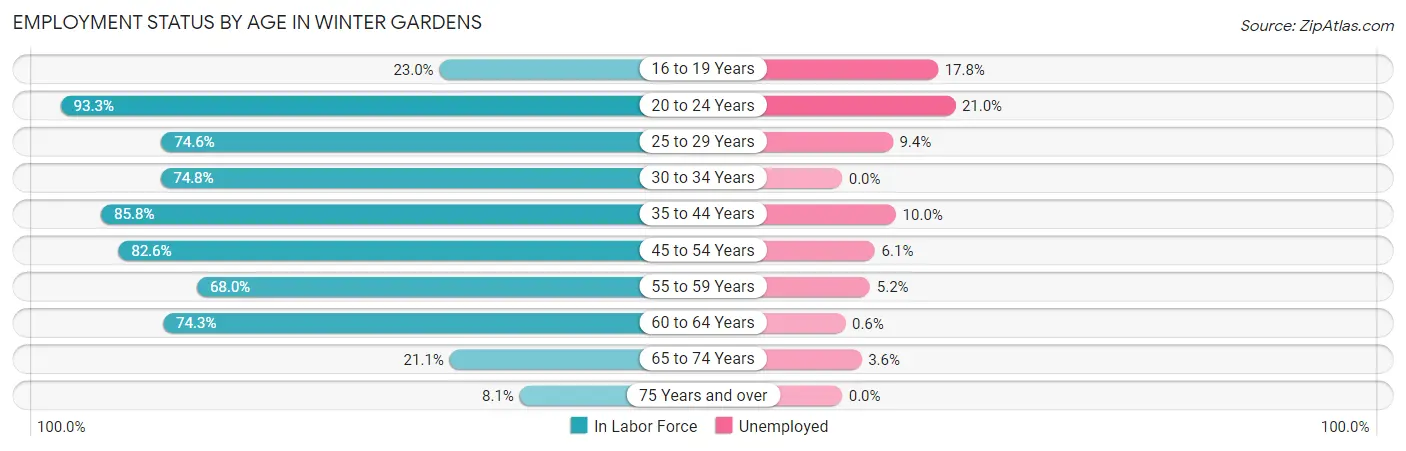
| Age Bracket | In Labor Force | Unemployed |
| 16 to 19 Years | 315 (23.0%) | 56 (17.8%) |
| 20 to 24 Years | 984 (93.3%) | 207 (21.0%) |
| 25 to 29 Years | 850 (74.6%) | 80 (9.4%) |
| 30 to 34 Years | 1,008 (74.8%) | 0 (0.0%) |
| 35 to 44 Years | 2,643 (85.8%) | 264 (10.0%) |
| 45 to 54 Years | 2,364 (82.6%) | 144 (6.1%) |
| 55 to 59 Years | 854 (68.0%) | 44 (5.2%) |
| 60 to 64 Years | 1,427 (74.3%) | 9 (0.6%) |
| 65 to 74 Years | 384 (21.1%) | 14 (3.6%) |
| 75 Years and over | 80 (8.1%) | 0 (0.0%) |
| Total | 10,911 (64.8%) | 807 (7.4%) |
Employment Status by Educational Attainment in Winter Gardens
According to labor force statistics for Winter Gardens, 78.8% of individuals (9,146) out of the total population between 25 and 64 years of age (11,607) are in the labor force, with 5.9% or 540 of them being unemployed. The group with the highest labor force participation rate are those with the educational attainment of bachelor's degree or higher, with 92.9% or 2,163 individuals in the labor force. Within the labor force, individuals with high school diploma education have the highest percentage of unemployment, with 12.3% or 315 of them being unemployed.
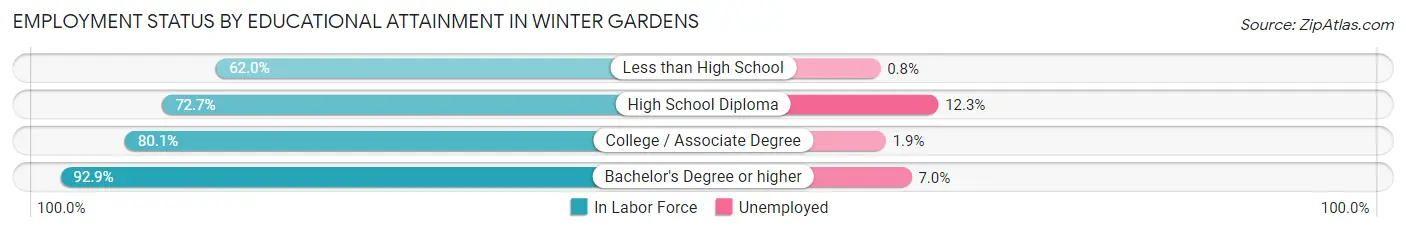
| Educational Attainment | In Labor Force | Unemployed |
| Less than High School | 648 (62.0%) | 8 (0.8%) |
| High School Diploma | 2,558 (72.7%) | 433 (12.3%) |
| College / Associate Degree | 3,778 (80.1%) | 90 (1.9%) |
| Bachelor's Degree or higher | 2,163 (92.9%) | 163 (7.0%) |
| Total | 9,146 (78.8%) | 685 (5.9%) |
Employment Occupations by Sex in Winter Gardens
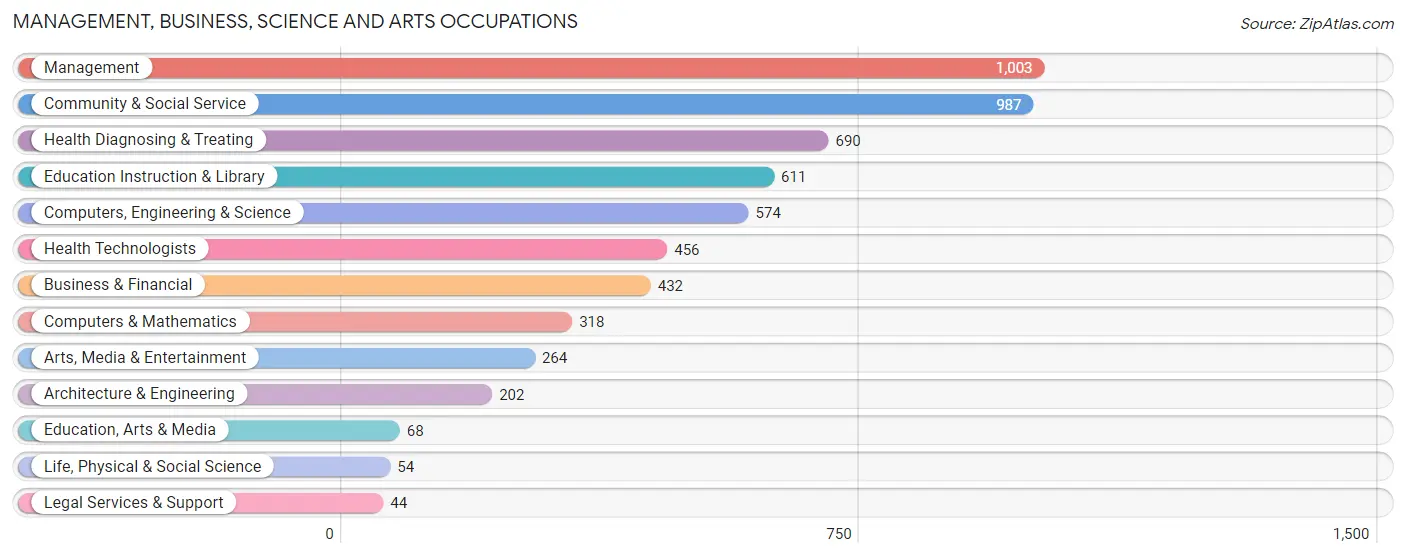
Management, Business, Science and Arts Occupations
The most common Management, Business, Science and Arts occupations in Winter Gardens are Management (1,003 | 10.1%), Community & Social Service (987 | 9.9%), Health Diagnosing & Treating (690 | 6.9%), Education Instruction & Library (611 | 6.1%), and Computers, Engineering & Science (574 | 5.8%).
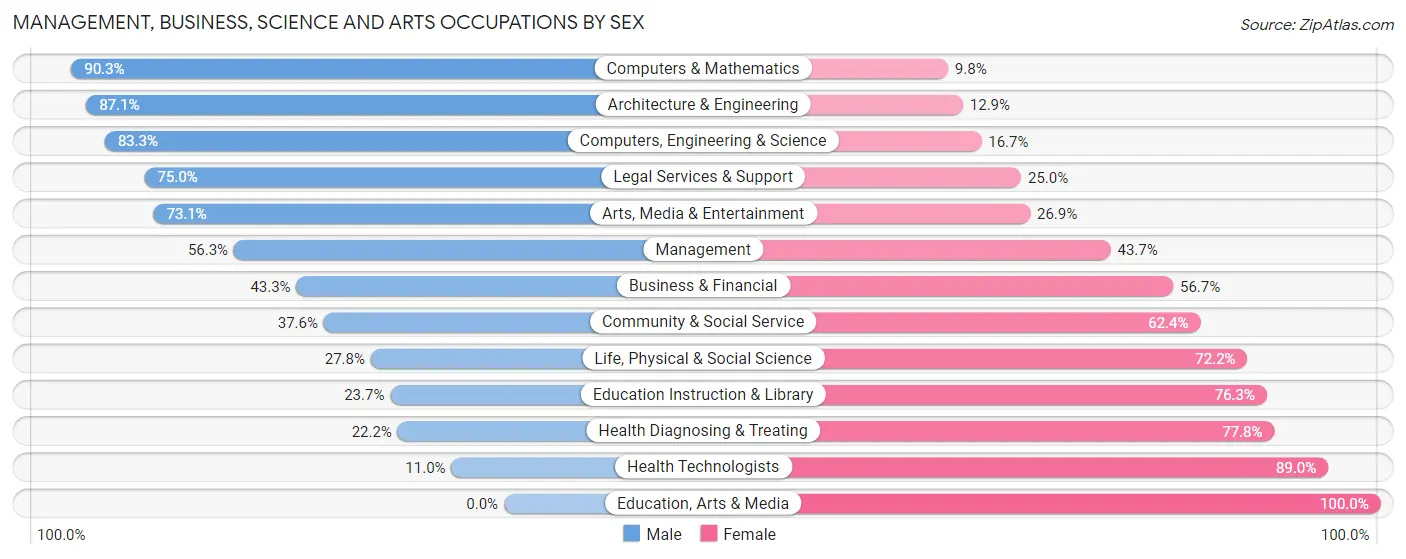
Management, Business, Science and Arts Occupations by Sex
Within the Management, Business, Science and Arts occupations in Winter Gardens, the most male-oriented occupations are Computers & Mathematics (90.2%), Architecture & Engineering (87.1%), and Computers, Engineering & Science (83.3%), while the most female-oriented occupations are Education, Arts & Media (100.0%), Health Technologists (89.0%), and Health Diagnosing & Treating (77.8%).
| Occupation | Male | Female |
| Management | 565 (56.3%) | 438 (43.7%) |
| Business & Financial | 187 (43.3%) | 245 (56.7%) |
| Computers, Engineering & Science | 478 (83.3%) | 96 (16.7%) |
| Computers & Mathematics | 287 (90.2%) | 31 (9.8%) |
| Architecture & Engineering | 176 (87.1%) | 26 (12.9%) |
| Life, Physical & Social Science | 15 (27.8%) | 39 (72.2%) |
| Community & Social Service | 371 (37.6%) | 616 (62.4%) |
| Education, Arts & Media | 0 (0.0%) | 68 (100.0%) |
| Legal Services & Support | 33 (75.0%) | 11 (25.0%) |
| Education Instruction & Library | 145 (23.7%) | 466 (76.3%) |
| Arts, Media & Entertainment | 193 (73.1%) | 71 (26.9%) |
| Health Diagnosing & Treating | 153 (22.2%) | 537 (77.8%) |
| Health Technologists | 50 (11.0%) | 406 (89.0%) |
| Total (Category) | 1,754 (47.6%) | 1,932 (52.4%) |
| Total (Overall) | 5,401 (54.2%) | 4,558 (45.8%) |
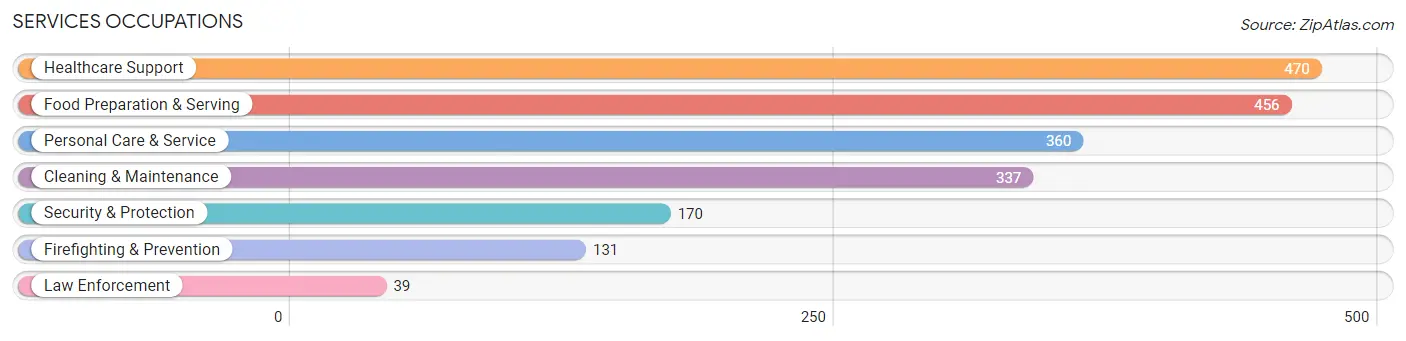
Services Occupations
The most common Services occupations in Winter Gardens are Healthcare Support (470 | 4.7%), Food Preparation & Serving (456 | 4.6%), Personal Care & Service (360 | 3.6%), Cleaning & Maintenance (337 | 3.4%), and Security & Protection (170 | 1.7%).
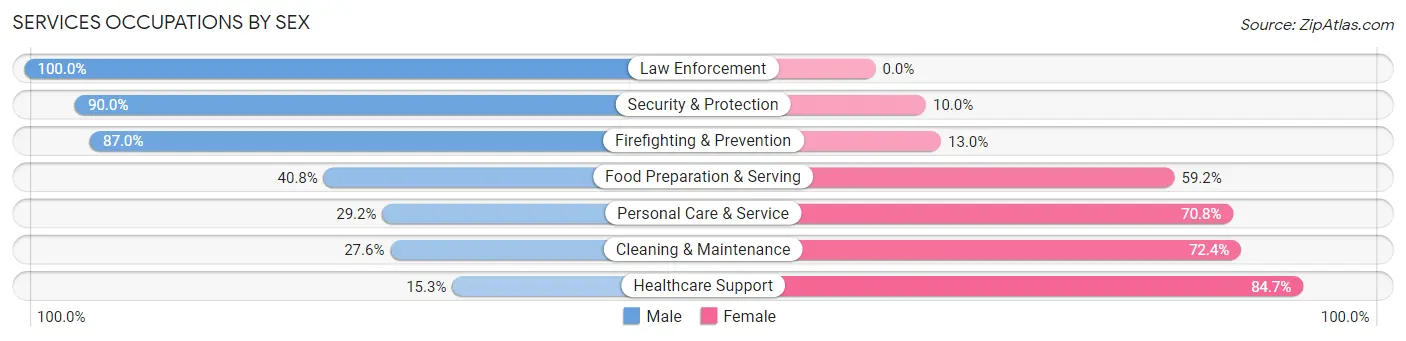
Services Occupations by Sex
Within the Services occupations in Winter Gardens, the most male-oriented occupations are Law Enforcement (100.0%), Security & Protection (90.0%), and Firefighting & Prevention (87.0%), while the most female-oriented occupations are Healthcare Support (84.7%), Cleaning & Maintenance (72.4%), and Personal Care & Service (70.8%).
| Occupation | Male | Female |
| Healthcare Support | 72 (15.3%) | 398 (84.7%) |
| Security & Protection | 153 (90.0%) | 17 (10.0%) |
| Firefighting & Prevention | 114 (87.0%) | 17 (13.0%) |
| Law Enforcement | 39 (100.0%) | 0 (0.0%) |
| Food Preparation & Serving | 186 (40.8%) | 270 (59.2%) |
| Cleaning & Maintenance | 93 (27.6%) | 244 (72.4%) |
| Personal Care & Service | 105 (29.2%) | 255 (70.8%) |
| Total (Category) | 609 (34.0%) | 1,184 (66.0%) |
| Total (Overall) | 5,401 (54.2%) | 4,558 (45.8%) |
Sales and Office Occupations
The most common Sales and Office occupations in Winter Gardens are Office & Administration (951 | 9.6%), and Sales & Related (830 | 8.3%).
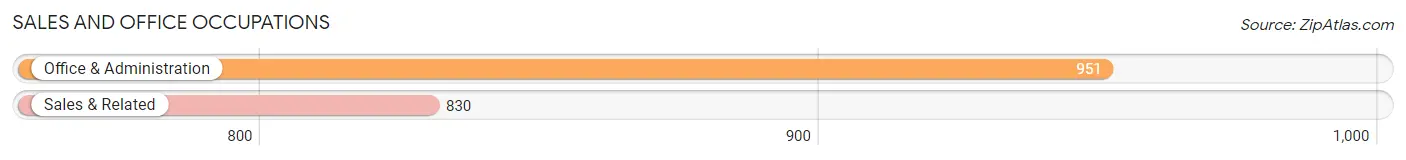
Sales and Office Occupations by Sex
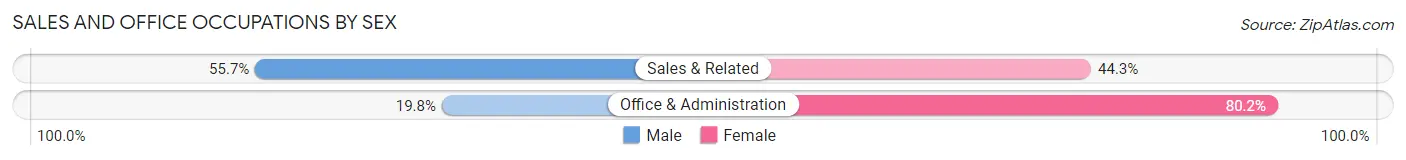
| Occupation | Male | Female |
| Sales & Related | 462 (55.7%) | 368 (44.3%) |
| Office & Administration | 188 (19.8%) | 763 (80.2%) |
| Total (Category) | 650 (36.5%) | 1,131 (63.5%) |
| Total (Overall) | 5,401 (54.2%) | 4,558 (45.8%) |
Natural Resources, Construction and Maintenance Occupations
The most common Natural Resources, Construction and Maintenance occupations in Winter Gardens are Construction & Extraction (853 | 8.6%), Installation, Maintenance & Repair (356 | 3.6%), and Farming, Fishing & Forestry (44 | 0.4%).
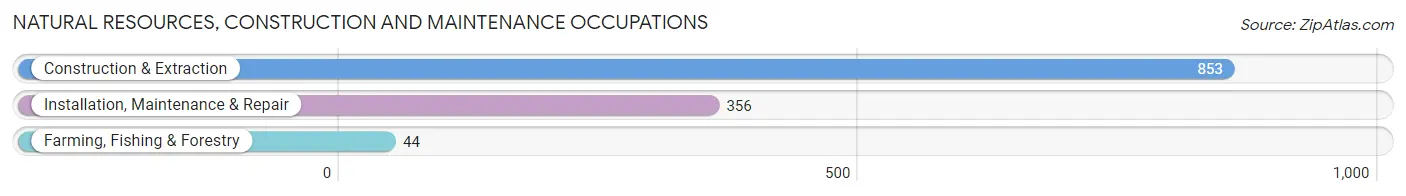
Natural Resources, Construction and Maintenance Occupations by Sex
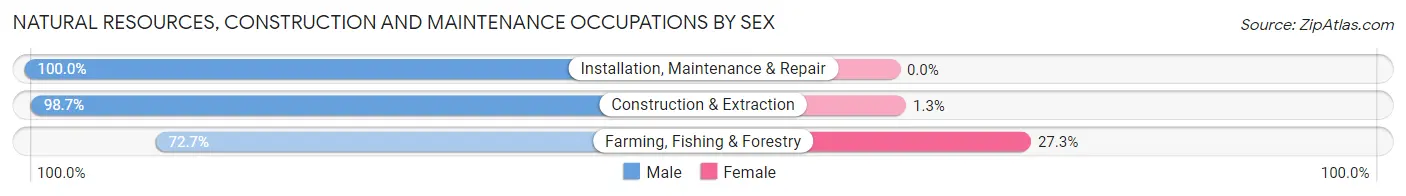
| Occupation | Male | Female |
| Farming, Fishing & Forestry | 32 (72.7%) | 12 (27.3%) |
| Construction & Extraction | 842 (98.7%) | 11 (1.3%) |
| Installation, Maintenance & Repair | 356 (100.0%) | 0 (0.0%) |
| Total (Category) | 1,230 (98.2%) | 23 (1.8%) |
| Total (Overall) | 5,401 (54.2%) | 4,558 (45.8%) |
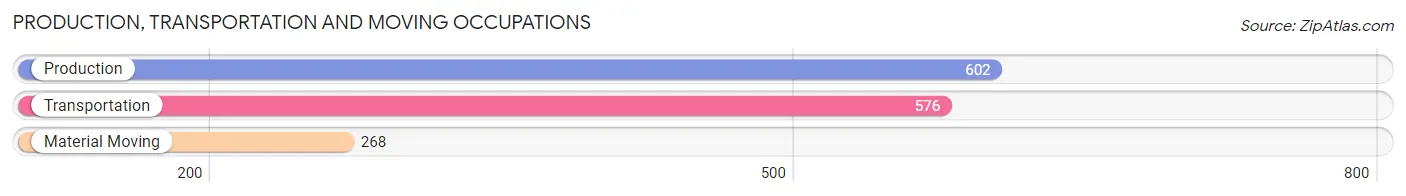
Production, Transportation and Moving Occupations
The most common Production, Transportation and Moving occupations in Winter Gardens are Production (602 | 6.0%), Transportation (576 | 5.8%), and Material Moving (268 | 2.7%).
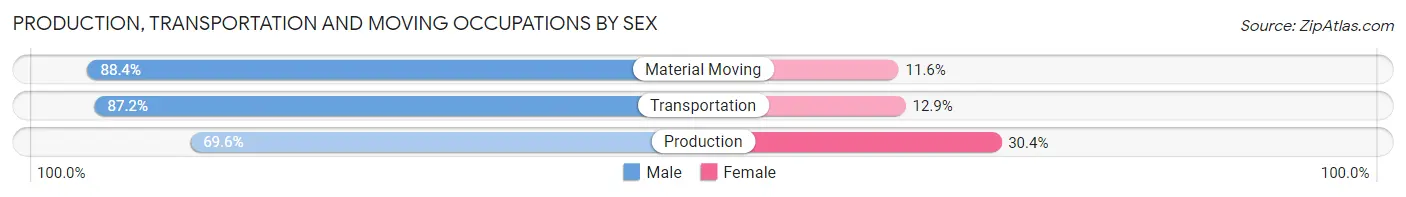
Production, Transportation and Moving Occupations by Sex
| Occupation | Male | Female |
| Production | 419 (69.6%) | 183 (30.4%) |
| Transportation | 502 (87.2%) | 74 (12.9%) |
| Material Moving | 237 (88.4%) | 31 (11.6%) |
| Total (Category) | 1,158 (80.1%) | 288 (19.9%) |
| Total (Overall) | 5,401 (54.2%) | 4,558 (45.8%) |
Employment Industries by Sex in Winter Gardens
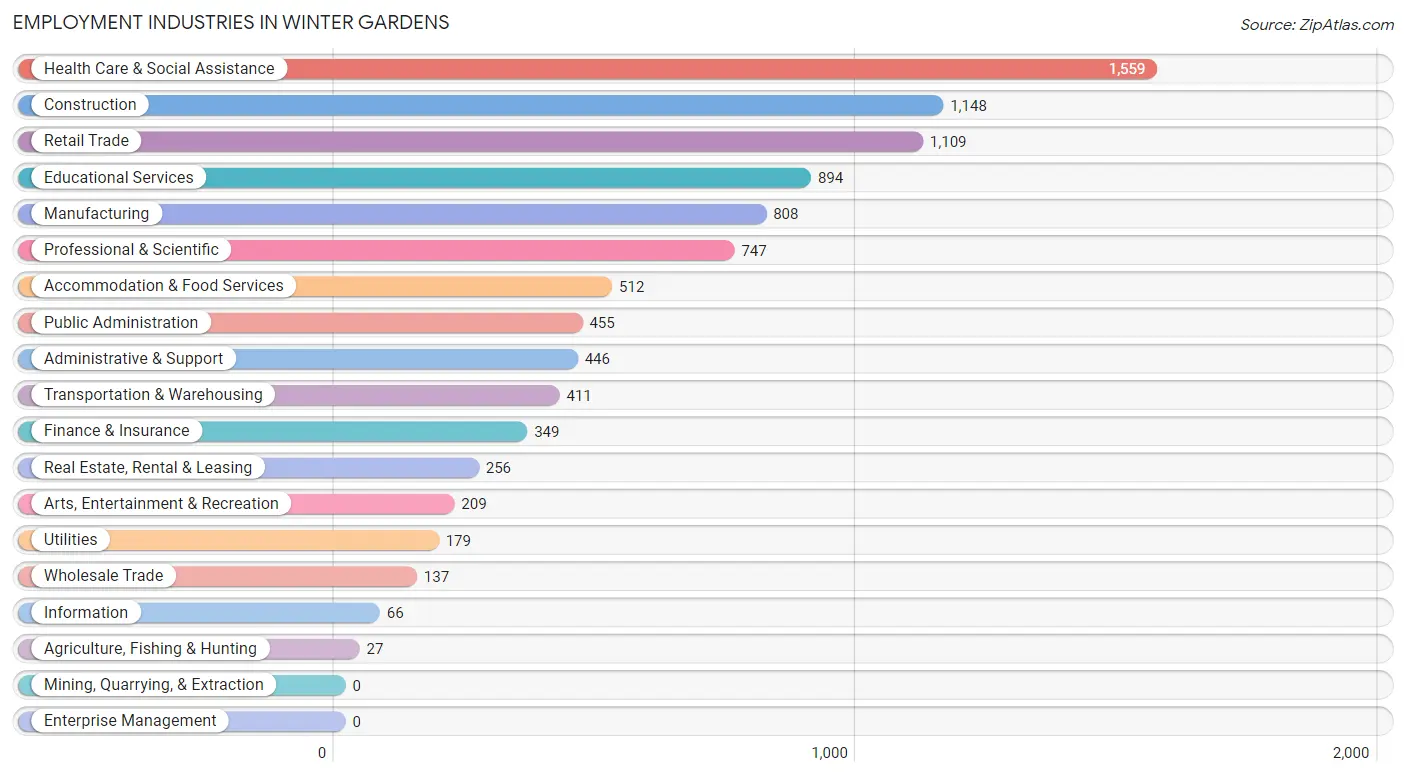
Employment Industries in Winter Gardens
The major employment industries in Winter Gardens include Health Care & Social Assistance (1,559 | 15.7%), Construction (1,148 | 11.5%), Retail Trade (1,109 | 11.1%), Educational Services (894 | 9.0%), and Manufacturing (808 | 8.1%).
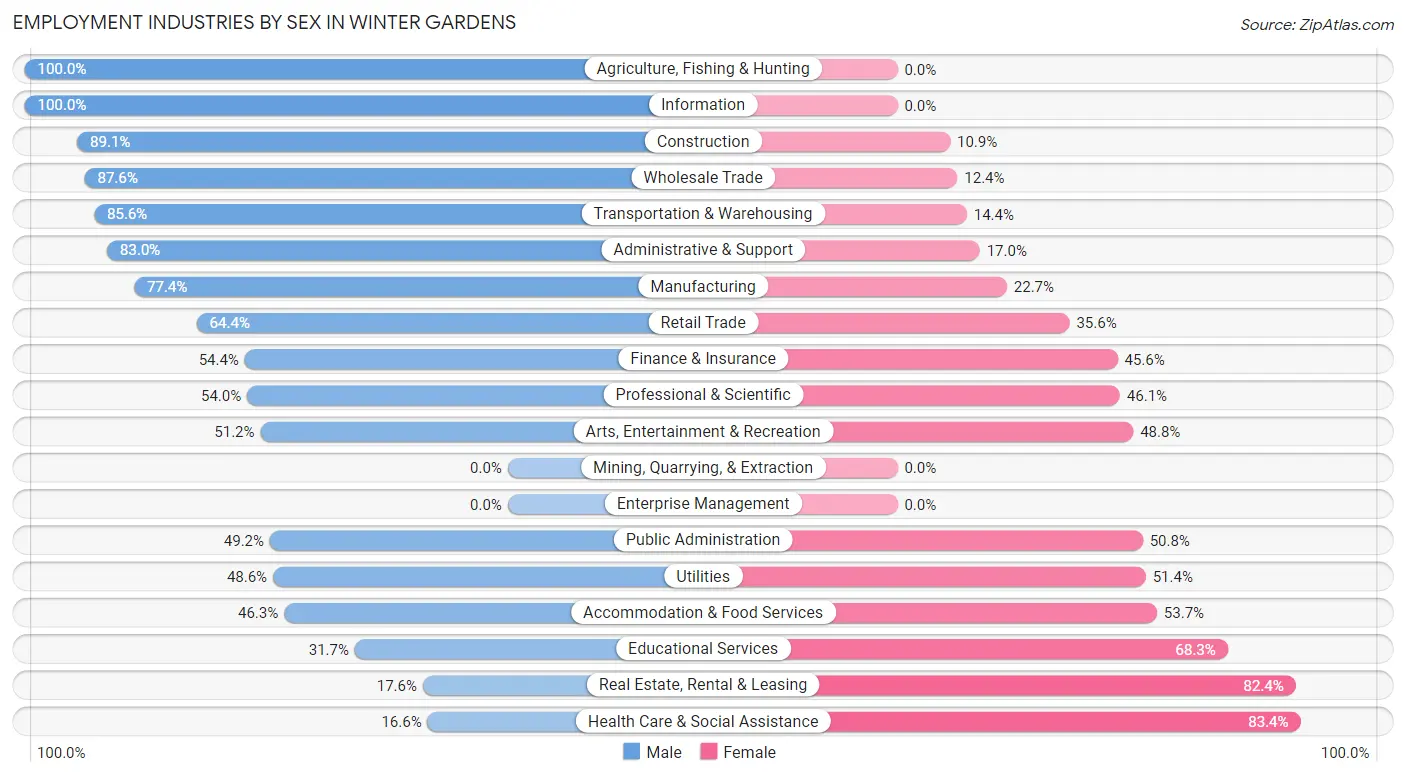
Employment Industries by Sex in Winter Gardens
The Winter Gardens industries that see more men than women are Agriculture, Fishing & Hunting (100.0%), Information (100.0%), and Construction (89.1%), whereas the industries that tend to have a higher number of women are Health Care & Social Assistance (83.4%), Real Estate, Rental & Leasing (82.4%), and Educational Services (68.3%).
| Industry | Male | Female |
| Agriculture, Fishing & Hunting | 27 (100.0%) | 0 (0.0%) |
| Mining, Quarrying, & Extraction | 0 (0.0%) | 0 (0.0%) |
| Construction | 1,023 (89.1%) | 125 (10.9%) |
| Manufacturing | 625 (77.3%) | 183 (22.7%) |
| Wholesale Trade | 120 (87.6%) | 17 (12.4%) |
| Retail Trade | 714 (64.4%) | 395 (35.6%) |
| Transportation & Warehousing | 352 (85.6%) | 59 (14.4%) |
| Utilities | 87 (48.6%) | 92 (51.4%) |
| Information | 66 (100.0%) | 0 (0.0%) |
| Finance & Insurance | 190 (54.4%) | 159 (45.6%) |
| Real Estate, Rental & Leasing | 45 (17.6%) | 211 (82.4%) |
| Professional & Scientific | 403 (53.9%) | 344 (46.1%) |
| Enterprise Management | 0 (0.0%) | 0 (0.0%) |
| Administrative & Support | 370 (83.0%) | 76 (17.0%) |
| Educational Services | 283 (31.7%) | 611 (68.3%) |
| Health Care & Social Assistance | 259 (16.6%) | 1,300 (83.4%) |
| Arts, Entertainment & Recreation | 107 (51.2%) | 102 (48.8%) |
| Accommodation & Food Services | 237 (46.3%) | 275 (53.7%) |
| Public Administration | 224 (49.2%) | 231 (50.8%) |
| Total | 5,401 (54.2%) | 4,558 (45.8%) |
Education in Winter Gardens
School Enrollment in Winter Gardens
The most common levels of schooling among the 5,785 students in Winter Gardens are high school (1,684 | 29.1%), middle school (1,109 | 19.2%), and college / undergraduate (1,006 | 17.4%).
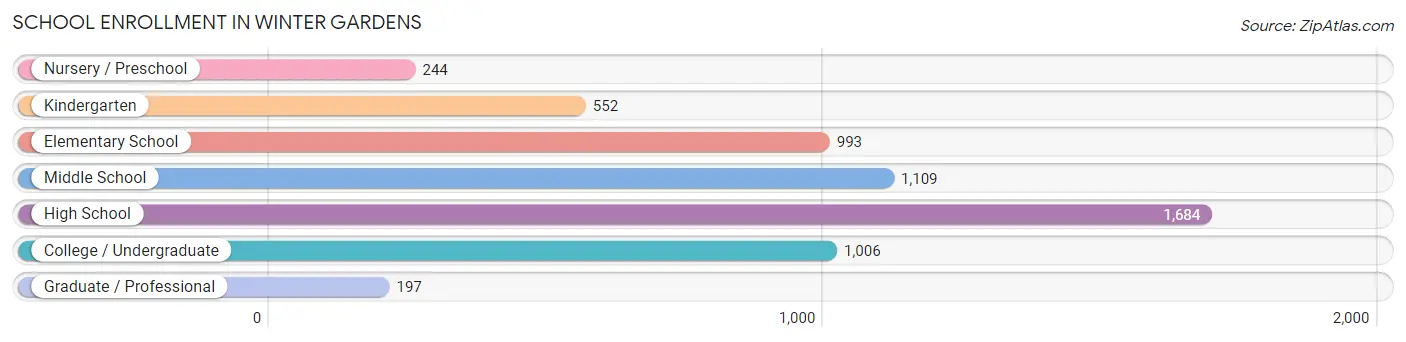
| School Level | # Students | % Students |
| Nursery / Preschool | 244 | 4.2% |
| Kindergarten | 552 | 9.5% |
| Elementary School | 993 | 17.2% |
| Middle School | 1,109 | 19.2% |
| High School | 1,684 | 29.1% |
| College / Undergraduate | 1,006 | 17.4% |
| Graduate / Professional | 197 | 3.4% |
| Total | 5,785 | 100.0% |
School Enrollment by Age by Funding Source in Winter Gardens
Out of a total of 5,785 students who are enrolled in schools in Winter Gardens, 561 (9.7%) attend a private institution, while the remaining 5,224 (90.3%) are enrolled in public schools. The age group of 25 to 34 year olds has the highest likelihood of being enrolled in private schools, with 157 (42.7% in the age bracket) enrolled. Conversely, the age group of 5 to 9 year old has the lowest likelihood of being enrolled in a private school, with 1,514 (98.1% in the age bracket) attending a public institution.
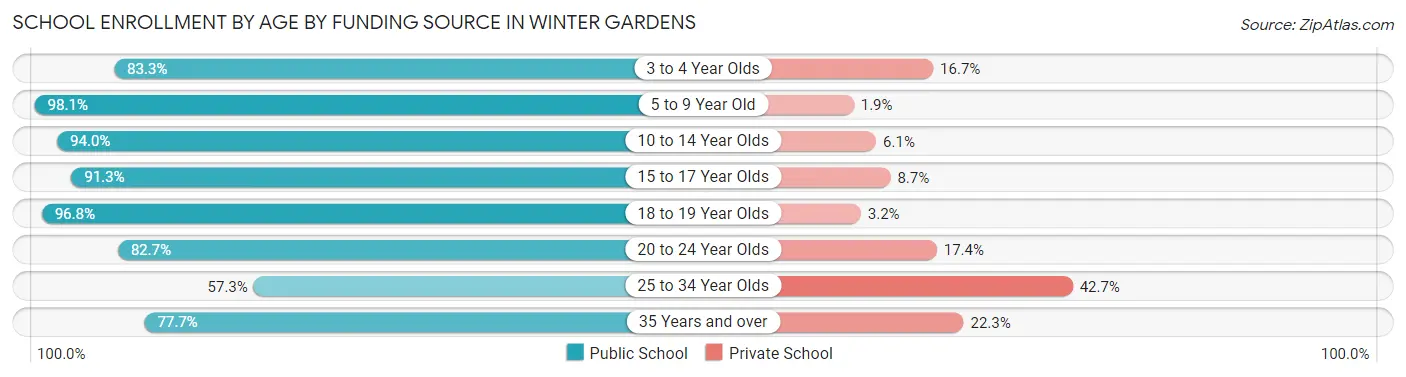
| Age Bracket | Public School | Private School |
| 3 to 4 Year Olds | 190 (83.3%) | 38 (16.7%) |
| 5 to 9 Year Old | 1,514 (98.1%) | 29 (1.9%) |
| 10 to 14 Year Olds | 1,274 (94.0%) | 82 (6.0%) |
| 15 to 17 Year Olds | 1,164 (91.3%) | 111 (8.7%) |
| 18 to 19 Year Olds | 363 (96.8%) | 12 (3.2%) |
| 20 to 24 Year Olds | 181 (82.7%) | 38 (17.3%) |
| 25 to 34 Year Olds | 211 (57.3%) | 157 (42.7%) |
| 35 Years and over | 327 (77.7%) | 94 (22.3%) |
| Total | 5,224 (90.3%) | 561 (9.7%) |
Educational Attainment by Field of Study in Winter Gardens
Business (466 | 16.3%), science & technology (443 | 15.4%), computers & mathematics (352 | 12.3%), arts & humanities (290 | 10.1%), and psychology (198 | 6.9%) are the most common fields of study among 2,867 individuals in Winter Gardens who have obtained a bachelor's degree or higher.
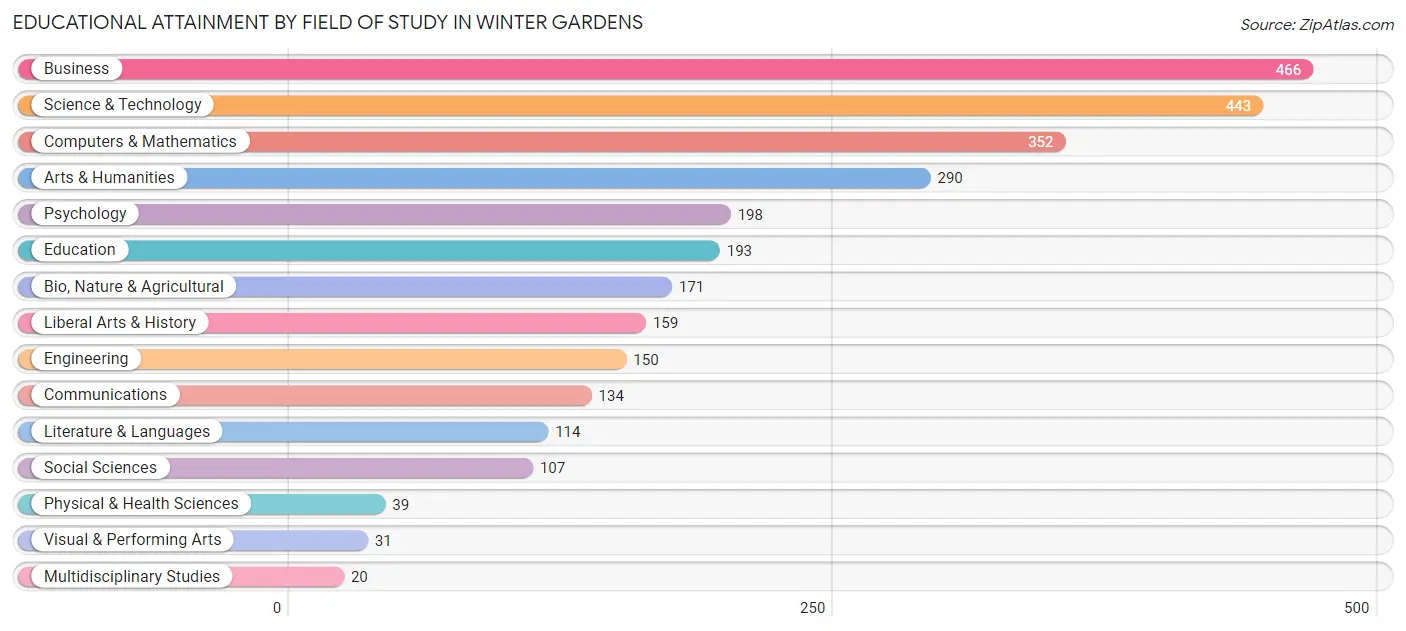
| Field of Study | # Graduates | % Graduates |
| Computers & Mathematics | 352 | 12.3% |
| Bio, Nature & Agricultural | 171 | 6.0% |
| Physical & Health Sciences | 39 | 1.4% |
| Psychology | 198 | 6.9% |
| Social Sciences | 107 | 3.7% |
| Engineering | 150 | 5.2% |
| Multidisciplinary Studies | 20 | 0.7% |
| Science & Technology | 443 | 15.4% |
| Business | 466 | 16.3% |
| Education | 193 | 6.7% |
| Literature & Languages | 114 | 4.0% |
| Liberal Arts & History | 159 | 5.6% |
| Visual & Performing Arts | 31 | 1.1% |
| Communications | 134 | 4.7% |
| Arts & Humanities | 290 | 10.1% |
| Total | 2,867 | 100.0% |
Transportation & Commute in Winter Gardens
Vehicle Availability by Sex in Winter Gardens
The most prevalent vehicle ownership categories in Winter Gardens are males with 2 vehicles (2,089, accounting for 38.7%) and females with 2 vehicles (1,547, making up 46.9%).
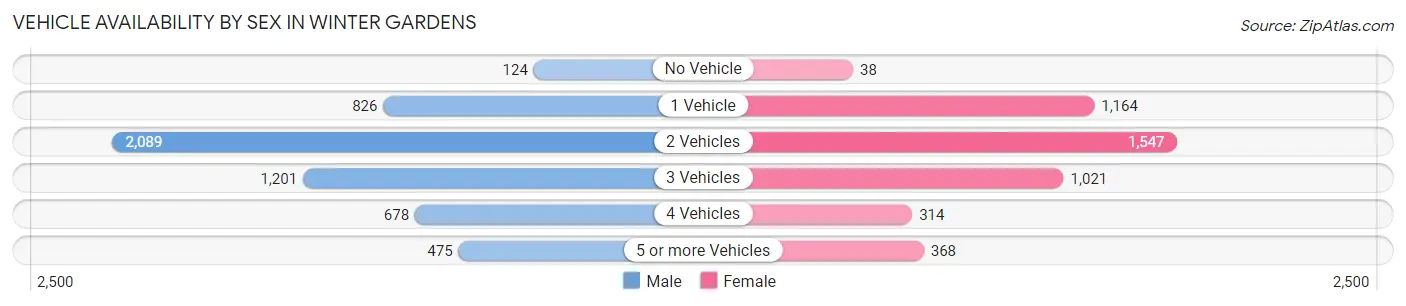
| Vehicles Available | Male | Female |
| No Vehicle | 124 (2.3%) | 38 (0.9%) |
| 1 Vehicle | 826 (15.3%) | 1,164 (26.2%) |
| 2 Vehicles | 2,089 (38.7%) | 1,547 (34.7%) |
| 3 Vehicles | 1,201 (22.3%) | 1,021 (22.9%) |
| 4 Vehicles | 678 (12.6%) | 314 (7.0%) |
| 5 or more Vehicles | 475 (8.8%) | 368 (8.3%) |
| Total | 5,393 (100.0%) | 4,452 (100.0%) |
Commute Time in Winter Gardens
The most frequently occuring commute durations in Winter Gardens are 15 to 19 minutes (1,654 commuters, 19.4%), 30 to 34 minutes (1,307 commuters, 15.3%), and 20 to 24 minutes (1,022 commuters, 12.0%).
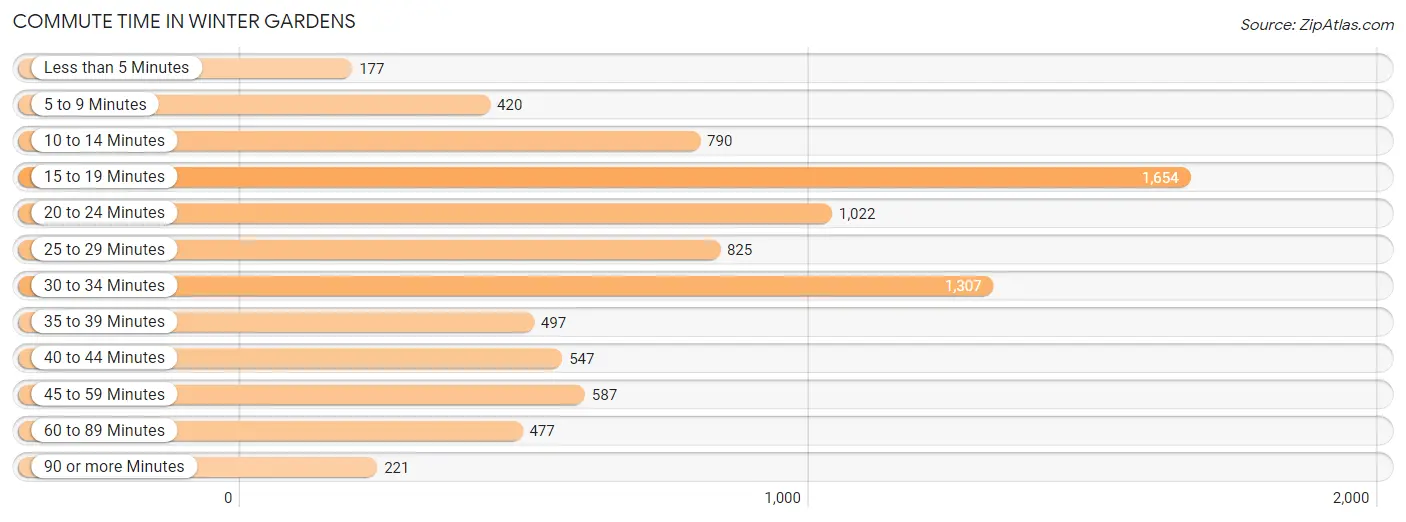
| Commute Time | # Commuters | % Commuters |
| Less than 5 Minutes | 177 | 2.1% |
| 5 to 9 Minutes | 420 | 4.9% |
| 10 to 14 Minutes | 790 | 9.3% |
| 15 to 19 Minutes | 1,654 | 19.4% |
| 20 to 24 Minutes | 1,022 | 12.0% |
| 25 to 29 Minutes | 825 | 9.7% |
| 30 to 34 Minutes | 1,307 | 15.3% |
| 35 to 39 Minutes | 497 | 5.8% |
| 40 to 44 Minutes | 547 | 6.4% |
| 45 to 59 Minutes | 587 | 6.9% |
| 60 to 89 Minutes | 477 | 5.6% |
| 90 or more Minutes | 221 | 2.6% |
Commute Time by Sex in Winter Gardens
The most common commute times in Winter Gardens are 15 to 19 minutes (1,014 commuters, 21.7%) for males and 15 to 19 minutes (640 commuters, 16.6%) for females.
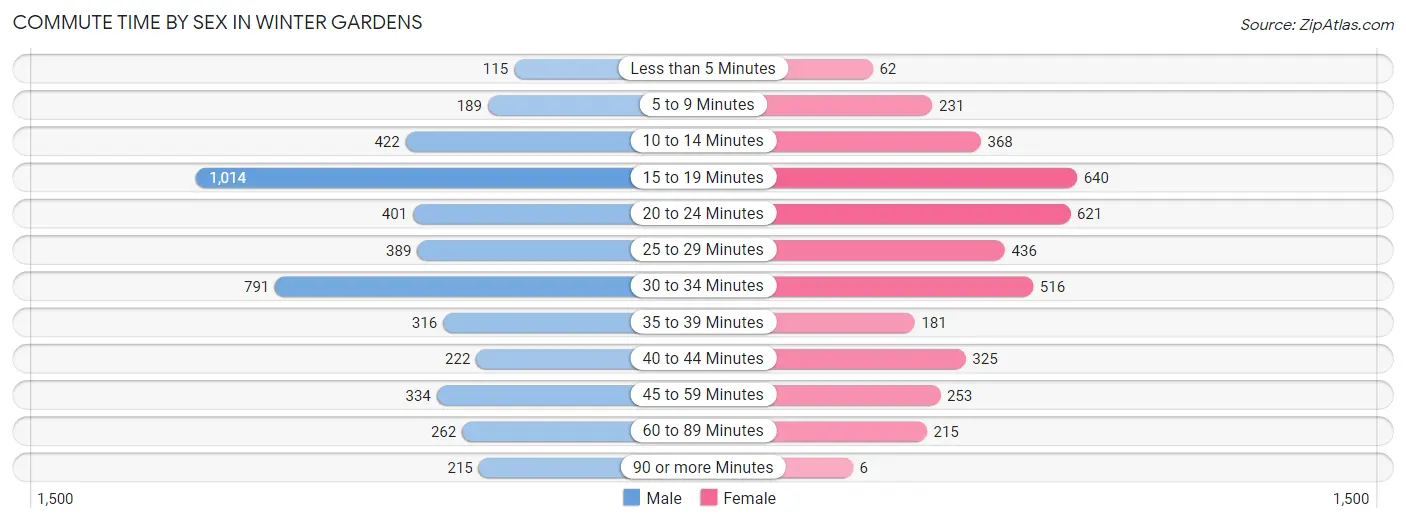
| Commute Time | Male | Female |
| Less than 5 Minutes | 115 (2.5%) | 62 (1.6%) |
| 5 to 9 Minutes | 189 (4.1%) | 231 (6.0%) |
| 10 to 14 Minutes | 422 (9.0%) | 368 (9.6%) |
| 15 to 19 Minutes | 1,014 (21.7%) | 640 (16.6%) |
| 20 to 24 Minutes | 401 (8.6%) | 621 (16.1%) |
| 25 to 29 Minutes | 389 (8.3%) | 436 (11.3%) |
| 30 to 34 Minutes | 791 (16.9%) | 516 (13.4%) |
| 35 to 39 Minutes | 316 (6.8%) | 181 (4.7%) |
| 40 to 44 Minutes | 222 (4.8%) | 325 (8.4%) |
| 45 to 59 Minutes | 334 (7.1%) | 253 (6.6%) |
| 60 to 89 Minutes | 262 (5.6%) | 215 (5.6%) |
| 90 or more Minutes | 215 (4.6%) | 6 (0.2%) |
Time of Departure to Work by Sex in Winter Gardens
The most frequent times of departure to work in Winter Gardens are 6:00 AM to 6:29 AM (820, 17.6%) for males and 7:00 AM to 7:29 AM (704, 18.3%) for females.
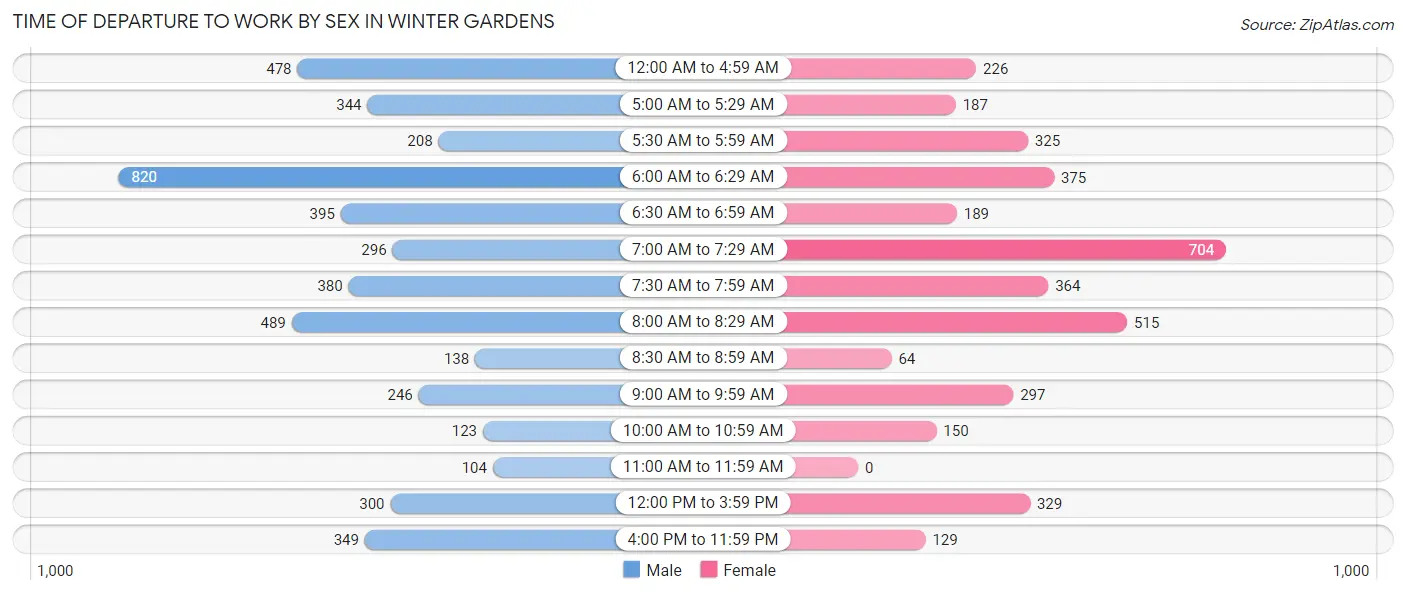
| Time of Departure | Male | Female |
| 12:00 AM to 4:59 AM | 478 (10.2%) | 226 (5.9%) |
| 5:00 AM to 5:29 AM | 344 (7.4%) | 187 (4.9%) |
| 5:30 AM to 5:59 AM | 208 (4.4%) | 325 (8.4%) |
| 6:00 AM to 6:29 AM | 820 (17.6%) | 375 (9.7%) |
| 6:30 AM to 6:59 AM | 395 (8.5%) | 189 (4.9%) |
| 7:00 AM to 7:29 AM | 296 (6.3%) | 704 (18.3%) |
| 7:30 AM to 7:59 AM | 380 (8.1%) | 364 (9.4%) |
| 8:00 AM to 8:29 AM | 489 (10.5%) | 515 (13.4%) |
| 8:30 AM to 8:59 AM | 138 (3.0%) | 64 (1.7%) |
| 9:00 AM to 9:59 AM | 246 (5.3%) | 297 (7.7%) |
| 10:00 AM to 10:59 AM | 123 (2.6%) | 150 (3.9%) |
| 11:00 AM to 11:59 AM | 104 (2.2%) | 0 (0.0%) |
| 12:00 PM to 3:59 PM | 300 (6.4%) | 329 (8.5%) |
| 4:00 PM to 11:59 PM | 349 (7.5%) | 129 (3.4%) |
| Total | 4,670 (100.0%) | 3,854 (100.0%) |
Housing Occupancy in Winter Gardens
Occupancy by Ownership in Winter Gardens
Of the total 7,435 dwellings in Winter Gardens, owner-occupied units account for 4,537 (61.0%), while renter-occupied units make up 2,898 (39.0%).
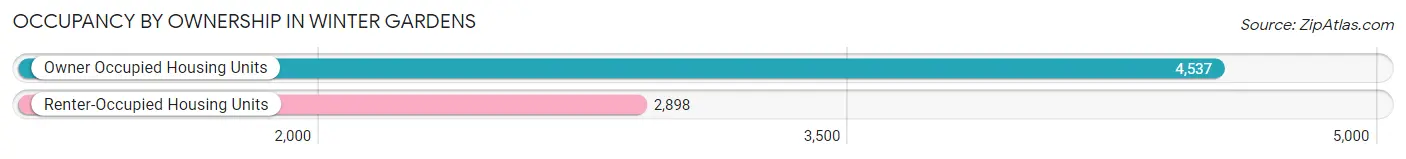
| Occupancy | # Housing Units | % Housing Units |
| Owner Occupied Housing Units | 4,537 | 61.0% |
| Renter-Occupied Housing Units | 2,898 | 39.0% |
| Total Occupied Housing Units | 7,435 | 100.0% |
Occupancy by Household Size in Winter Gardens
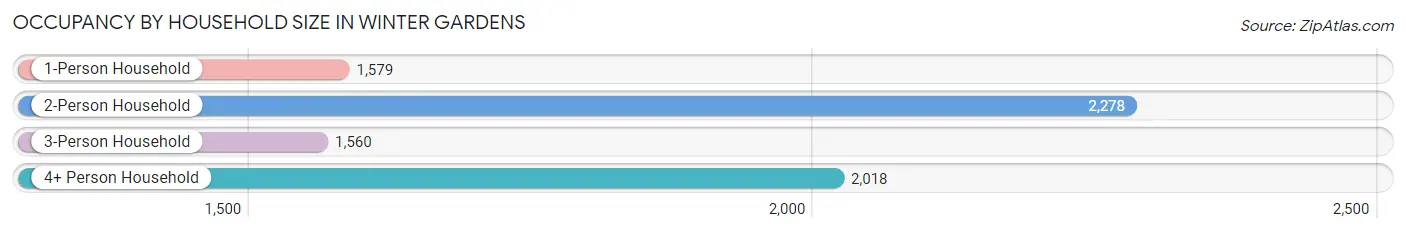
| Household Size | # Housing Units | % Housing Units |
| 1-Person Household | 1,579 | 21.2% |
| 2-Person Household | 2,278 | 30.6% |
| 3-Person Household | 1,560 | 21.0% |
| 4+ Person Household | 2,018 | 27.1% |
| Total Housing Units | 7,435 | 100.0% |
Occupancy by Ownership by Household Size in Winter Gardens
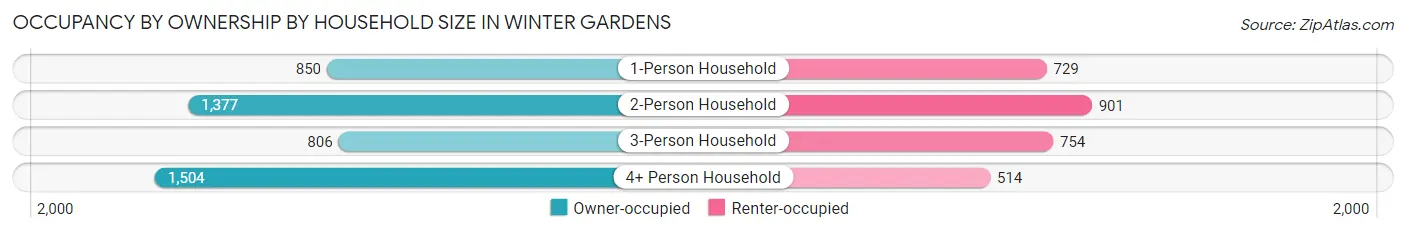
| Household Size | Owner-occupied | Renter-occupied |
| 1-Person Household | 850 (53.8%) | 729 (46.2%) |
| 2-Person Household | 1,377 (60.5%) | 901 (39.6%) |
| 3-Person Household | 806 (51.7%) | 754 (48.3%) |
| 4+ Person Household | 1,504 (74.5%) | 514 (25.5%) |
| Total Housing Units | 4,537 (61.0%) | 2,898 (39.0%) |
Occupancy by Educational Attainment in Winter Gardens
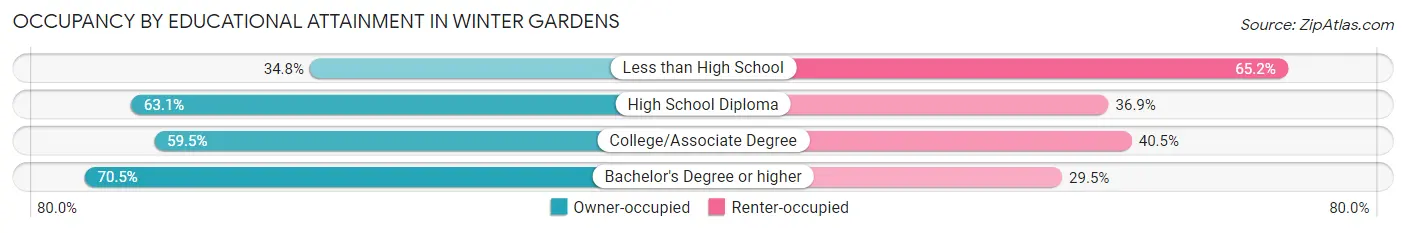
| Household Size | Owner-occupied | Renter-occupied |
| Less than High School | 210 (34.8%) | 394 (65.2%) |
| High School Diploma | 1,257 (63.1%) | 734 (36.9%) |
| College/Associate Degree | 1,844 (59.5%) | 1,257 (40.5%) |
| Bachelor's Degree or higher | 1,226 (70.5%) | 513 (29.5%) |
Occupancy by Age of Householder in Winter Gardens
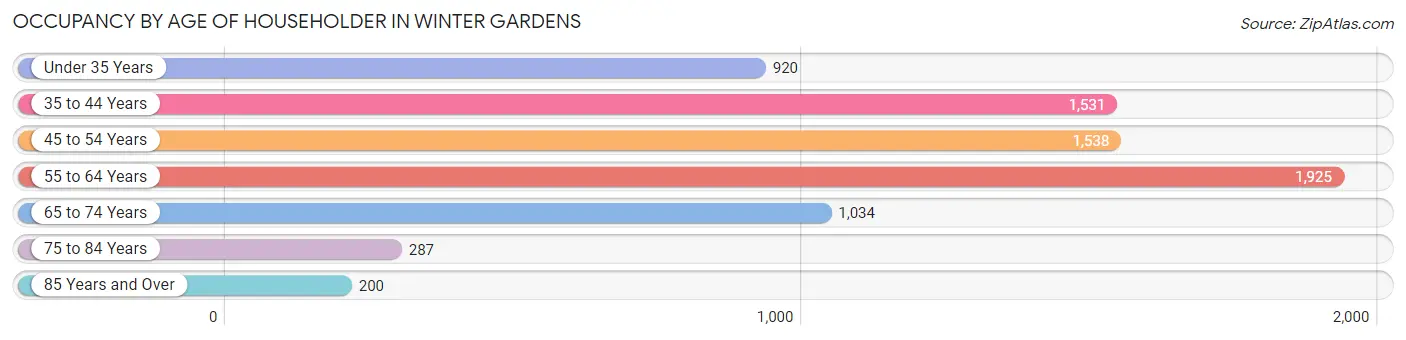
| Age Bracket | # Households | % Households |
| Under 35 Years | 920 | 12.4% |
| 35 to 44 Years | 1,531 | 20.6% |
| 45 to 54 Years | 1,538 | 20.7% |
| 55 to 64 Years | 1,925 | 25.9% |
| 65 to 74 Years | 1,034 | 13.9% |
| 75 to 84 Years | 287 | 3.9% |
| 85 Years and Over | 200 | 2.7% |
| Total | 7,435 | 100.0% |
Housing Finances in Winter Gardens
Median Income by Occupancy in Winter Gardens
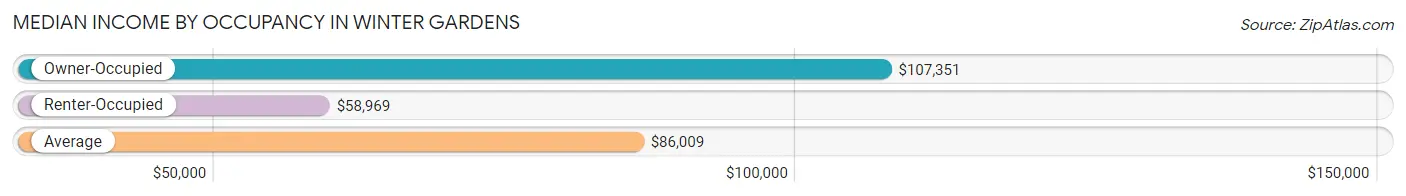
| Occupancy Type | # Households | Median Income |
| Owner-Occupied | 4,537 (61.0%) | $107,351 |
| Renter-Occupied | 2,898 (39.0%) | $58,969 |
| Average | 7,435 (100.0%) | $86,009 |
Occupancy by Householder Income Bracket in Winter Gardens
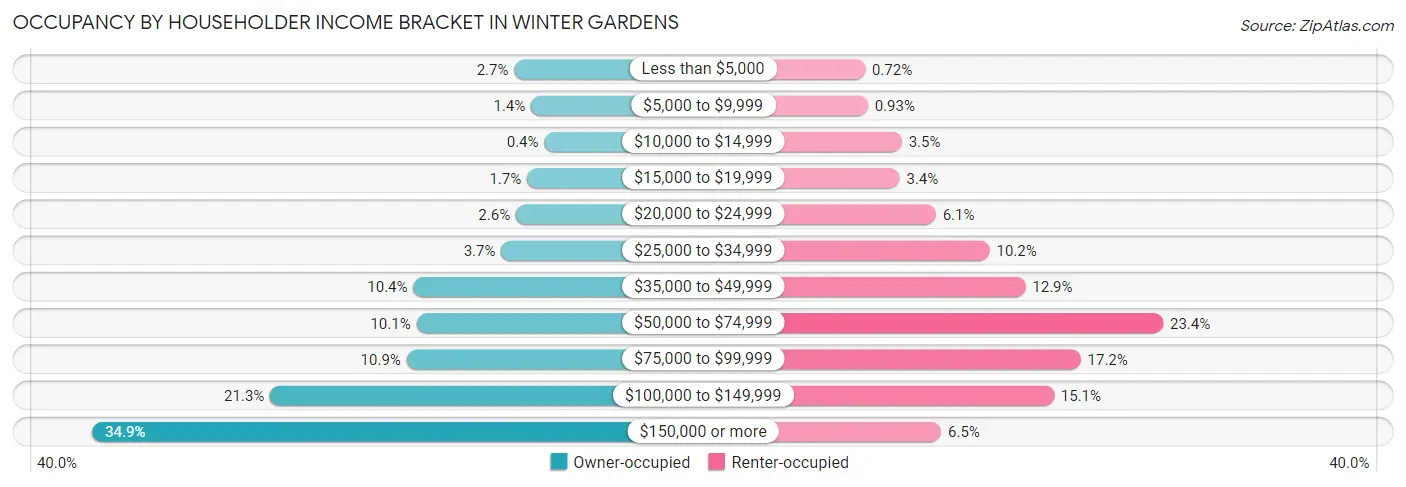
| Income Bracket | Owner-occupied | Renter-occupied |
| Less than $5,000 | 122 (2.7%) | 21 (0.7%) |
| $5,000 to $9,999 | 64 (1.4%) | 27 (0.9%) |
| $10,000 to $14,999 | 18 (0.4%) | 102 (3.5%) |
| $15,000 to $19,999 | 78 (1.7%) | 97 (3.4%) |
| $20,000 to $24,999 | 116 (2.6%) | 177 (6.1%) |
| $25,000 to $34,999 | 167 (3.7%) | 296 (10.2%) |
| $35,000 to $49,999 | 471 (10.4%) | 375 (12.9%) |
| $50,000 to $74,999 | 460 (10.1%) | 679 (23.4%) |
| $75,000 to $99,999 | 494 (10.9%) | 497 (17.2%) |
| $100,000 to $149,999 | 966 (21.3%) | 438 (15.1%) |
| $150,000 or more | 1,581 (34.8%) | 189 (6.5%) |
| Total | 4,537 (100.0%) | 2,898 (100.0%) |
Monthly Housing Cost Tiers in Winter Gardens
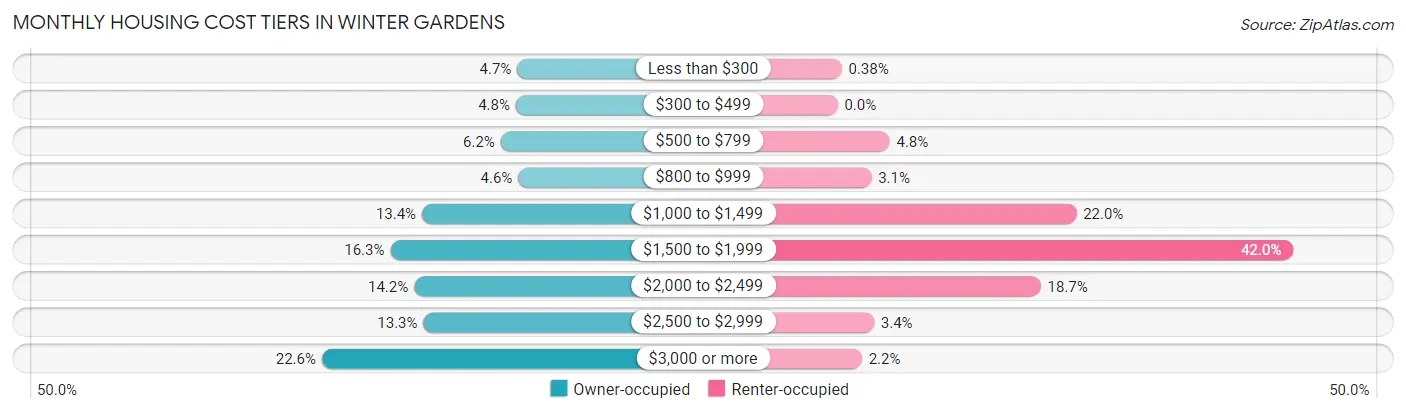
| Monthly Cost | Owner-occupied | Renter-occupied |
| Less than $300 | 211 (4.6%) | 11 (0.4%) |
| $300 to $499 | 217 (4.8%) | 0 (0.0%) |
| $500 to $799 | 280 (6.2%) | 139 (4.8%) |
| $800 to $999 | 207 (4.6%) | 90 (3.1%) |
| $1,000 to $1,499 | 609 (13.4%) | 637 (22.0%) |
| $1,500 to $1,999 | 741 (16.3%) | 1,216 (42.0%) |
| $2,000 to $2,499 | 642 (14.1%) | 542 (18.7%) |
| $2,500 to $2,999 | 603 (13.3%) | 97 (3.4%) |
| $3,000 or more | 1,027 (22.6%) | 65 (2.2%) |
| Total | 4,537 (100.0%) | 2,898 (100.0%) |
Physical Housing Characteristics in Winter Gardens
Housing Structures in Winter Gardens
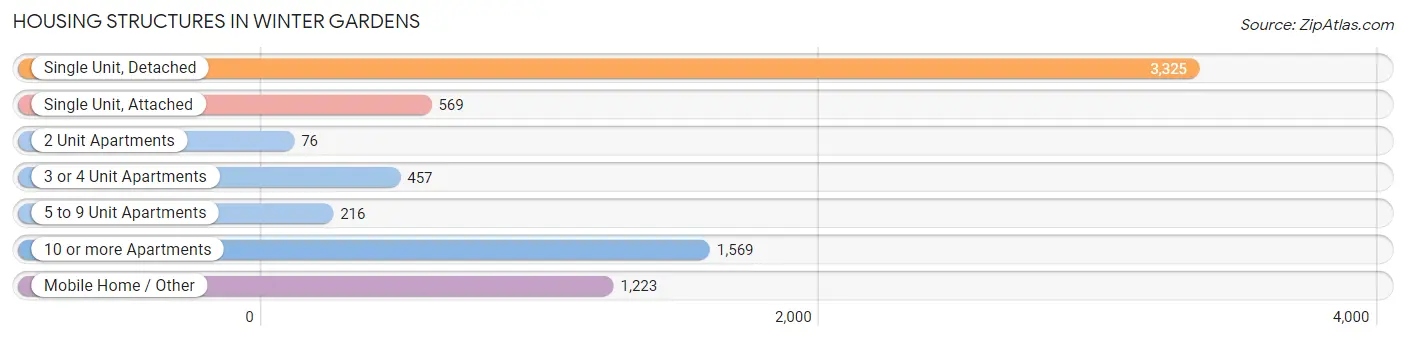
| Structure Type | # Housing Units | % Housing Units |
| Single Unit, Detached | 3,325 | 44.7% |
| Single Unit, Attached | 569 | 7.6% |
| 2 Unit Apartments | 76 | 1.0% |
| 3 or 4 Unit Apartments | 457 | 6.1% |
| 5 to 9 Unit Apartments | 216 | 2.9% |
| 10 or more Apartments | 1,569 | 21.1% |
| Mobile Home / Other | 1,223 | 16.5% |
| Total | 7,435 | 100.0% |
Housing Structures by Occupancy in Winter Gardens
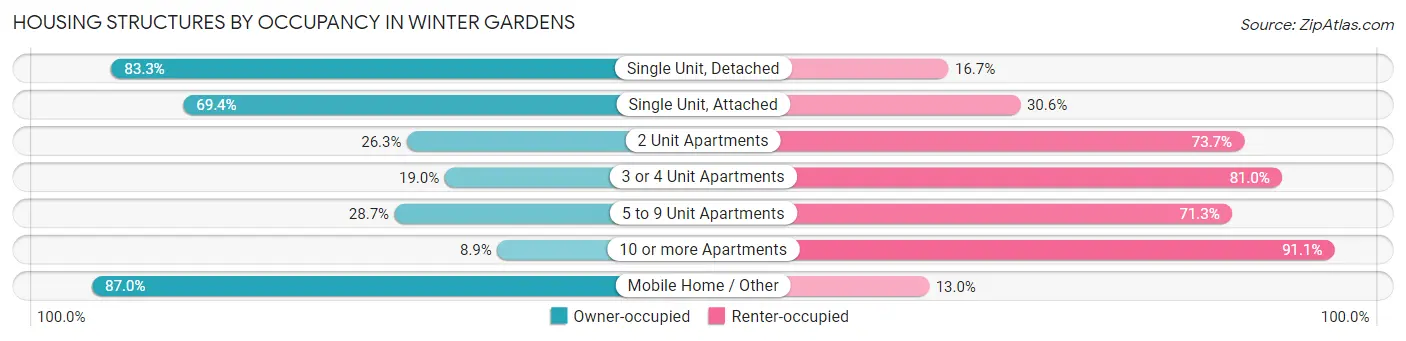
| Structure Type | Owner-occupied | Renter-occupied |
| Single Unit, Detached | 2,769 (83.3%) | 556 (16.7%) |
| Single Unit, Attached | 395 (69.4%) | 174 (30.6%) |
| 2 Unit Apartments | 20 (26.3%) | 56 (73.7%) |
| 3 or 4 Unit Apartments | 87 (19.0%) | 370 (81.0%) |
| 5 to 9 Unit Apartments | 62 (28.7%) | 154 (71.3%) |
| 10 or more Apartments | 140 (8.9%) | 1,429 (91.1%) |
| Mobile Home / Other | 1,064 (87.0%) | 159 (13.0%) |
| Total | 4,537 (61.0%) | 2,898 (39.0%) |
Housing Structures by Number of Rooms in Winter Gardens
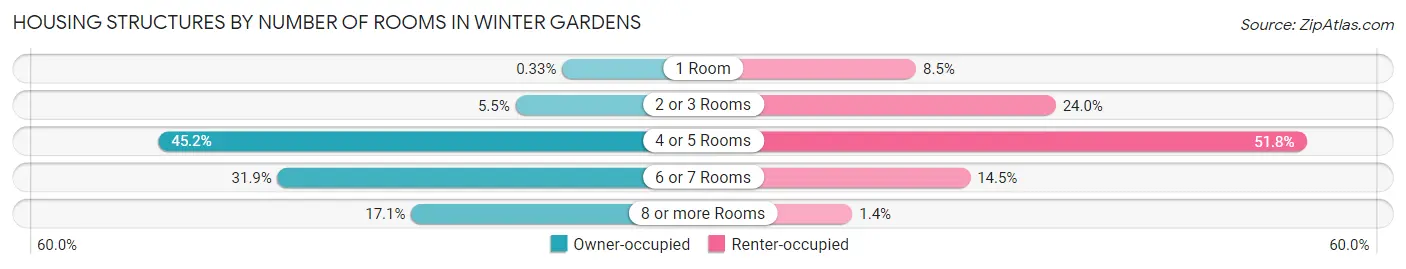
| Number of Rooms | Owner-occupied | Renter-occupied |
| 1 Room | 15 (0.3%) | 245 (8.5%) |
| 2 or 3 Rooms | 250 (5.5%) | 694 (23.9%) |
| 4 or 5 Rooms | 2,049 (45.2%) | 1,500 (51.8%) |
| 6 or 7 Rooms | 1,448 (31.9%) | 419 (14.5%) |
| 8 or more Rooms | 775 (17.1%) | 40 (1.4%) |
| Total | 4,537 (100.0%) | 2,898 (100.0%) |
Housing Structure by Heating Type in Winter Gardens
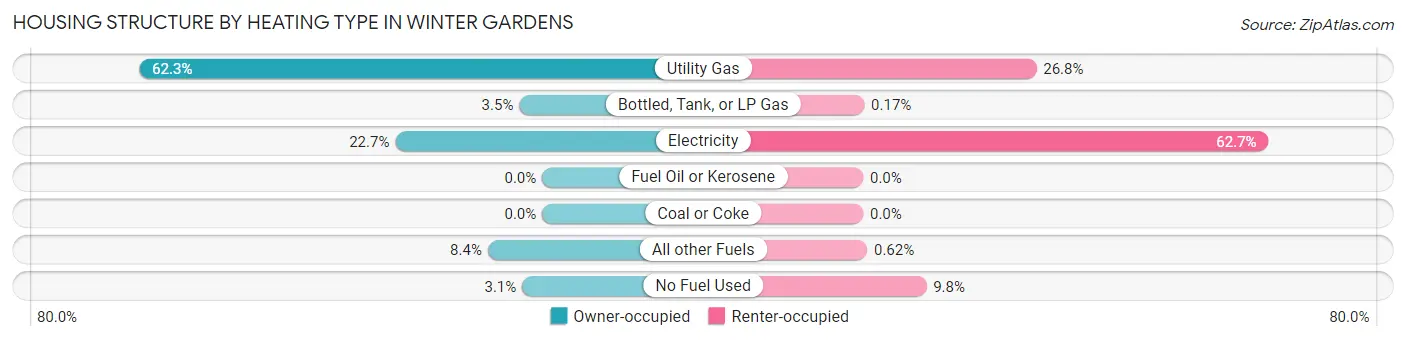
| Heating Type | Owner-occupied | Renter-occupied |
| Utility Gas | 2,826 (62.3%) | 776 (26.8%) |
| Bottled, Tank, or LP Gas | 160 (3.5%) | 5 (0.2%) |
| Electricity | 1,030 (22.7%) | 1,816 (62.7%) |
| Fuel Oil or Kerosene | 0 (0.0%) | 0 (0.0%) |
| Coal or Coke | 0 (0.0%) | 0 (0.0%) |
| All other Fuels | 381 (8.4%) | 18 (0.6%) |
| No Fuel Used | 140 (3.1%) | 283 (9.8%) |
| Total | 4,537 (100.0%) | 2,898 (100.0%) |
Household Vehicle Usage in Winter Gardens
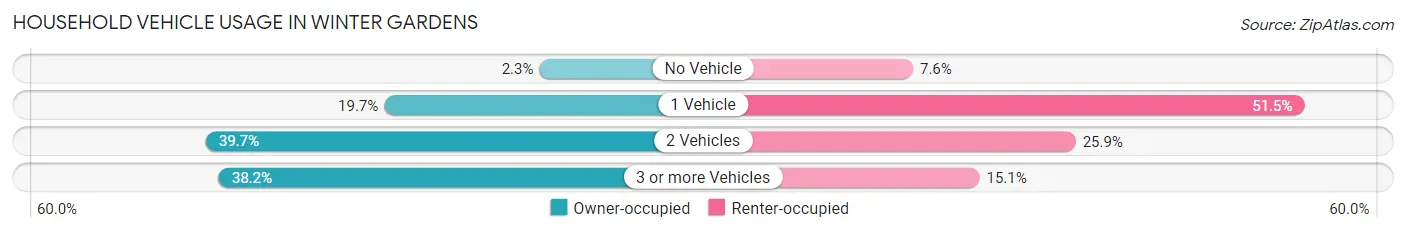
| Vehicles per Household | Owner-occupied | Renter-occupied |
| No Vehicle | 106 (2.3%) | 221 (7.6%) |
| 1 Vehicle | 895 (19.7%) | 1,491 (51.4%) |
| 2 Vehicles | 1,801 (39.7%) | 749 (25.9%) |
| 3 or more Vehicles | 1,735 (38.2%) | 437 (15.1%) |
| Total | 4,537 (100.0%) | 2,898 (100.0%) |
Real Estate & Mortgages in Winter Gardens
Real Estate and Mortgage Overview in Winter Gardens
| Characteristic | Without Mortgage | With Mortgage |
| Housing Units | 1,407 | 3,130 |
| Median Property Value | $239,700 | $591,000 |
| Median Household Income | $67,637 | $1,303 |
| Monthly Housing Costs | $832 | $1,027 |
| Real Estate Taxes | $2,210 | $42 |
Property Value by Mortgage Status in Winter Gardens
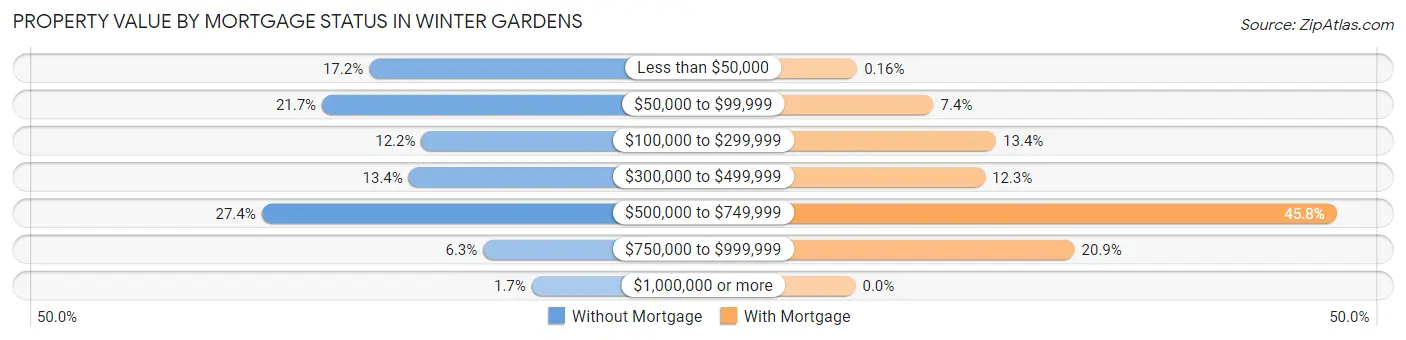
| Property Value | Without Mortgage | With Mortgage |
| Less than $50,000 | 242 (17.2%) | 5 (0.2%) |
| $50,000 to $99,999 | 305 (21.7%) | 233 (7.4%) |
| $100,000 to $299,999 | 172 (12.2%) | 419 (13.4%) |
| $300,000 to $499,999 | 189 (13.4%) | 386 (12.3%) |
| $500,000 to $749,999 | 386 (27.4%) | 1,434 (45.8%) |
| $750,000 to $999,999 | 89 (6.3%) | 653 (20.9%) |
| $1,000,000 or more | 24 (1.7%) | 0 (0.0%) |
| Total | 1,407 (100.0%) | 3,130 (100.0%) |
Household Income by Mortgage Status in Winter Gardens
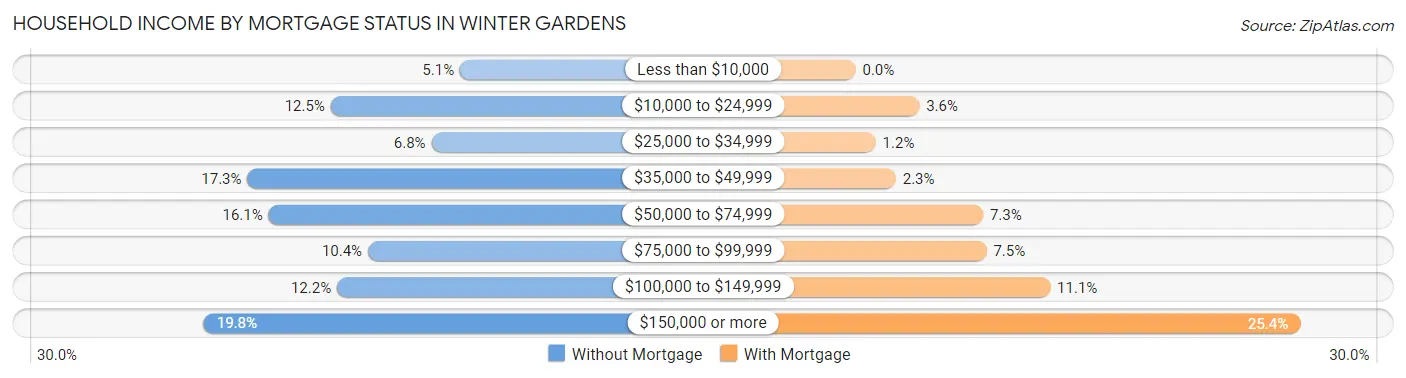
| Household Income | Without Mortgage | With Mortgage |
| Less than $10,000 | 72 (5.1%) | 0 (0.0%) |
| $10,000 to $24,999 | 176 (12.5%) | 114 (3.6%) |
| $25,000 to $34,999 | 95 (6.8%) | 36 (1.1%) |
| $35,000 to $49,999 | 243 (17.3%) | 72 (2.3%) |
| $50,000 to $74,999 | 226 (16.1%) | 228 (7.3%) |
| $75,000 to $99,999 | 146 (10.4%) | 234 (7.5%) |
| $100,000 to $149,999 | 171 (12.1%) | 348 (11.1%) |
| $150,000 or more | 278 (19.8%) | 795 (25.4%) |
| Total | 1,407 (100.0%) | 3,130 (100.0%) |
Property Value to Household Income Ratio in Winter Gardens
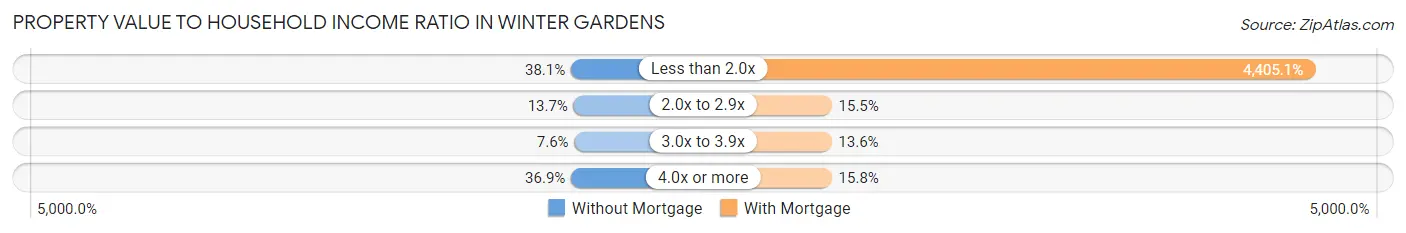
| Value-to-Income Ratio | Without Mortgage | With Mortgage |
| Less than 2.0x | 536 (38.1%) | 137,881 (4,405.1%) |
| 2.0x to 2.9x | 193 (13.7%) | 486 (15.5%) |
| 3.0x to 3.9x | 107 (7.6%) | 425 (13.6%) |
| 4.0x or more | 519 (36.9%) | 493 (15.8%) |
| Total | 1,407 (100.0%) | 3,130 (100.0%) |
Real Estate Taxes by Mortgage Status in Winter Gardens
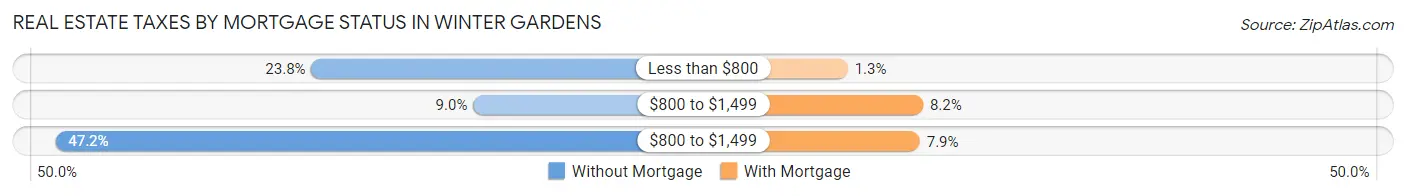
| Property Taxes | Without Mortgage | With Mortgage |
| Less than $800 | 335 (23.8%) | 42 (1.3%) |
| $800 to $1,499 | 127 (9.0%) | 257 (8.2%) |
| $800 to $1,499 | 664 (47.2%) | 248 (7.9%) |
| Total | 1,407 (100.0%) | 3,130 (100.0%) |
Health & Disability in Winter Gardens
Health Insurance Coverage by Age in Winter Gardens
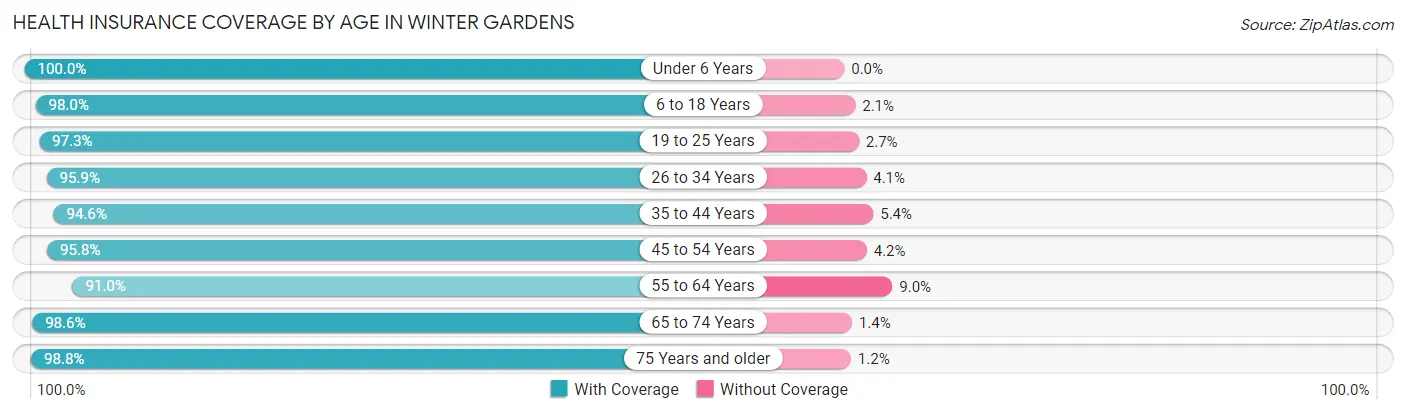
| Age Bracket | With Coverage | Without Coverage |
| Under 6 Years | 1,265 (100.0%) | 0 (0.0%) |
| 6 to 18 Years | 4,247 (98.0%) | 89 (2.1%) |
| 19 to 25 Years | 1,432 (97.3%) | 40 (2.7%) |
| 26 to 34 Years | 2,131 (95.9%) | 91 (4.1%) |
| 35 to 44 Years | 2,868 (94.6%) | 164 (5.4%) |
| 45 to 54 Years | 2,742 (95.8%) | 120 (4.2%) |
| 55 to 64 Years | 2,875 (91.0%) | 283 (9.0%) |
| 65 to 74 Years | 1,795 (98.6%) | 26 (1.4%) |
| 75 Years and older | 962 (98.8%) | 12 (1.2%) |
| Total | 20,317 (96.1%) | 825 (3.9%) |
Health Insurance Coverage by Citizenship Status in Winter Gardens
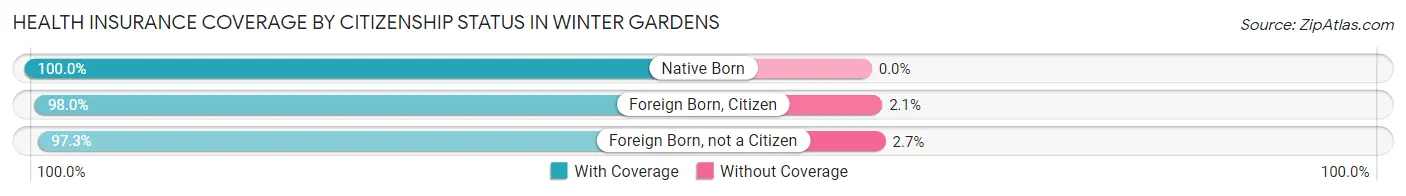
| Citizenship Status | With Coverage | Without Coverage |
| Native Born | 1,265 (100.0%) | 0 (0.0%) |
| Foreign Born, Citizen | 4,247 (98.0%) | 89 (2.1%) |
| Foreign Born, not a Citizen | 1,432 (97.3%) | 40 (2.7%) |
Health Insurance Coverage by Household Income in Winter Gardens
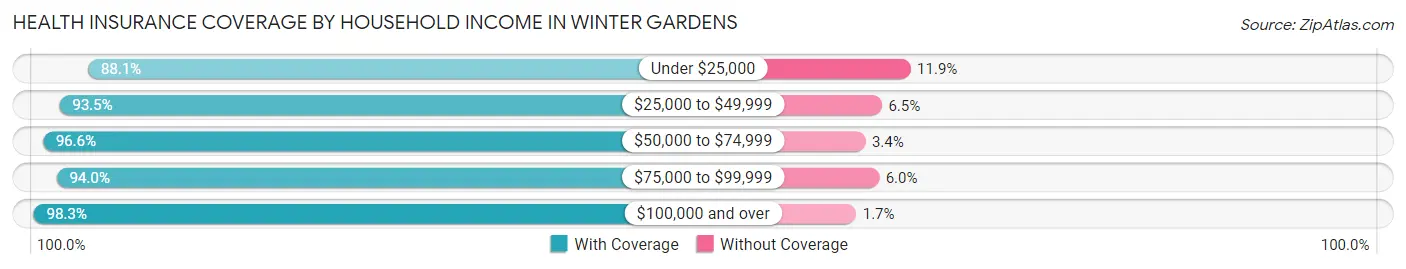
| Household Income | With Coverage | Without Coverage |
| Under $25,000 | 1,218 (88.1%) | 164 (11.9%) |
| $25,000 to $49,999 | 2,893 (93.5%) | 201 (6.5%) |
| $50,000 to $74,999 | 3,208 (96.6%) | 113 (3.4%) |
| $75,000 to $99,999 | 2,561 (94.0%) | 163 (6.0%) |
| $100,000 and over | 10,269 (98.3%) | 177 (1.7%) |
Public vs Private Health Insurance Coverage by Age in Winter Gardens
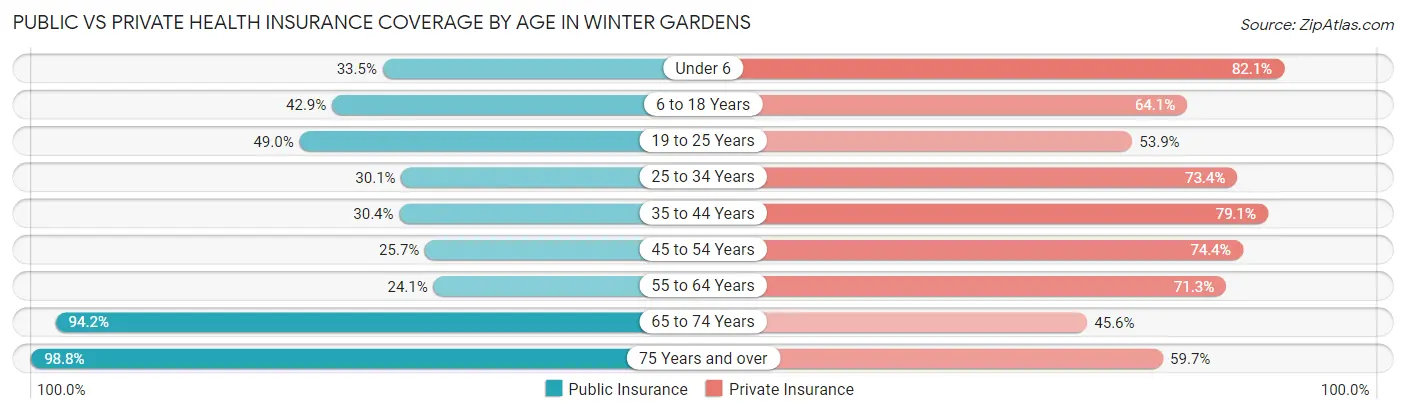
| Age Bracket | Public Insurance | Private Insurance |
| Under 6 | 424 (33.5%) | 1,038 (82.1%) |
| 6 to 18 Years | 1,861 (42.9%) | 2,778 (64.1%) |
| 19 to 25 Years | 721 (49.0%) | 794 (53.9%) |
| 25 to 34 Years | 668 (30.1%) | 1,631 (73.4%) |
| 35 to 44 Years | 923 (30.4%) | 2,397 (79.1%) |
| 45 to 54 Years | 734 (25.7%) | 2,129 (74.4%) |
| 55 to 64 Years | 761 (24.1%) | 2,252 (71.3%) |
| 65 to 74 Years | 1,716 (94.2%) | 830 (45.6%) |
| 75 Years and over | 962 (98.8%) | 581 (59.7%) |
| Total | 8,770 (41.5%) | 14,430 (68.2%) |
Disability Status by Sex by Age in Winter Gardens
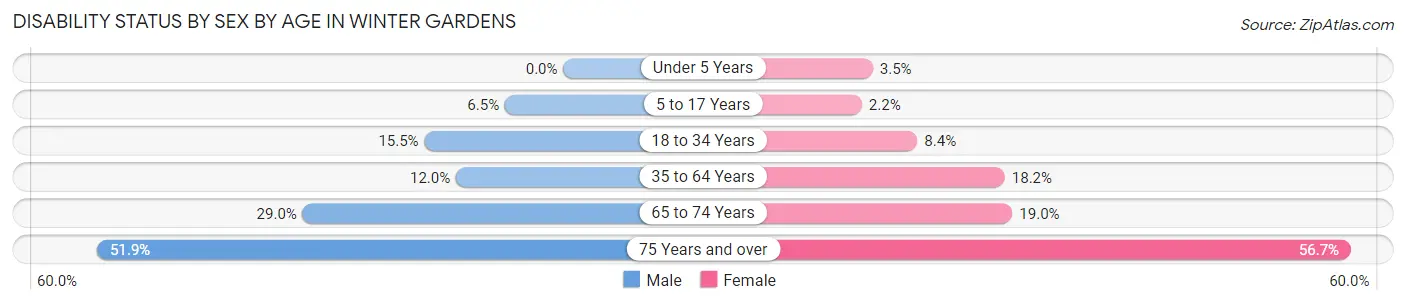
| Age Bracket | Male | Female |
| Under 5 Years | 0 (0.0%) | 21 (3.5%) |
| 5 to 17 Years | 116 (6.5%) | 56 (2.2%) |
| 18 to 34 Years | 326 (15.5%) | 156 (8.4%) |
| 35 to 64 Years | 525 (11.9%) | 846 (18.2%) |
| 65 to 74 Years | 243 (29.0%) | 187 (19.0%) |
| 75 Years and over | 254 (51.9%) | 275 (56.7%) |
Disability Class by Sex by Age in Winter Gardens
Disability Class: Hearing Difficulty
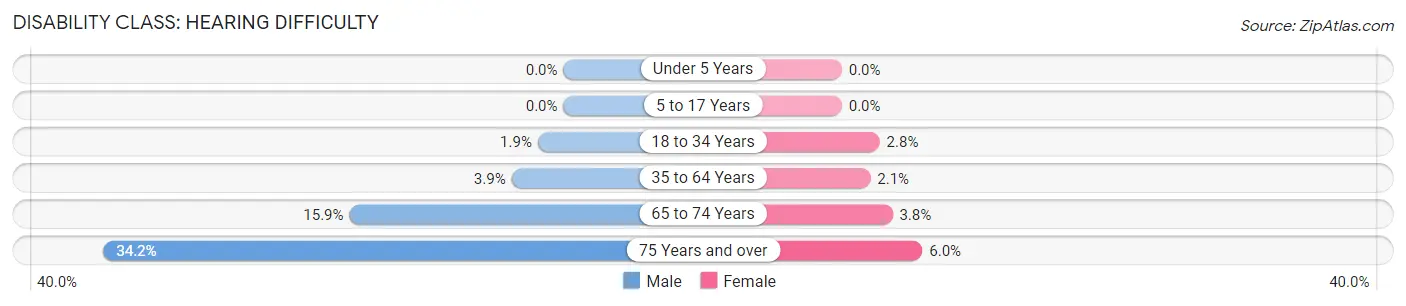
| Age Bracket | Male | Female |
| Under 5 Years | 0 (0.0%) | 0 (0.0%) |
| 5 to 17 Years | 0 (0.0%) | 0 (0.0%) |
| 18 to 34 Years | 40 (1.9%) | 52 (2.8%) |
| 35 to 64 Years | 169 (3.8%) | 99 (2.1%) |
| 65 to 74 Years | 133 (15.9%) | 37 (3.8%) |
| 75 Years and over | 167 (34.2%) | 29 (6.0%) |
Disability Class: Vision Difficulty
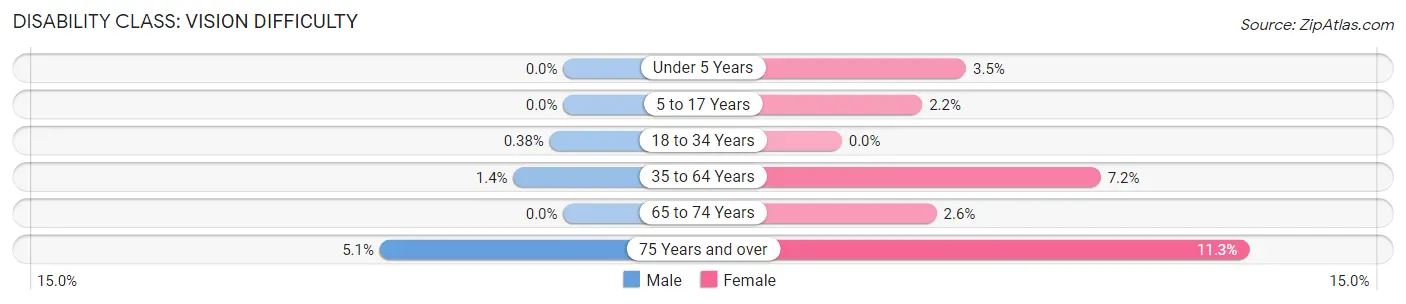
| Age Bracket | Male | Female |
| Under 5 Years | 0 (0.0%) | 21 (3.5%) |
| 5 to 17 Years | 0 (0.0%) | 56 (2.2%) |
| 18 to 34 Years | 8 (0.4%) | 0 (0.0%) |
| 35 to 64 Years | 61 (1.4%) | 336 (7.2%) |
| 65 to 74 Years | 0 (0.0%) | 26 (2.6%) |
| 75 Years and over | 25 (5.1%) | 55 (11.3%) |
Disability Class: Cognitive Difficulty
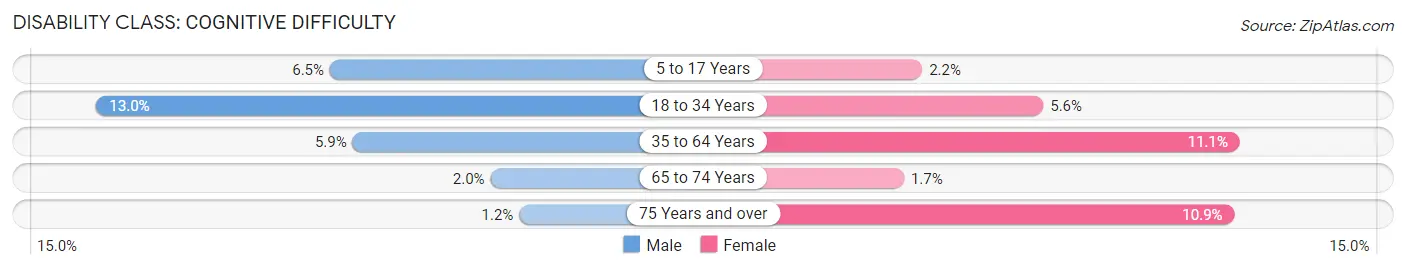
| Age Bracket | Male | Female |
| 5 to 17 Years | 116 (6.5%) | 56 (2.2%) |
| 18 to 34 Years | 274 (13.0%) | 104 (5.6%) |
| 35 to 64 Years | 258 (5.9%) | 516 (11.1%) |
| 65 to 74 Years | 17 (2.0%) | 17 (1.7%) |
| 75 Years and over | 6 (1.2%) | 53 (10.9%) |
Disability Class: Ambulatory Difficulty
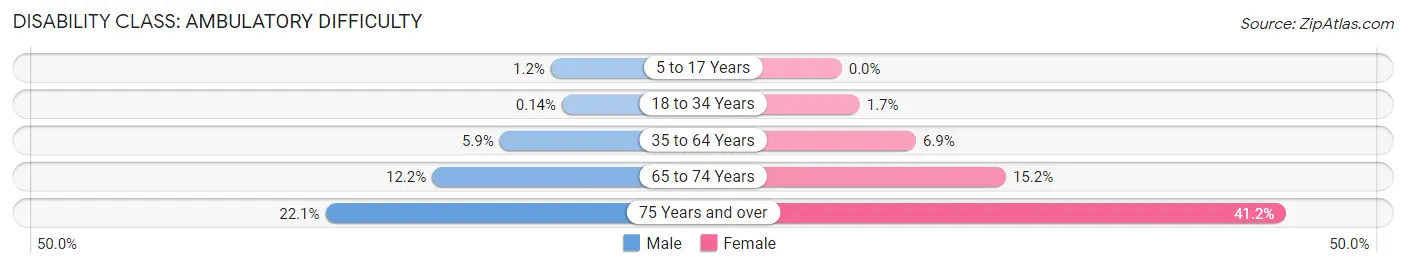
| Age Bracket | Male | Female |
| 5 to 17 Years | 21 (1.2%) | 0 (0.0%) |
| 18 to 34 Years | 3 (0.1%) | 31 (1.7%) |
| 35 to 64 Years | 260 (5.9%) | 321 (6.9%) |
| 65 to 74 Years | 102 (12.2%) | 150 (15.2%) |
| 75 Years and over | 108 (22.1%) | 200 (41.2%) |
Disability Class: Self-Care Difficulty
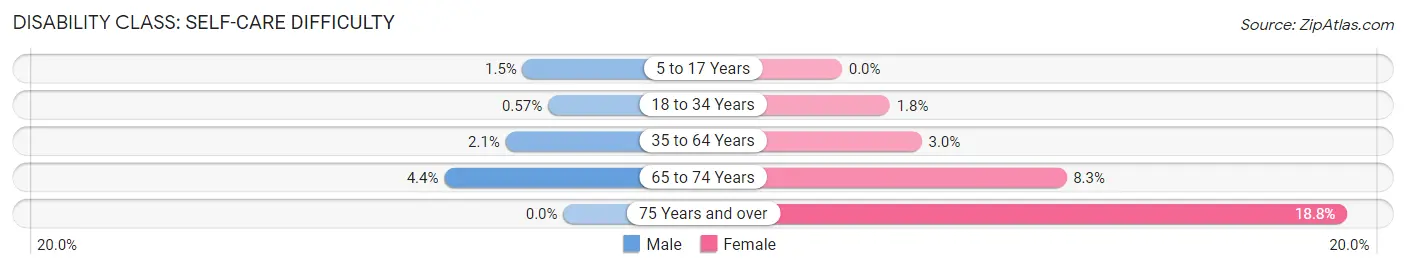
| Age Bracket | Male | Female |
| 5 to 17 Years | 27 (1.5%) | 0 (0.0%) |
| 18 to 34 Years | 12 (0.6%) | 33 (1.8%) |
| 35 to 64 Years | 94 (2.1%) | 138 (3.0%) |
| 65 to 74 Years | 37 (4.4%) | 82 (8.3%) |
| 75 Years and over | 0 (0.0%) | 91 (18.8%) |
Technology Access in Winter Gardens
Computing Device Access in Winter Gardens
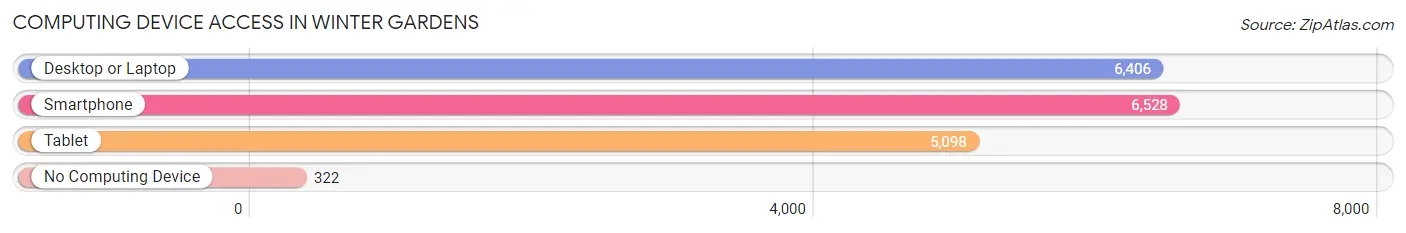
| Device Type | # Households | % Households |
| Desktop or Laptop | 6,406 | 86.2% |
| Smartphone | 6,528 | 87.8% |
| Tablet | 5,098 | 68.6% |
| No Computing Device | 322 | 4.3% |
| Total | 7,435 | 100.0% |
Internet Access in Winter Gardens
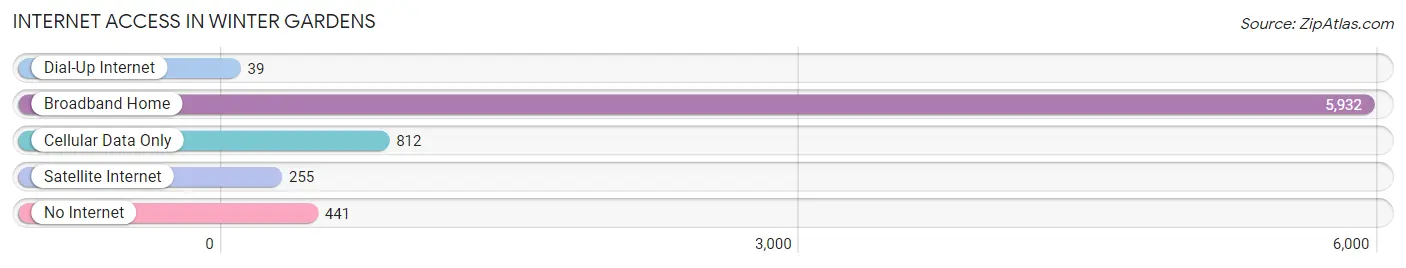
| Internet Type | # Households | % Households |
| Dial-Up Internet | 39 | 0.5% |
| Broadband Home | 5,932 | 79.8% |
| Cellular Data Only | 812 | 10.9% |
| Satellite Internet | 255 | 3.4% |
| No Internet | 441 | 5.9% |
| Total | 7,435 | 100.0% |
Winter Gardens Summary
History
The small town of Winter Gardens, California is located in the San Diego County of Southern California. It is a small, unincorporated community that is part of the larger city of El Cajon. The area was first settled in the late 1800s by a group of settlers from the East Coast. The settlers were attracted to the area due to its mild climate and fertile soil. The area was originally known as “Garden of the Gods” due to its lush vegetation and abundance of wildflowers.
The town was officially founded in 1887 by a group of settlers led by William and Mary Winter. The Winters named the town after their daughter, who had died in a tragic accident. The Winters built a large ranch house and began to cultivate the land. They grew a variety of crops, including citrus, olives, and grapes. The Winters also built a small store and post office, which served as the center of the community.
In the early 1900s, the town began to grow and prosper. The Winters opened a hotel and a general store, and the town became a popular destination for tourists. The town also became a popular spot for movie makers, who used the area as a backdrop for many of their films.
In the 1950s, the town began to decline as the population shifted to larger cities. The town was eventually annexed by the city of El Cajon in the 1970s. Today, the town is a quiet, rural community with a population of just over 1,000 people.
Geography
Winter Gardens is located in the San Diego County of Southern California. It is situated in the foothills of the Cuyamaca Mountains, about 25 miles east of San Diego. The town is bordered by the cities of El Cajon and Lakeside to the north, and by the communities of Jamul and Descanso to the south.
The town is located at an elevation of 1,400 feet above sea level. The climate is mild and temperate, with average temperatures ranging from the mid-50s in the winter to the mid-80s in the summer. The area receives an average of 10 inches of rain per year.
Economy
The economy of Winter Gardens is largely based on agriculture. The town is home to several farms and ranches, which produce a variety of crops, including citrus, olives, and grapes. The town also has a small manufacturing sector, which produces a variety of products, including furniture and clothing.
The town is also home to several small businesses, including restaurants, shops, and a post office. The town is also home to a small airport, which serves as a hub for private and commercial flights.
Demographics
As of the 2010 census, the population of Winter Gardens was 1,072. The racial makeup of the town was 79.3% White, 0.7% African American, 0.3% Native American, 0.7% Asian, 0.1% Pacific Islander, 16.2% from other races, and 2.9% from two or more races. Hispanic or Latino of any race were 33.2% of the population.
The median household income in Winter Gardens was $45,938, and the median family income was $50,938. The per capita income for the town was $20,938. About 11.2% of families and 14.2% of the population were below the poverty line, including 18.2% of those under age 18 and 8.2% of those age 65 or over.
Common Questions
What is Per Capita Income in Winter Gardens?
Per Capita income in Winter Gardens is $37,612.
What is the Median Family Income in Winter Gardens?
Median Family Income in Winter Gardens is $98,083.
What is the Median Household income in Winter Gardens?
Median Household Income in Winter Gardens is $86,009.
What is Income or Wage Gap in Winter Gardens?
Income or Wage Gap in Winter Gardens is 28.4%.
Women in Winter Gardens earn 71.6 cents for every dollar earned by a man.
What is Inequality or Gini Index in Winter Gardens?
Inequality or Gini Index in Winter Gardens is 0.40.
What is the Total Population of Winter Gardens?
Total Population of Winter Gardens is 21,320.
What is the Total Male Population of Winter Gardens?
Total Male Population of Winter Gardens is 10,171.
What is the Total Female Population of Winter Gardens?
Total Female Population of Winter Gardens is 11,149.
What is the Ratio of Males per 100 Females in Winter Gardens?
There are 91.23 Males per 100 Females in Winter Gardens.
What is the Ratio of Females per 100 Males in Winter Gardens?
There are 109.62 Females per 100 Males in Winter Gardens.
What is the Median Population Age in Winter Gardens?
Median Population Age in Winter Gardens is 39.2 Years.
What is the Average Family Size in Winter Gardens
Average Family Size in Winter Gardens is 3.3 People.
What is the Average Household Size in Winter Gardens
Average Household Size in Winter Gardens is 2.8 People.
How Large is the Labor Force in Winter Gardens?
There are 10,911 People in the Labor Forcein in Winter Gardens.
What is the Percentage of People in the Labor Force in Winter Gardens?
64.8% of People are in the Labor Force in Winter Gardens.
What is the Unemployment Rate in Winter Gardens?
Unemployment Rate in Winter Gardens is 7.4%.