Cities with the Highest Percentage of Population with a Degree in Computers and Mathematics in Tennessee
RELATED REPORTS & OPTIONS
Computers and Mathematics
Tennessee
Compare Cities
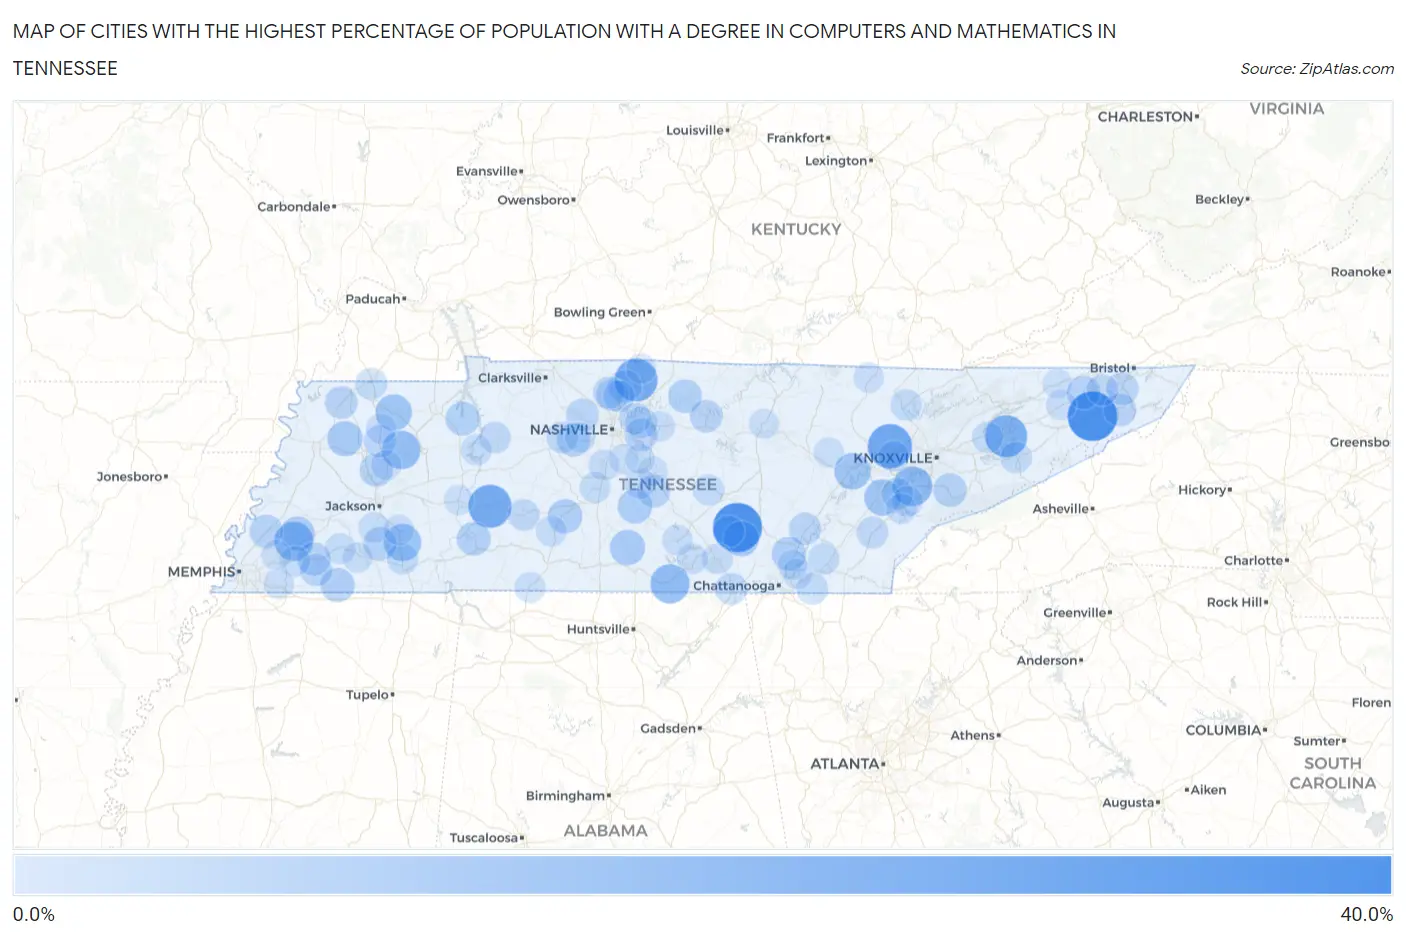
Map of Cities with the Highest Percentage of Population with a Degree in Computers and Mathematics in Tennessee
0.0%
40.0%
Cities with the Highest Percentage of Population with a Degree in Computers and Mathematics in Tennessee
| City | % Graduates | vs State | vs National | |
| 1. | Telford | 39.7% | 3.7%(+36.1)#1 | 4.9%(+34.8)#171 |
| 2. | Beersheba Springs | 38.9% | 3.7%(+35.2)#2 | 4.9%(+34.0)#178 |
| 3. | Oliver Springs | 29.9% | 3.7%(+26.3)#3 | 4.9%(+25.1)#292 |
| 4. | Linden | 27.7% | 3.7%(+24.0)#4 | 4.9%(+22.8)#338 |
| 5. | New Deal | 27.3% | 3.7%(+23.6)#5 | 4.9%(+22.4)#347 |
| 6. | White Pine | 25.8% | 3.7%(+22.1)#6 | 4.9%(+20.9)#389 |
| 7. | Friendsville | 21.2% | 3.7%(+17.5)#7 | 4.9%(+16.3)#552 |
| 8. | Huntland | 20.4% | 3.7%(+16.7)#8 | 4.9%(+15.5)#586 |
| 9. | Braden | 20.0% | 3.7%(+16.3)#9 | 4.9%(+15.1)#600 |
| 10. | Trezevant | 19.3% | 3.7%(+15.6)#10 | 4.9%(+14.4)#656 |
| 11. | Finger | 17.2% | 3.7%(+13.6)#11 | 4.9%(+12.3)#807 |
| 12. | Rockwood | 15.6% | 3.7%(+11.9)#12 | 4.9%(+10.7)#978 |
| 13. | Philadelphia | 15.5% | 3.7%(+11.8)#13 | 4.9%(+10.6)#985 |
| 14. | Dresden | 15.4% | 3.7%(+11.7)#14 | 4.9%(+10.5)#1,001 |
| 15. | Gruetli Laager | 13.6% | 3.7%(+9.96)#15 | 4.9%(+8.74)#1,211 |
| 16. | Petersburg | 13.3% | 3.7%(+9.65)#16 | 4.9%(+8.44)#1,264 |
| 17. | Yorkville | 13.3% | 3.7%(+9.65)#17 | 4.9%(+8.44)#1,266 |
| 18. | Mason | 12.4% | 3.7%(+8.71)#18 | 4.9%(+7.50)#1,461 |
| 19. | Unionville | 12.2% | 3.7%(+8.50)#19 | 4.9%(+7.29)#1,489 |
| 20. | Mount Pleasant | 11.7% | 3.7%(+8.02)#20 | 4.9%(+6.80)#1,606 |
| 21. | Grand Junction | 11.5% | 3.7%(+7.86)#21 | 4.9%(+6.64)#1,640 |
| 22. | Mowbray Mountain | 11.3% | 3.7%(+7.64)#22 | 4.9%(+6.43)#1,693 |
| 23. | Clifton | 11.1% | 3.7%(+7.43)#23 | 4.9%(+6.22)#1,730 |
| 24. | Big Sandy | 10.9% | 3.7%(+7.23)#24 | 4.9%(+6.02)#1,808 |
| 25. | Hartsville Trousdale County | 10.7% | 3.7%(+6.98)#25 | 4.9%(+5.76)#1,891 |
| 26. | Walland | 10.4% | 3.7%(+6.74)#26 | 4.9%(+5.52)#1,978 |
| 27. | Kingston Springs | 10.2% | 3.7%(+6.52)#27 | 4.9%(+5.30)#2,060 |
| 28. | Fall Branch | 10.1% | 3.7%(+6.43)#28 | 4.9%(+5.22)#2,085 |
| 29. | Gibson | 10.0% | 3.7%(+6.32)#29 | 4.9%(+5.11)#2,138 |
| 30. | Silerton | 10.0% | 3.7%(+6.32)#30 | 4.9%(+5.11)#2,161 |
| 31. | Munford | 9.9% | 3.7%(+6.23)#31 | 4.9%(+5.01)#2,190 |
| 32. | Somerville | 9.8% | 3.7%(+6.12)#32 | 4.9%(+4.90)#2,232 |
| 33. | White House | 9.3% | 3.7%(+5.66)#33 | 4.9%(+4.44)#2,456 |
| 34. | Christiana | 9.2% | 3.7%(+5.54)#34 | 4.9%(+4.33)#2,504 |
| 35. | Troy | 9.0% | 3.7%(+5.28)#35 | 4.9%(+4.06)#2,649 |
| 36. | Pine Crest | 8.9% | 3.7%(+5.20)#36 | 4.9%(+3.98)#2,693 |
| 37. | Carthage | 8.8% | 3.7%(+5.14)#37 | 4.9%(+3.92)#2,721 |
| 38. | Rural Hill | 8.8% | 3.7%(+5.13)#38 | 4.9%(+3.91)#2,722 |
| 39. | Graysville | 8.8% | 3.7%(+5.09)#39 | 4.9%(+3.88)#2,743 |
| 40. | Bradford | 8.8% | 3.7%(+5.09)#40 | 4.9%(+3.88)#2,745 |
| 41. | Ashland City | 8.8% | 3.7%(+5.09)#41 | 4.9%(+3.87)#2,752 |
| 42. | Ridgetop | 8.5% | 3.7%(+4.81)#42 | 4.9%(+3.59)#2,895 |
| 43. | Cosby | 8.3% | 3.7%(+4.65)#43 | 4.9%(+3.44)#2,987 |
| 44. | Williston | 8.3% | 3.7%(+4.65)#44 | 4.9%(+3.44)#2,989 |
| 45. | Bluff City | 8.3% | 3.7%(+4.61)#45 | 4.9%(+3.40)#3,030 |
| 46. | South Pittsburg | 7.5% | 3.7%(+3.85)#46 | 4.9%(+2.63)#3,577 |
| 47. | White Bluff | 7.4% | 3.7%(+3.69)#47 | 4.9%(+2.48)#3,696 |
| 48. | Mount Juliet | 7.3% | 3.7%(+3.61)#48 | 4.9%(+2.39)#3,760 |
| 49. | Greenbrier | 7.2% | 3.7%(+3.53)#49 | 4.9%(+2.31)#3,820 |
| 50. | Hohenwald | 7.2% | 3.7%(+3.51)#50 | 4.9%(+2.30)#3,831 |
| 51. | Millersville | 7.2% | 3.7%(+3.50)#51 | 4.9%(+2.29)#3,836 |
| 52. | Englewood | 7.1% | 3.7%(+3.46)#52 | 4.9%(+2.25)#3,861 |
| 53. | Spurgeon | 7.1% | 3.7%(+3.43)#53 | 4.9%(+2.22)#3,924 |
| 54. | Altamont | 7.1% | 3.7%(+3.40)#54 | 4.9%(+2.19)#3,959 |
| 55. | Waverly | 7.0% | 3.7%(+3.34)#55 | 4.9%(+2.13)#4,007 |
| 56. | Tellico Village | 7.0% | 3.7%(+3.31)#56 | 4.9%(+2.09)#4,043 |
| 57. | Bethel Springs | 7.0% | 3.7%(+3.30)#57 | 4.9%(+2.08)#4,052 |
| 58. | Newport | 6.8% | 3.7%(+3.17)#58 | 4.9%(+1.95)#4,181 |
| 59. | Apison | 6.8% | 3.7%(+3.13)#59 | 4.9%(+1.91)#4,212 |
| 60. | South Fulton | 6.8% | 3.7%(+3.11)#60 | 4.9%(+1.89)#4,231 |
| 61. | Hopewell | 6.8% | 3.7%(+3.10)#61 | 4.9%(+1.88)#4,245 |
| 62. | Jacksboro | 6.7% | 3.7%(+3.06)#62 | 4.9%(+1.85)#4,271 |
| 63. | Green Hill | 6.6% | 3.7%(+2.92)#63 | 4.9%(+1.70)#4,440 |
| 64. | Jefferson City | 6.5% | 3.7%(+2.83)#64 | 4.9%(+1.61)#4,552 |
| 65. | Centertown | 6.1% | 3.7%(+2.38)#65 | 4.9%(+1.17)#5,075 |
| 66. | Spring Hill | 6.0% | 3.7%(+2.34)#66 | 4.9%(+1.13)#5,125 |
| 67. | Whiteville | 6.0% | 3.7%(+2.33)#67 | 4.9%(+1.12)#5,138 |
| 68. | New Johnsonville | 5.8% | 3.7%(+2.12)#68 | 4.9%(+0.903)#5,420 |
| 69. | Summertown | 5.7% | 3.7%(+1.98)#69 | 4.9%(+0.766)#5,584 |
| 70. | Greenback | 5.6% | 3.7%(+1.88)#70 | 4.9%(+0.662)#5,744 |
| 71. | Medon | 5.6% | 3.7%(+1.88)#71 | 4.9%(+0.662)#5,771 |
| 72. | Franklin | 5.5% | 3.7%(+1.86)#72 | 4.9%(+0.646)#5,803 |
| 73. | Monteagle | 5.5% | 3.7%(+1.84)#73 | 4.9%(+0.625)#5,827 |
| 74. | Decherd | 5.4% | 3.7%(+1.74)#74 | 4.9%(+0.528)#5,966 |
| 75. | Oak Ridge | 5.4% | 3.7%(+1.69)#75 | 4.9%(+0.477)#6,039 |
| 76. | Rockvale | 5.4% | 3.7%(+1.68)#76 | 4.9%(+0.469)#6,057 |
| 77. | St Joseph | 5.4% | 3.7%(+1.68)#77 | 4.9%(+0.463)#6,068 |
| 78. | Tullahoma | 5.3% | 3.7%(+1.64)#78 | 4.9%(+0.425)#6,127 |
| 79. | Oakland | 5.3% | 3.7%(+1.61)#79 | 4.9%(+0.392)#6,172 |
| 80. | Greenfield | 5.1% | 3.7%(+1.46)#80 | 4.9%(+0.244)#6,439 |
| 81. | Milan | 5.1% | 3.7%(+1.45)#81 | 4.9%(+0.231)#6,468 |
| 82. | Henderson | 5.1% | 3.7%(+1.40)#82 | 4.9%(+0.188)#6,539 |
| 83. | Vonore | 5.1% | 3.7%(+1.40)#83 | 4.9%(+0.184)#6,542 |
| 84. | Collierville | 5.0% | 3.7%(+1.37)#84 | 4.9%(+0.151)#6,601 |
| 85. | Lebanon | 5.0% | 3.7%(+1.34)#85 | 4.9%(+0.124)#6,638 |
| 86. | Oneida | 4.9% | 3.7%(+1.21)#86 | 4.9%(-0.002)#6,864 |
| 87. | Baileyton | 4.8% | 3.7%(+1.16)#87 | 4.9%(-0.055)#6,993 |
| 88. | Harrison | 4.7% | 3.7%(+1.02)#88 | 4.9%(-0.200)#7,286 |
| 89. | Bolivar | 4.7% | 3.7%(+1.00)#89 | 4.9%(-0.214)#7,318 |
| 90. | Fairfield Glade | 4.7% | 3.7%(+0.996)#90 | 4.9%(-0.219)#7,327 |
| 91. | Parsons | 4.6% | 3.7%(+0.957)#91 | 4.9%(-0.258)#7,404 |
| 92. | Algood | 4.5% | 3.7%(+0.834)#92 | 4.9%(-0.382)#7,657 |
| 93. | Nolensville | 4.5% | 3.7%(+0.800)#93 | 4.9%(-0.416)#7,711 |
| 94. | Pegram | 4.5% | 3.7%(+0.782)#94 | 4.9%(-0.433)#7,749 |
| 95. | Murfreesboro | 4.5% | 3.7%(+0.778)#95 | 4.9%(-0.438)#7,758 |
| 96. | Smyrna | 4.5% | 3.7%(+0.776)#96 | 4.9%(-0.439)#7,760 |
| 97. | Portland | 4.4% | 3.7%(+0.752)#97 | 4.9%(-0.464)#7,814 |
| 98. | Lakeland | 4.4% | 3.7%(+0.749)#98 | 4.9%(-0.466)#7,823 |
| 99. | Middle Valley | 4.4% | 3.7%(+0.729)#99 | 4.9%(-0.486)#7,863 |
| 100. | Surgoinsville | 4.4% | 3.7%(+0.683)#100 | 4.9%(-0.533)#7,961 |
Common Questions
What are the Top 10 Cities with the Highest Percentage of Population with a Degree in Computers and Mathematics in Tennessee?
Top 10 Cities with the Highest Percentage of Population with a Degree in Computers and Mathematics in Tennessee are:
#1
39.7%
#2
38.9%
#3
29.9%
#4
27.7%
#5
27.3%
#6
25.8%
#7
21.2%
#8
20.4%
#9
20.0%
#10
19.3%
What city has the Highest Percentage of Population with a Degree in Computers and Mathematics in Tennessee?
Telford has the Highest Percentage of Population with a Degree in Computers and Mathematics in Tennessee with 39.7%.
What is the Percentage of Population with a Degree in Computers and Mathematics in the State of Tennessee?
Percentage of Population with a Degree in Computers and Mathematics in Tennessee is 3.7%.
What is the Percentage of Population with a Degree in Computers and Mathematics in the United States?
Percentage of Population with a Degree in Computers and Mathematics in the United States is 4.9%.