Cities with the Highest Percentage of Population with a Degree in Computers and Mathematics in Wisconsin
RELATED REPORTS & OPTIONS
Computers and Mathematics
Wisconsin
Compare Cities
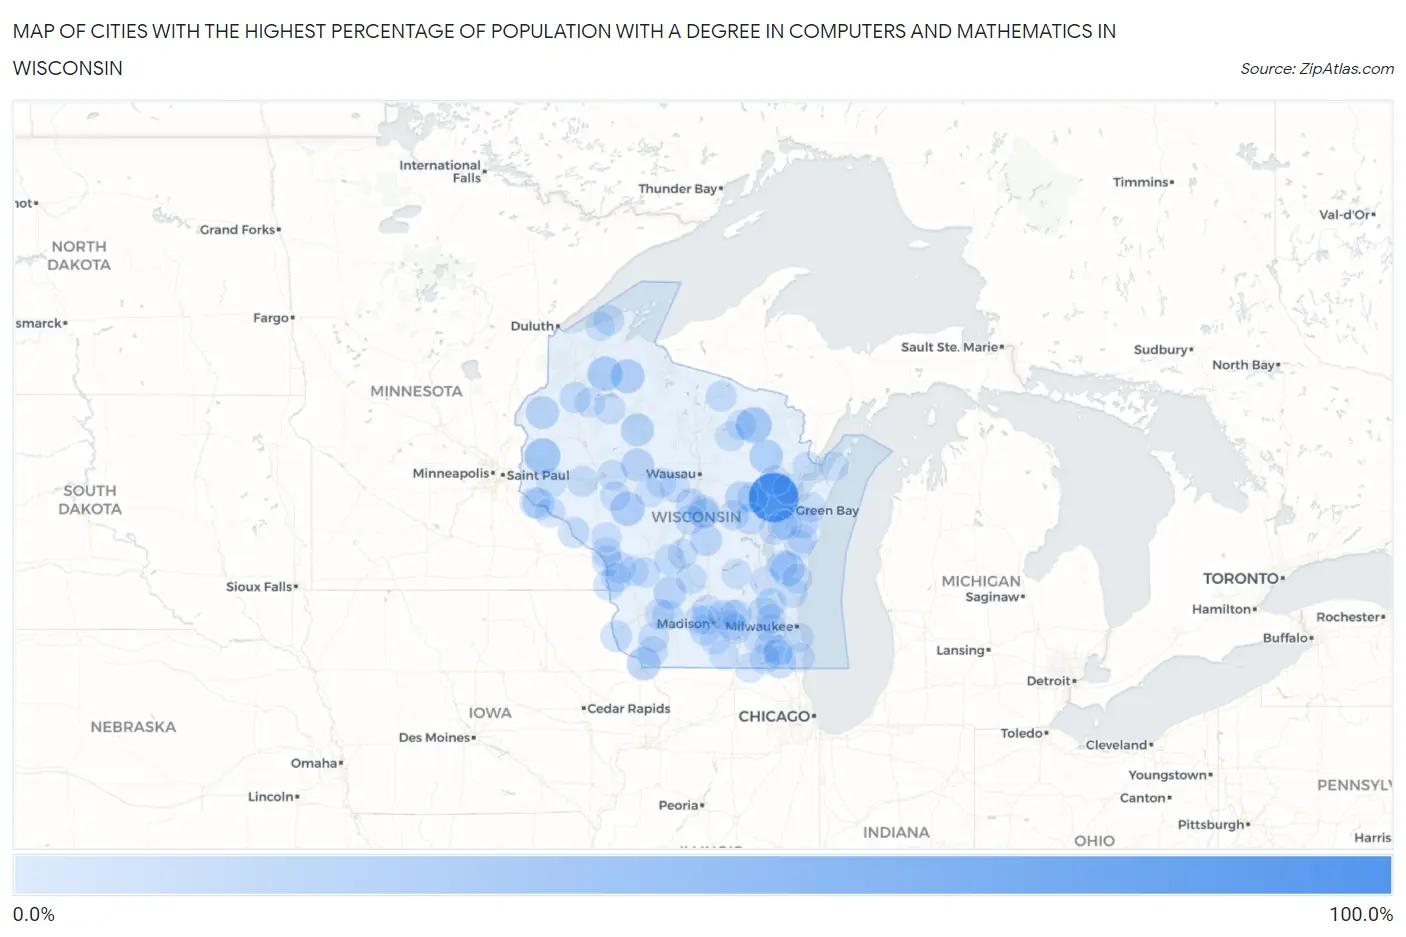
Map of Cities with the Highest Percentage of Population with a Degree in Computers and Mathematics in Wisconsin
0.0%
100.0%
Cities with the Highest Percentage of Population with a Degree in Computers and Mathematics in Wisconsin
| City | % Graduates | vs State | vs National | |
| 1. | Angelica | 100.0% | 3.9%(+96.1)#1 | 4.9%(+95.1)#23 |
| 2. | Laona | 33.3% | 3.9%(+29.4)#2 | 4.9%(+28.4)#232 |
| 3. | Deer Park | 33.3% | 3.9%(+29.4)#3 | 4.9%(+28.4)#239 |
| 4. | Cable | 27.9% | 3.9%(+24.0)#4 | 4.9%(+23.0)#332 |
| 5. | Greenbush | 26.7% | 3.9%(+22.8)#5 | 4.9%(+21.8)#369 |
| 6. | Humbird | 25.0% | 3.9%(+21.1)#6 | 4.9%(+20.1)#409 |
| 7. | Clam Lake | 25.0% | 3.9%(+21.1)#7 | 4.9%(+20.1)#430 |
| 8. | Mountain | 23.1% | 3.9%(+19.2)#8 | 4.9%(+18.2)#477 |
| 9. | Sandy Hook | 21.7% | 3.9%(+17.8)#9 | 4.9%(+16.8)#528 |
| 10. | Hawkins | 20.0% | 3.9%(+16.1)#10 | 4.9%(+15.1)#598 |
| 11. | Lewis | 20.0% | 3.9%(+16.1)#11 | 4.9%(+15.1)#611 |
| 12. | Lublin | 20.0% | 3.9%(+16.1)#12 | 4.9%(+15.1)#618 |
| 13. | Lime Ridge | 18.8% | 3.9%(+14.9)#13 | 4.9%(+13.9)#690 |
| 14. | Marion | 17.1% | 3.9%(+13.2)#14 | 4.9%(+12.2)#823 |
| 15. | Denmark | 15.7% | 3.9%(+11.8)#15 | 4.9%(+10.8)#963 |
| 16. | Whiting | 15.3% | 3.9%(+11.4)#16 | 4.9%(+10.4)#1,005 |
| 17. | Hancock | 15.0% | 3.9%(+11.1)#17 | 4.9%(+10.1)#1,044 |
| 18. | Ashippun | 14.3% | 3.9%(+10.4)#18 | 4.9%(+9.39)#1,110 |
| 19. | Bay City | 14.3% | 3.9%(+10.4)#19 | 4.9%(+9.39)#1,120 |
| 20. | Lily Lake | 13.4% | 3.9%(+9.52)#20 | 4.9%(+8.53)#1,252 |
| 21. | Bagley | 13.2% | 3.9%(+9.34)#21 | 4.9%(+8.34)#1,290 |
| 22. | St Joseph | 12.8% | 3.9%(+8.94)#22 | 4.9%(+7.95)#1,364 |
| 23. | Junction City | 12.8% | 3.9%(+8.87)#23 | 4.9%(+7.87)#1,381 |
| 24. | New Lisbon | 12.5% | 3.9%(+8.60)#24 | 4.9%(+7.61)#1,422 |
| 25. | Cochrane | 12.5% | 3.9%(+8.60)#25 | 4.9%(+7.61)#1,435 |
| 26. | Trego | 12.5% | 3.9%(+8.60)#26 | 4.9%(+7.61)#1,452 |
| 27. | New London | 11.6% | 3.9%(+7.72)#27 | 4.9%(+6.72)#1,622 |
| 28. | Elk Mound | 11.3% | 3.9%(+7.40)#28 | 4.9%(+6.41)#1,698 |
| 29. | Wisconsin Dells | 11.2% | 3.9%(+7.29)#29 | 4.9%(+6.29)#1,716 |
| 30. | Verona | 11.2% | 3.9%(+7.26)#30 | 4.9%(+6.26)#1,720 |
| 31. | Hager City | 10.9% | 3.9%(+7.01)#31 | 4.9%(+6.02)#1,810 |
| 32. | Embarrass | 10.9% | 3.9%(+6.97)#32 | 4.9%(+5.98)#1,831 |
| 33. | Eagle River | 10.6% | 3.9%(+6.73)#33 | 4.9%(+5.73)#1,900 |
| 34. | Waterloo | 10.3% | 3.9%(+6.45)#34 | 4.9%(+5.45)#1,996 |
| 35. | Genoa | 10.3% | 3.9%(+6.45)#35 | 4.9%(+5.45)#2,007 |
| 36. | Hartford | 10.2% | 3.9%(+6.31)#36 | 4.9%(+5.31)#2,051 |
| 37. | Cambridge | 10.1% | 3.9%(+6.22)#37 | 4.9%(+5.23)#2,084 |
| 38. | Lone Rock | 10.0% | 3.9%(+6.10)#38 | 4.9%(+5.11)#2,131 |
| 39. | Ogdensburg | 10.0% | 3.9%(+6.10)#39 | 4.9%(+5.11)#2,152 |
| 40. | French Island | 9.9% | 3.9%(+5.98)#40 | 4.9%(+4.98)#2,205 |
| 41. | Crandon | 9.7% | 3.9%(+5.76)#41 | 4.9%(+4.77)#2,288 |
| 42. | Avoca | 9.5% | 3.9%(+5.62)#42 | 4.9%(+4.63)#2,357 |
| 43. | Radisson | 9.5% | 3.9%(+5.62)#43 | 4.9%(+4.63)#2,363 |
| 44. | Herbster | 9.5% | 3.9%(+5.62)#44 | 4.9%(+4.63)#2,367 |
| 45. | Abrams | 9.4% | 3.9%(+5.48)#45 | 4.9%(+4.48)#2,437 |
| 46. | Livingston | 9.3% | 3.9%(+5.40)#46 | 4.9%(+4.41)#2,469 |
| 47. | Platteville | 9.1% | 3.9%(+5.21)#47 | 4.9%(+4.21)#2,558 |
| 48. | Gillett | 9.1% | 3.9%(+5.19)#48 | 4.9%(+4.20)#2,566 |
| 49. | Plover | 9.0% | 3.9%(+5.09)#49 | 4.9%(+4.09)#2,630 |
| 50. | Waubeka | 9.0% | 3.9%(+5.07)#50 | 4.9%(+4.08)#2,636 |
| 51. | Palmyra | 8.9% | 3.9%(+5.04)#51 | 4.9%(+4.04)#2,659 |
| 52. | Cadott | 8.9% | 3.9%(+5.02)#52 | 4.9%(+4.02)#2,677 |
| 53. | Ontario | 8.8% | 3.9%(+4.92)#53 | 4.9%(+3.93)#2,714 |
| 54. | Luxemburg | 8.8% | 3.9%(+4.90)#54 | 4.9%(+3.90)#2,726 |
| 55. | Wales | 8.8% | 3.9%(+4.87)#55 | 4.9%(+3.88)#2,740 |
| 56. | East Troy | 8.6% | 3.9%(+4.69)#56 | 4.9%(+3.69)#2,846 |
| 57. | Stratford | 8.4% | 3.9%(+4.47)#57 | 4.9%(+3.48)#2,954 |
| 58. | Holmen | 8.4% | 3.9%(+4.47)#58 | 4.9%(+3.47)#2,957 |
| 59. | Marshall | 8.3% | 3.9%(+4.43)#59 | 4.9%(+3.44)#2,973 |
| 60. | Chaseburg | 8.3% | 3.9%(+4.43)#60 | 4.9%(+3.44)#3,004 |
| 61. | Ettrick | 8.2% | 3.9%(+4.30)#61 | 4.9%(+3.30)#3,085 |
| 62. | St Cloud | 8.2% | 3.9%(+4.30)#62 | 4.9%(+3.30)#3,087 |
| 63. | Stockholm | 8.2% | 3.9%(+4.30)#63 | 4.9%(+3.30)#3,090 |
| 64. | Dane | 8.2% | 3.9%(+4.27)#64 | 4.9%(+3.28)#3,102 |
| 65. | Briggsville | 8.0% | 3.9%(+4.10)#65 | 4.9%(+3.11)#3,213 |
| 66. | Unity | 7.9% | 3.9%(+4.00)#66 | 4.9%(+3.00)#3,297 |
| 67. | Como | 7.9% | 3.9%(+3.96)#67 | 4.9%(+2.97)#3,320 |
| 68. | Sharon | 7.8% | 3.9%(+3.89)#68 | 4.9%(+2.90)#3,378 |
| 69. | Stone Lake | 7.7% | 3.9%(+3.79)#69 | 4.9%(+2.80)#3,477 |
| 70. | Deerfield | 7.7% | 3.9%(+3.75)#70 | 4.9%(+2.76)#3,494 |
| 71. | Wisconsin Rapids | 7.6% | 3.9%(+3.70)#71 | 4.9%(+2.70)#3,540 |
| 72. | Hingham | 7.6% | 3.9%(+3.67)#72 | 4.9%(+2.67)#3,555 |
| 73. | Augusta | 7.6% | 3.9%(+3.66)#73 | 4.9%(+2.67)#3,559 |
| 74. | Middleton | 7.5% | 3.9%(+3.61)#74 | 4.9%(+2.62)#3,590 |
| 75. | Batavia | 7.5% | 3.9%(+3.60)#75 | 4.9%(+2.61)#3,598 |
| 76. | Peshtigo | 7.5% | 3.9%(+3.59)#76 | 4.9%(+2.59)#3,601 |
| 77. | Oak Creek | 7.3% | 3.9%(+3.40)#77 | 4.9%(+2.40)#3,753 |
| 78. | Markesan | 7.1% | 3.9%(+3.24)#78 | 4.9%(+2.25)#3,865 |
| 79. | Spring Valley | 7.1% | 3.9%(+3.24)#79 | 4.9%(+2.25)#3,866 |
| 80. | Dellwood | 7.1% | 3.9%(+3.24)#80 | 4.9%(+2.25)#3,878 |
| 81. | Rochester | 7.1% | 3.9%(+3.20)#81 | 4.9%(+2.20)#3,943 |
| 82. | Egg Harbor | 7.0% | 3.9%(+3.13)#82 | 4.9%(+2.13)#4,003 |
| 83. | Greenleaf | 7.0% | 3.9%(+3.12)#83 | 4.9%(+2.12)#4,011 |
| 84. | Chenequa | 6.8% | 3.9%(+2.92)#84 | 4.9%(+1.92)#4,196 |
| 85. | Bayfront | 6.8% | 3.9%(+2.92)#85 | 4.9%(+1.92)#4,204 |
| 86. | Somers | 6.8% | 3.9%(+2.91)#86 | 4.9%(+1.92)#4,211 |
| 87. | Footville | 6.8% | 3.9%(+2.90)#87 | 4.9%(+1.90)#4,223 |
| 88. | Brooklyn | 6.7% | 3.9%(+2.82)#88 | 4.9%(+1.83)#4,293 |
| 89. | Kimberly | 6.7% | 3.9%(+2.82)#89 | 4.9%(+1.82)#4,297 |
| 90. | Cashton | 6.7% | 3.9%(+2.81)#90 | 4.9%(+1.81)#4,308 |
| 91. | Valders | 6.7% | 3.9%(+2.77)#91 | 4.9%(+1.77)#4,346 |
| 92. | Brownsville | 6.7% | 3.9%(+2.77)#92 | 4.9%(+1.77)#4,350 |
| 93. | Port Wing | 6.5% | 3.9%(+2.62)#93 | 4.9%(+1.63)#4,535 |
| 94. | Cross Plains | 6.5% | 3.9%(+2.62)#94 | 4.9%(+1.63)#4,539 |
| 95. | Sun Prairie | 6.5% | 3.9%(+2.62)#95 | 4.9%(+1.62)#4,540 |
| 96. | Whitelaw | 6.5% | 3.9%(+2.59)#96 | 4.9%(+1.60)#4,561 |
| 97. | Post Lake | 6.5% | 3.9%(+2.59)#97 | 4.9%(+1.60)#4,563 |
| 98. | Wrightstown | 6.4% | 3.9%(+2.51)#98 | 4.9%(+1.51)#4,667 |
| 99. | Burlington | 6.3% | 3.9%(+2.44)#99 | 4.9%(+1.45)#4,744 |
| 100. | Loyal | 6.3% | 3.9%(+2.39)#100 | 4.9%(+1.40)#4,782 |
Common Questions
What are the Top 10 Cities with the Highest Percentage of Population with a Degree in Computers and Mathematics in Wisconsin?
Top 10 Cities with the Highest Percentage of Population with a Degree in Computers and Mathematics in Wisconsin are:
What city has the Highest Percentage of Population with a Degree in Computers and Mathematics in Wisconsin?
Angelica has the Highest Percentage of Population with a Degree in Computers and Mathematics in Wisconsin with 100.0%.
What is the Percentage of Population with a Degree in Computers and Mathematics in the State of Wisconsin?
Percentage of Population with a Degree in Computers and Mathematics in Wisconsin is 3.9%.
What is the Percentage of Population with a Degree in Computers and Mathematics in the United States?
Percentage of Population with a Degree in Computers and Mathematics in the United States is 4.9%.