Cities with the Highest Percentage of Population with a Degree in Computers and Mathematics in Montana
RELATED REPORTS & OPTIONS
Computers and Mathematics
Montana
Compare Cities
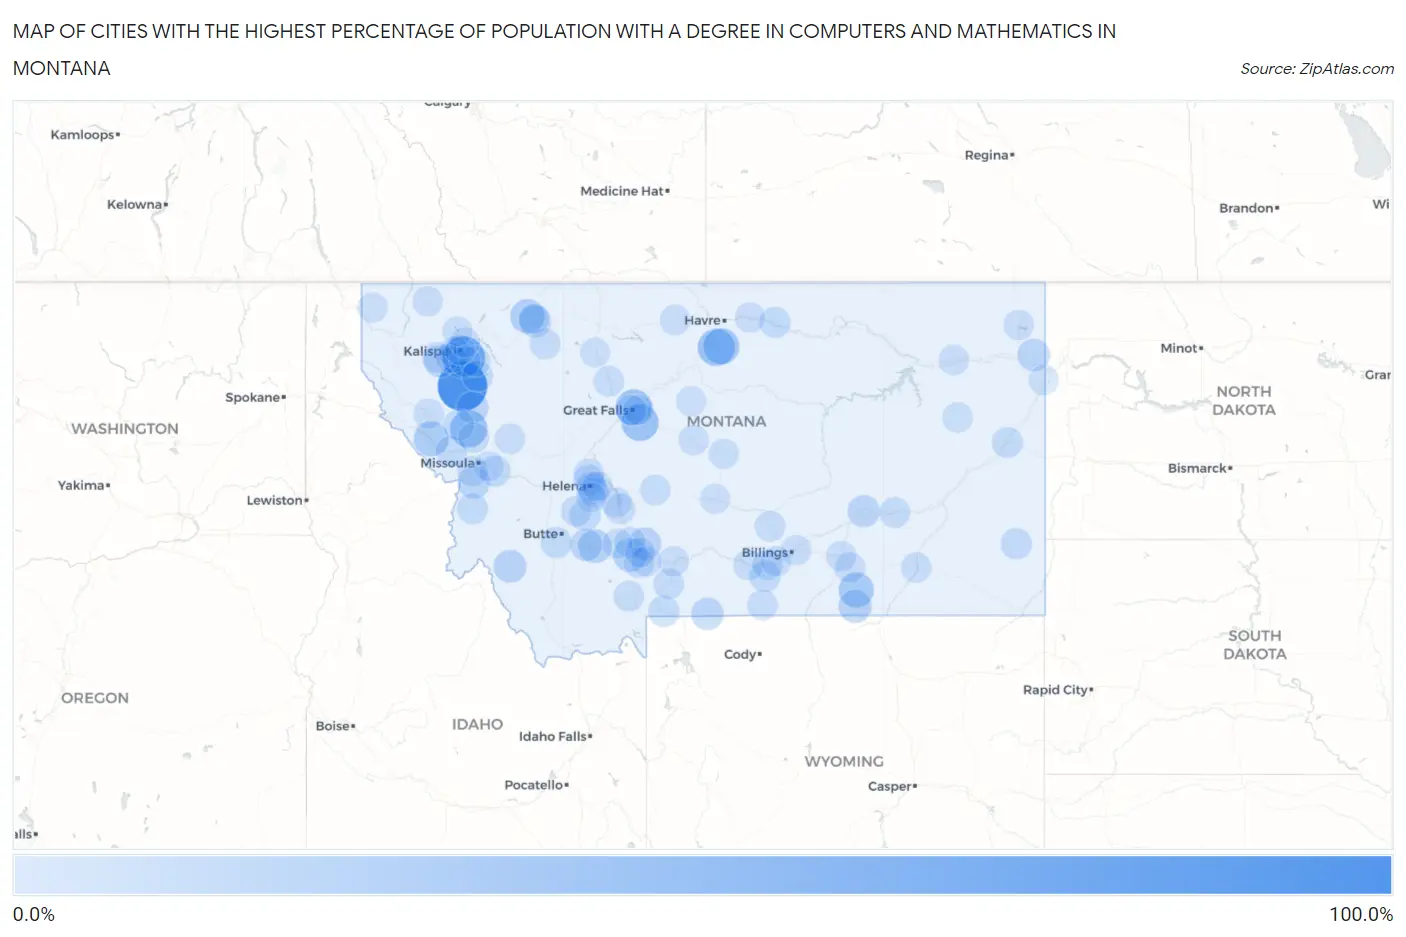
Map of Cities with the Highest Percentage of Population with a Degree in Computers and Mathematics in Montana
0.0%
100.0%
Cities with the Highest Percentage of Population with a Degree in Computers and Mathematics in Montana
| City | % Graduates | vs State | vs National | |
| 1. | Big Arm | 100.0% | 3.1%(+96.9)#1 | 4.9%(+95.1)#19 |
| 2. | Raynesford | 100.0% | 3.1%(+96.9)#2 | 4.9%(+95.1)#30 |
| 3. | Forest Hill Village | 64.0% | 3.1%(+60.9)#3 | 4.9%(+59.1)#62 |
| 4. | Ravalli | 37.0% | 3.1%(+34.0)#4 | 4.9%(+32.1)#199 |
| 5. | St Pierre | 36.4% | 3.1%(+33.3)#5 | 4.9%(+31.5)#203 |
| 6. | Stockett | 36.4% | 3.1%(+33.3)#6 | 4.9%(+31.5)#205 |
| 7. | Black Eagle | 32.8% | 3.1%(+29.7)#7 | 4.9%(+27.9)#259 |
| 8. | Parker School | 31.6% | 3.1%(+28.5)#8 | 4.9%(+26.7)#271 |
| 9. | Lodge Grass | 26.7% | 3.1%(+23.6)#9 | 4.9%(+21.8)#367 |
| 10. | Riverbend | 25.9% | 3.1%(+22.9)#10 | 4.9%(+21.0)#383 |
| 11. | Starr School | 22.7% | 3.1%(+19.7)#11 | 4.9%(+17.8)#492 |
| 12. | Amsterdam | 19.5% | 3.1%(+16.4)#12 | 4.9%(+14.6)#645 |
| 13. | Cardwell | 18.8% | 3.1%(+15.7)#13 | 4.9%(+13.9)#693 |
| 14. | Rockvale | 18.4% | 3.1%(+15.4)#14 | 4.9%(+13.5)#719 |
| 15. | Wyola | 17.4% | 3.1%(+14.3)#15 | 4.9%(+12.5)#801 |
| 16. | Unionville | 17.1% | 3.1%(+14.0)#16 | 4.9%(+12.2)#826 |
| 17. | Wisdom | 15.4% | 3.1%(+12.3)#17 | 4.9%(+10.5)#999 |
| 18. | Springhill | 14.8% | 3.1%(+11.7)#18 | 4.9%(+9.86)#1,061 |
| 19. | South Browning | 13.7% | 3.1%(+10.6)#19 | 4.9%(+8.79)#1,207 |
| 20. | Bainville | 13.3% | 3.1%(+10.3)#20 | 4.9%(+8.44)#1,277 |
| 21. | Florence | 13.1% | 3.1%(+10.0)#21 | 4.9%(+8.19)#1,319 |
| 22. | Silver Gate | 13.0% | 3.1%(+9.97)#22 | 4.9%(+8.15)#1,332 |
| 23. | Hysham | 12.9% | 3.1%(+9.83)#23 | 4.9%(+8.01)#1,359 |
| 24. | Ronan | 12.6% | 3.1%(+9.48)#24 | 4.9%(+7.66)#1,414 |
| 25. | Whitehall | 12.4% | 3.1%(+9.37)#25 | 4.9%(+7.55)#1,457 |
| 26. | Marion | 12.1% | 3.1%(+9.00)#26 | 4.9%(+7.17)#1,514 |
| 27. | Boulder | 9.1% | 3.1%(+6.07)#27 | 4.9%(+4.24)#2,550 |
| 28. | Batavia | 9.0% | 3.1%(+5.95)#28 | 4.9%(+4.13)#2,612 |
| 29. | Clinton | 8.5% | 3.1%(+5.44)#29 | 4.9%(+3.62)#2,887 |
| 30. | Ekalaka | 8.5% | 3.1%(+5.41)#30 | 4.9%(+3.58)#2,904 |
| 31. | Joliet | 8.3% | 3.1%(+5.19)#31 | 4.9%(+3.37)#3,054 |
| 32. | Harlem | 8.1% | 3.1%(+5.00)#32 | 4.9%(+3.17)#3,174 |
| 33. | Gardiner | 7.9% | 3.1%(+4.87)#33 | 4.9%(+3.05)#3,255 |
| 34. | Butte Silver Bow Balance | 7.9% | 3.1%(+4.79)#34 | 4.9%(+2.97)#3,317 |
| 35. | Alberton | 7.8% | 3.1%(+4.72)#35 | 4.9%(+2.90)#3,381 |
| 36. | Gallatin River Ranch | 7.3% | 3.1%(+4.22)#36 | 4.9%(+2.40)#3,758 |
| 37. | York | 7.2% | 3.1%(+4.12)#37 | 4.9%(+2.30)#3,828 |
| 38. | Glendive | 7.1% | 3.1%(+4.06)#38 | 4.9%(+2.23)#3,910 |
| 39. | Dixon | 7.0% | 3.1%(+3.91)#39 | 4.9%(+2.08)#4,056 |
| 40. | Bear Dance | 6.9% | 3.1%(+3.81)#40 | 4.9%(+1.98)#4,154 |
| 41. | Corvallis | 6.9% | 3.1%(+3.79)#41 | 4.9%(+1.97)#4,168 |
| 42. | Little Bitterroot Lake | 6.5% | 3.1%(+3.45)#42 | 4.9%(+1.63)#4,536 |
| 43. | Heart Butte | 6.5% | 3.1%(+3.38)#43 | 4.9%(+1.56)#4,609 |
| 44. | Arlee | 6.4% | 3.1%(+3.29)#44 | 4.9%(+1.47)#4,720 |
| 45. | Townsend | 6.2% | 3.1%(+3.18)#45 | 4.9%(+1.36)#4,826 |
| 46. | Pinnacle | 6.2% | 3.1%(+3.18)#46 | 4.9%(+1.36)#4,861 |
| 47. | Lolo | 5.8% | 3.1%(+2.69)#47 | 4.9%(+0.867)#5,465 |
| 48. | Columbus | 5.7% | 3.1%(+2.60)#48 | 4.9%(+0.771)#5,575 |
| 49. | Big Sky | 5.6% | 3.1%(+2.56)#49 | 4.9%(+0.737)#5,630 |
| 50. | Kila | 5.5% | 3.1%(+2.41)#50 | 4.9%(+0.585)#5,885 |
| 51. | Bigfork | 5.4% | 3.1%(+2.37)#51 | 4.9%(+0.545)#5,942 |
| 52. | Forsyth | 5.4% | 3.1%(+2.34)#52 | 4.9%(+0.511)#5,980 |
| 53. | Broadview | 5.4% | 3.1%(+2.34)#53 | 4.9%(+0.511)#5,994 |
| 54. | Helena Valley West Central | 5.4% | 3.1%(+2.29)#54 | 4.9%(+0.463)#6,063 |
| 55. | Pray | 5.3% | 3.1%(+2.21)#55 | 4.9%(+0.387)#6,180 |
| 56. | Basin | 5.2% | 3.1%(+2.10)#56 | 4.9%(+0.278)#6,389 |
| 57. | White Sulphur Springs | 5.1% | 3.1%(+2.08)#57 | 4.9%(+0.253)#6,432 |
| 58. | Dutton | 5.1% | 3.1%(+2.06)#58 | 4.9%(+0.234)#6,465 |
| 59. | Somers | 5.1% | 3.1%(+2.04)#59 | 4.9%(+0.216)#6,493 |
| 60. | South Hills | 5.1% | 3.1%(+2.02)#60 | 4.9%(+0.197)#6,522 |
| 61. | Livingston | 4.9% | 3.1%(+1.79)#61 | 4.9%(-0.030)#6,949 |
| 62. | Park City | 4.8% | 3.1%(+1.74)#62 | 4.9%(-0.086)#7,049 |
| 63. | Plains | 4.8% | 3.1%(+1.69)#63 | 4.9%(-0.132)#7,122 |
| 64. | Helena Valley Northwest | 4.7% | 3.1%(+1.68)#64 | 4.9%(-0.145)#7,169 |
| 65. | Four Corners | 4.7% | 3.1%(+1.67)#65 | 4.9%(-0.152)#7,182 |
| 66. | Ashland | 4.7% | 3.1%(+1.65)#66 | 4.9%(-0.177)#7,240 |
| 67. | Belfry | 4.7% | 3.1%(+1.58)#67 | 4.9%(-0.243)#7,381 |
| 68. | The Silos | 4.6% | 3.1%(+1.51)#68 | 4.9%(-0.319)#7,513 |
| 69. | Medicine Lake | 4.4% | 3.1%(+1.37)#69 | 4.9%(-0.450)#7,789 |
| 70. | Circle | 4.4% | 3.1%(+1.31)#70 | 4.9%(-0.514)#7,923 |
| 71. | North Browning | 4.4% | 3.1%(+1.29)#71 | 4.9%(-0.534)#7,962 |
| 72. | Bozeman | 4.3% | 3.1%(+1.25)#72 | 4.9%(-0.572)#8,051 |
| 73. | Montana City | 4.3% | 3.1%(+1.21)#73 | 4.9%(-0.617)#8,153 |
| 74. | Crow Agency | 4.3% | 3.1%(+1.19)#74 | 4.9%(-0.639)#8,192 |
| 75. | Wolf Point | 4.2% | 3.1%(+1.12)#75 | 4.9%(-0.708)#8,349 |
| 76. | Seeley Lake | 4.1% | 3.1%(+1.06)#76 | 4.9%(-0.764)#8,475 |
| 77. | East Helena | 4.1% | 3.1%(+1.05)#77 | 4.9%(-0.770)#8,485 |
| 78. | Helena | 4.1% | 3.1%(+1.00)#78 | 4.9%(-0.820)#8,585 |
| 79. | Malmstrom Afb | 4.1% | 3.1%(+0.997)#79 | 4.9%(-0.828)#8,603 |
| 80. | Lockwood | 4.0% | 3.1%(+0.957)#80 | 4.9%(-0.868)#8,696 |
| 81. | Fortine | 4.0% | 3.1%(+0.931)#81 | 4.9%(-0.894)#8,749 |
| 82. | Hardin | 3.9% | 3.1%(+0.823)#82 | 4.9%(-1.00)#9,012 |
| 83. | Great Falls | 3.9% | 3.1%(+0.792)#83 | 4.9%(-1.03)#9,072 |
| 84. | Belgrade | 3.8% | 3.1%(+0.758)#84 | 4.9%(-1.07)#9,182 |
| 85. | Rudyard | 3.8% | 3.1%(+0.728)#85 | 4.9%(-1.10)#9,247 |
| 86. | Chinook | 3.6% | 3.1%(+0.567)#86 | 4.9%(-1.26)#9,614 |
| 87. | Laurel | 3.5% | 3.1%(+0.471)#87 | 4.9%(-1.35)#9,842 |
| 88. | Stanford | 3.4% | 3.1%(+0.379)#88 | 4.9%(-1.45)#10,070 |
| 89. | Moore | 3.3% | 3.1%(+0.264)#89 | 4.9%(-1.56)#10,378 |
| 90. | Three Forks | 3.2% | 3.1%(+0.175)#90 | 4.9%(-1.65)#10,598 |
| 91. | Sylvanite | 3.2% | 3.1%(+0.156)#91 | 4.9%(-1.67)#10,666 |
| 92. | Conrad | 3.2% | 3.1%(+0.084)#92 | 4.9%(-1.74)#10,829 |
| 93. | Harlowton | 3.0% | 3.1%(-0.039)#93 | 4.9%(-1.86)#11,105 |
| 94. | Clancy | 3.0% | 3.1%(-0.105)#94 | 4.9%(-1.93)#11,263 |
| 95. | Helena Flats | 2.9% | 3.1%(-0.189)#95 | 4.9%(-2.01)#11,471 |
| 96. | Turah | 2.9% | 3.1%(-0.196)#96 | 4.9%(-2.02)#11,492 |
| 97. | Fairview | 2.9% | 3.1%(-0.212)#97 | 4.9%(-2.04)#11,518 |
| 98. | Geraldine | 2.9% | 3.1%(-0.212)#98 | 4.9%(-2.04)#11,533 |
| 99. | Kalispell | 2.7% | 3.1%(-0.381)#99 | 4.9%(-2.21)#11,940 |
| 100. | Whitefish | 2.5% | 3.1%(-0.568)#100 | 4.9%(-2.39)#12,380 |
Common Questions
What are the Top 10 Cities with the Highest Percentage of Population with a Degree in Computers and Mathematics in Montana?
Top 10 Cities with the Highest Percentage of Population with a Degree in Computers and Mathematics in Montana are:
#1
100.0%
#2
64.0%
#3
37.0%
#4
36.4%
#5
36.4%
#6
32.8%
#7
31.6%
#8
26.7%
#9
25.9%
#10
22.7%
What city has the Highest Percentage of Population with a Degree in Computers and Mathematics in Montana?
Big Arm has the Highest Percentage of Population with a Degree in Computers and Mathematics in Montana with 100.0%.
What is the Percentage of Population with a Degree in Computers and Mathematics in the State of Montana?
Percentage of Population with a Degree in Computers and Mathematics in Montana is 3.1%.
What is the Percentage of Population with a Degree in Computers and Mathematics in the United States?
Percentage of Population with a Degree in Computers and Mathematics in the United States is 4.9%.