Cities with the Highest Percentage of Population with a Degree in Computers and Mathematics in Ohio
RELATED REPORTS & OPTIONS
Computers and Mathematics
Ohio
Compare Cities
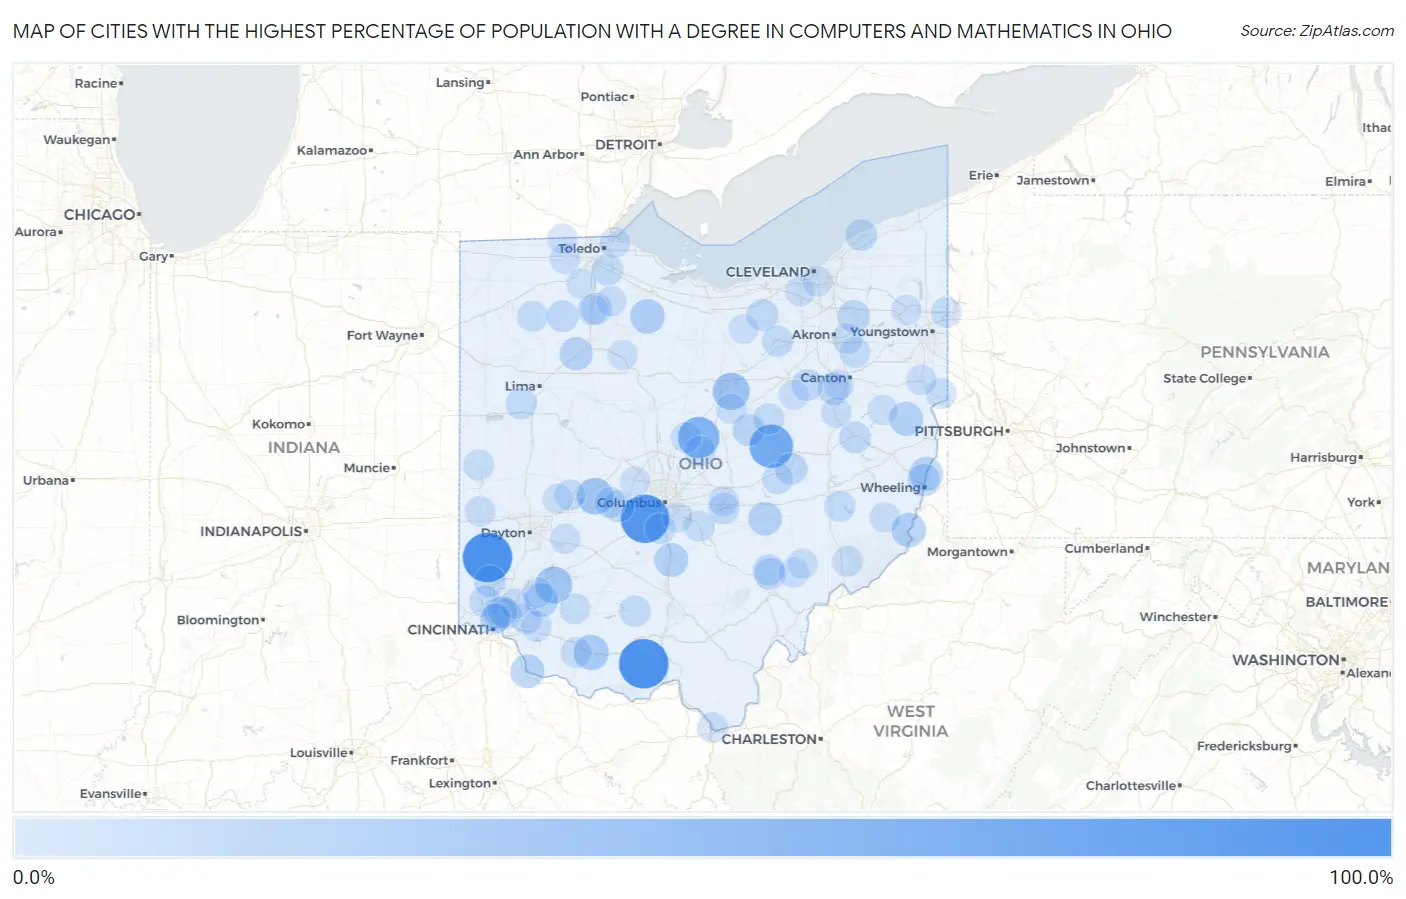
Map of Cities with the Highest Percentage of Population with a Degree in Computers and Mathematics in Ohio
0.0%
100.0%
Cities with the Highest Percentage of Population with a Degree in Computers and Mathematics in Ohio
| City | % Graduates | vs State | vs National | |
| 1. | Brandt | 100.0% | 4.1%(+95.9)#1 | 4.9%(+95.1)#18 |
| 2. | West Elkton | 100.0% | 4.1%(+95.9)#2 | 4.9%(+95.1)#20 |
| 3. | Otway | 100.0% | 4.1%(+95.9)#3 | 4.9%(+95.1)#27 |
| 4. | Darbydale | 94.4% | 4.1%(+90.3)#4 | 4.9%(+89.6)#38 |
| 5. | Nellie | 71.1% | 4.1%(+66.9)#5 | 4.9%(+66.2)#53 |
| 6. | Sparta | 60.0% | 4.1%(+55.9)#6 | 4.9%(+55.1)#70 |
| 7. | Lucas | 40.0% | 4.1%(+35.9)#7 | 4.9%(+35.1)#164 |
| 8. | Clarksville | 39.0% | 4.1%(+34.9)#8 | 4.9%(+34.1)#176 |
| 9. | Catawba | 37.5% | 4.1%(+33.4)#9 | 4.9%(+32.6)#193 |
| 10. | Winchester | 31.9% | 4.1%(+27.8)#10 | 4.9%(+27.1)#268 |
| 11. | Blaine | 31.4% | 4.1%(+27.3)#11 | 4.9%(+26.5)#275 |
| 12. | Fort Seneca | 28.6% | 4.1%(+24.4)#12 | 4.9%(+23.7)#315 |
| 13. | Clarington | 27.8% | 4.1%(+23.6)#13 | 4.9%(+22.9)#337 |
| 14. | Logan Elm Village | 25.6% | 4.1%(+21.5)#14 | 4.9%(+20.7)#394 |
| 15. | Bergholz | 25.5% | 4.1%(+21.4)#15 | 4.9%(+20.6)#395 |
| 16. | Butlerville | 25.0% | 4.1%(+20.9)#16 | 4.9%(+20.1)#416 |
| 17. | Neville | 25.0% | 4.1%(+20.9)#17 | 4.9%(+20.1)#426 |
| 18. | Yorkville | 24.4% | 4.1%(+20.3)#18 | 4.9%(+19.5)#439 |
| 19. | East Fultonham | 24.1% | 4.1%(+20.0)#19 | 4.9%(+19.2)#444 |
| 20. | Rawson | 22.2% | 4.1%(+18.1)#20 | 4.9%(+17.3)#505 |
| 21. | Martins Ferry | 20.0% | 4.1%(+15.9)#21 | 4.9%(+15.1)#592 |
| 22. | Danville | 18.6% | 4.1%(+14.4)#22 | 4.9%(+13.7)#703 |
| 23. | Sugar Bush Knolls | 18.3% | 4.1%(+14.2)#23 | 4.9%(+13.4)#726 |
| 24. | Navarre | 17.9% | 4.1%(+13.8)#24 | 4.9%(+13.0)#751 |
| 25. | Pheasant Run | 16.9% | 4.1%(+12.8)#25 | 4.9%(+12.0)#842 |
| 26. | Conesville | 16.7% | 4.1%(+12.5)#26 | 4.9%(+11.8)#863 |
| 27. | Arlington Heights | 16.4% | 4.1%(+12.3)#27 | 4.9%(+11.5)#886 |
| 28. | Jerry City | 16.2% | 4.1%(+12.1)#28 | 4.9%(+11.3)#906 |
| 29. | Dennison | 16.1% | 4.1%(+12.0)#29 | 4.9%(+11.3)#909 |
| 30. | Jacksonville | 16.1% | 4.1%(+12.0)#30 | 4.9%(+11.2)#915 |
| 31. | Lafayette | 16.0% | 4.1%(+11.9)#31 | 4.9%(+11.1)#934 |
| 32. | Kidron | 15.9% | 4.1%(+11.7)#32 | 4.9%(+11.0)#945 |
| 33. | Deshler | 15.8% | 4.1%(+11.6)#33 | 4.9%(+10.9)#956 |
| 34. | Grand River | 15.7% | 4.1%(+11.6)#34 | 4.9%(+10.8)#957 |
| 35. | New Miami | 15.6% | 4.1%(+11.5)#35 | 4.9%(+10.7)#969 |
| 36. | Bainbridge | 15.4% | 4.1%(+11.3)#36 | 4.9%(+10.5)#989 |
| 37. | Stony Ridge | 15.2% | 4.1%(+11.0)#37 | 4.9%(+10.3)#1,025 |
| 38. | Pleasant Run | 15.0% | 4.1%(+10.8)#38 | 4.9%(+10.1)#1,048 |
| 39. | Glouster | 14.5% | 4.1%(+10.4)#39 | 4.9%(+9.62)#1,081 |
| 40. | Fairfield Beach | 14.4% | 4.1%(+10.3)#40 | 4.9%(+9.50)#1,101 |
| 41. | Buckland | 14.3% | 4.1%(+10.2)#41 | 4.9%(+9.39)#1,127 |
| 42. | Lodi | 14.2% | 4.1%(+10.1)#42 | 4.9%(+9.30)#1,144 |
| 43. | Senecaville | 13.6% | 4.1%(+9.50)#43 | 4.9%(+8.74)#1,214 |
| 44. | Glenmont | 13.6% | 4.1%(+9.50)#44 | 4.9%(+8.74)#1,216 |
| 45. | Medway | 13.5% | 4.1%(+9.38)#45 | 4.9%(+8.62)#1,236 |
| 46. | Choctaw Lake | 12.9% | 4.1%(+8.77)#46 | 4.9%(+8.01)#1,356 |
| 47. | Dresden | 12.8% | 4.1%(+8.67)#47 | 4.9%(+7.91)#1,373 |
| 48. | Bidwell | 12.8% | 4.1%(+8.67)#48 | 4.9%(+7.91)#1,374 |
| 49. | Commercial Point | 12.7% | 4.1%(+8.56)#49 | 4.9%(+7.80)#1,389 |
| 50. | Hartville | 12.5% | 4.1%(+8.39)#50 | 4.9%(+7.63)#1,419 |
| 51. | Tremont City | 12.5% | 4.1%(+8.37)#51 | 4.9%(+7.61)#1,439 |
| 52. | New Bavaria | 12.5% | 4.1%(+8.37)#52 | 4.9%(+7.61)#1,451 |
| 53. | Lynchburg | 12.3% | 4.1%(+8.17)#53 | 4.9%(+7.41)#1,470 |
| 54. | Calcutta | 12.2% | 4.1%(+8.09)#54 | 4.9%(+7.33)#1,484 |
| 55. | Lake Waynoka | 12.0% | 4.1%(+7.84)#55 | 4.9%(+7.08)#1,536 |
| 56. | Ansonia | 11.9% | 4.1%(+7.73)#56 | 4.9%(+6.97)#1,554 |
| 57. | South Point | 11.8% | 4.1%(+7.69)#57 | 4.9%(+6.93)#1,563 |
| 58. | Lower Salem | 11.8% | 4.1%(+7.63)#58 | 4.9%(+6.87)#1,589 |
| 59. | Centerburg | 11.7% | 4.1%(+7.57)#59 | 4.9%(+6.81)#1,601 |
| 60. | Mogadore | 11.7% | 4.1%(+7.52)#60 | 4.9%(+6.76)#1,613 |
| 61. | Carroll | 11.5% | 4.1%(+7.40)#61 | 4.9%(+6.64)#1,638 |
| 62. | Day Heights | 11.4% | 4.1%(+7.29)#62 | 4.9%(+6.53)#1,665 |
| 63. | West Manchester | 11.4% | 4.1%(+7.29)#63 | 4.9%(+6.53)#1,666 |
| 64. | West Hill | 11.3% | 4.1%(+7.20)#64 | 4.9%(+6.44)#1,689 |
| 65. | Deer Park | 11.1% | 4.1%(+7.00)#65 | 4.9%(+6.24)#1,726 |
| 66. | Marengo | 11.1% | 4.1%(+6.98)#66 | 4.9%(+6.22)#1,750 |
| 67. | Parral | 11.1% | 4.1%(+6.98)#67 | 4.9%(+6.22)#1,762 |
| 68. | Wilson | 11.1% | 4.1%(+6.98)#68 | 4.9%(+6.22)#1,766 |
| 69. | Harbor View | 11.1% | 4.1%(+6.98)#69 | 4.9%(+6.22)#1,767 |
| 70. | Owensville | 10.8% | 4.1%(+6.71)#70 | 4.9%(+5.95)#1,838 |
| 71. | Lisbon | 10.8% | 4.1%(+6.71)#71 | 4.9%(+5.95)#1,840 |
| 72. | Ridgewood | 10.7% | 4.1%(+6.61)#72 | 4.9%(+5.85)#1,859 |
| 73. | Carrollton | 10.6% | 4.1%(+6.45)#73 | 4.9%(+5.69)#1,918 |
| 74. | Richville | 10.6% | 4.1%(+6.43)#74 | 4.9%(+5.67)#1,925 |
| 75. | Cygnet | 10.5% | 4.1%(+6.39)#75 | 4.9%(+5.63)#1,938 |
| 76. | Reading | 10.5% | 4.1%(+6.34)#76 | 4.9%(+5.58)#1,959 |
| 77. | Swanton | 10.5% | 4.1%(+6.32)#77 | 4.9%(+5.56)#1,964 |
| 78. | Reedurban | 10.4% | 4.1%(+6.24)#78 | 4.9%(+5.48)#1,992 |
| 79. | Wayne | 10.1% | 4.1%(+6.01)#79 | 4.9%(+5.25)#2,076 |
| 80. | Metamora | 10.1% | 4.1%(+5.98)#80 | 4.9%(+5.22)#2,086 |
| 81. | Sixteen Mile Stand | 10.0% | 4.1%(+5.90)#81 | 4.9%(+5.14)#2,109 |
| 82. | Leavittsburg | 10.0% | 4.1%(+5.87)#82 | 4.9%(+5.11)#2,127 |
| 83. | Hebron | 9.9% | 4.1%(+5.80)#83 | 4.9%(+5.04)#2,181 |
| 84. | Butler | 9.7% | 4.1%(+5.57)#84 | 4.9%(+4.81)#2,261 |
| 85. | Chesterhill | 9.7% | 4.1%(+5.54)#85 | 4.9%(+4.78)#2,284 |
| 86. | Cuyahoga Heights | 9.6% | 4.1%(+5.50)#86 | 4.9%(+4.74)#2,302 |
| 87. | Middleburg Heights | 9.6% | 4.1%(+5.46)#87 | 4.9%(+4.70)#2,319 |
| 88. | Wilberforce | 9.6% | 4.1%(+5.43)#88 | 4.9%(+4.67)#2,330 |
| 89. | Stockport | 9.5% | 4.1%(+5.39)#89 | 4.9%(+4.63)#2,355 |
| 90. | Tontogany | 9.4% | 4.1%(+5.24)#90 | 4.9%(+4.48)#2,435 |
| 91. | Morrow | 9.4% | 4.1%(+5.23)#91 | 4.9%(+4.47)#2,443 |
| 92. | North Hampton | 9.3% | 4.1%(+5.13)#92 | 4.9%(+4.37)#2,490 |
| 93. | Elmwood Place | 9.2% | 4.1%(+5.03)#93 | 4.9%(+4.27)#2,530 |
| 94. | Carey | 9.2% | 4.1%(+5.02)#94 | 4.9%(+4.26)#2,534 |
| 95. | Fredericksburg | 9.1% | 4.1%(+4.96)#95 | 4.9%(+4.20)#2,577 |
| 96. | St Bernard | 9.0% | 4.1%(+4.88)#96 | 4.9%(+4.12)#2,614 |
| 97. | Plain City | 8.8% | 4.1%(+4.63)#97 | 4.9%(+3.87)#2,753 |
| 98. | Groveport | 8.8% | 4.1%(+4.62)#98 | 4.9%(+3.86)#2,759 |
| 99. | Gomer | 8.7% | 4.1%(+4.56)#99 | 4.9%(+3.80)#2,796 |
| 100. | Rochester | 8.7% | 4.1%(+4.56)#100 | 4.9%(+3.80)#2,797 |
Common Questions
What are the Top 10 Cities with the Highest Percentage of Population with a Degree in Computers and Mathematics in Ohio?
Top 10 Cities with the Highest Percentage of Population with a Degree in Computers and Mathematics in Ohio are:
#1
100.0%
#2
100.0%
#3
94.4%
#4
71.1%
#5
60.0%
#6
40.0%
#7
39.0%
#8
37.5%
#9
31.9%
#10
28.6%
What city has the Highest Percentage of Population with a Degree in Computers and Mathematics in Ohio?
West Elkton has the Highest Percentage of Population with a Degree in Computers and Mathematics in Ohio with 100.0%.
What is the Percentage of Population with a Degree in Computers and Mathematics in the State of Ohio?
Percentage of Population with a Degree in Computers and Mathematics in Ohio is 4.1%.
What is the Percentage of Population with a Degree in Computers and Mathematics in the United States?
Percentage of Population with a Degree in Computers and Mathematics in the United States is 4.9%.