Cities with the Highest Percentage of Population with a Degree in Computers and Mathematics in Colorado
RELATED REPORTS & OPTIONS
Computers and Mathematics
Colorado
Compare Cities
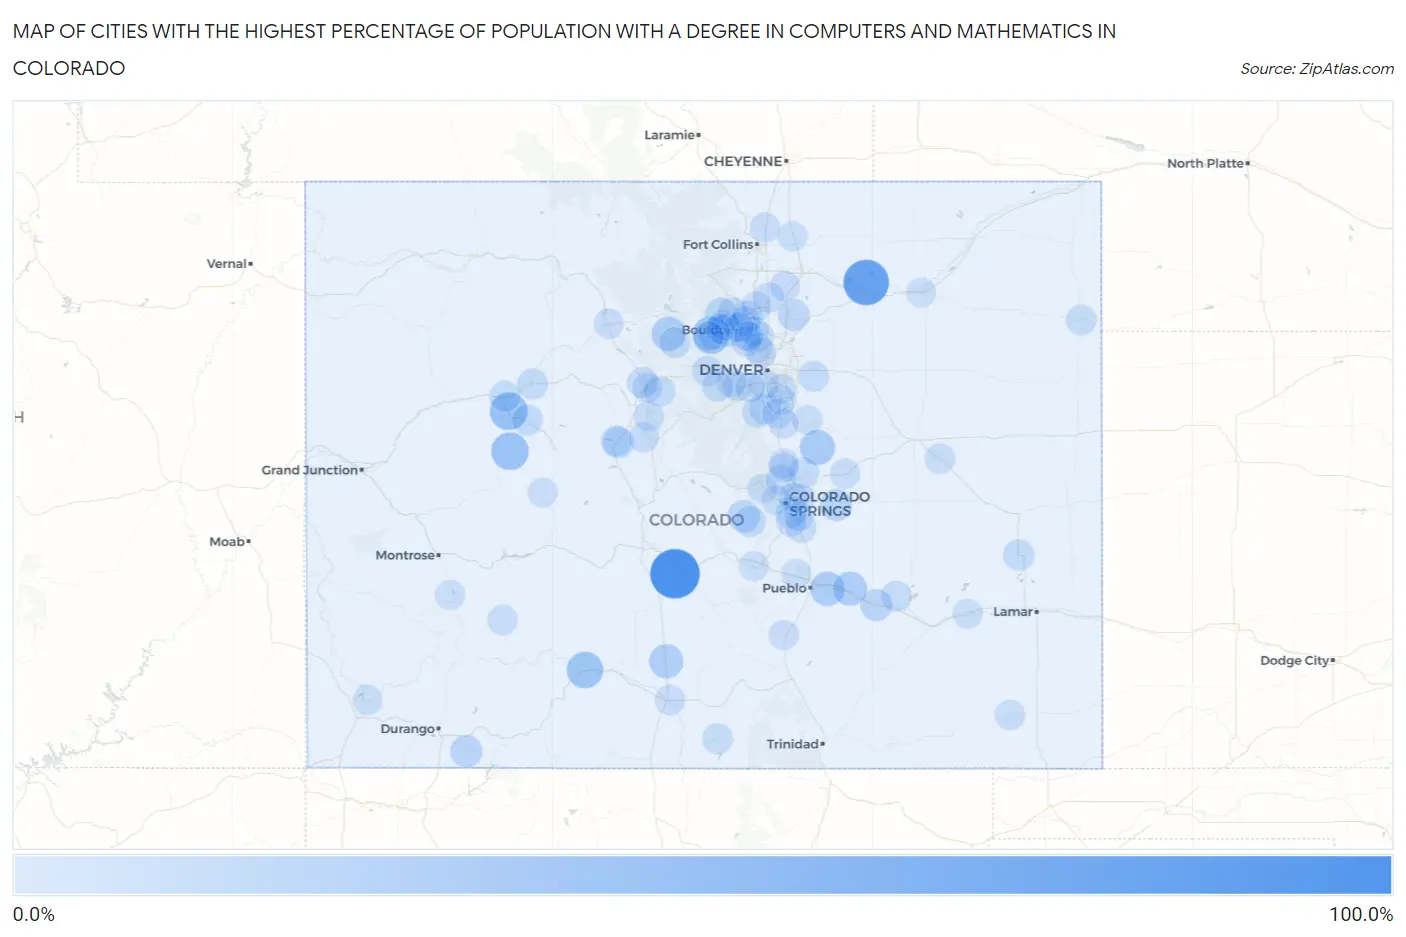
Map of Cities with the Highest Percentage of Population with a Degree in Computers and Mathematics in Colorado
0.0%
100.0%
Cities with the Highest Percentage of Population with a Degree in Computers and Mathematics in Colorado
| City | % Graduates | vs State | vs National | |
| 1. | Coaldale | 100.0% | 5.2%(+94.8)#1 | 4.9%(+95.1)#11 |
| 2. | Orchard | 80.0% | 5.2%(+74.8)#2 | 4.9%(+75.1)#41 |
| 3. | Cattle Creek | 42.6% | 5.2%(+37.4)#3 | 4.9%(+37.7)#148 |
| 4. | Redstone | 41.0% | 5.2%(+35.9)#4 | 4.9%(+36.1)#156 |
| 5. | Bonanza Mountain Estates | 40.9% | 5.2%(+35.7)#5 | 4.9%(+36.0)#158 |
| 6. | Alpine | 36.3% | 5.2%(+31.1)#6 | 4.9%(+31.4)#206 |
| 7. | Elbert | 29.2% | 5.2%(+24.0)#7 | 4.9%(+24.3)#302 |
| 8. | Vineland | 26.6% | 5.2%(+21.4)#8 | 4.9%(+21.7)#370 |
| 9. | Tabernash | 25.5% | 5.2%(+20.3)#9 | 4.9%(+20.6)#397 |
| 10. | Boone | 25.0% | 5.2%(+19.8)#10 | 4.9%(+20.1)#414 |
| 11. | Hooper | 25.0% | 5.2%(+19.8)#11 | 4.9%(+20.1)#419 |
| 12. | Tall Timber | 20.6% | 5.2%(+15.4)#12 | 4.9%(+15.7)#572 |
| 13. | Cripple Creek | 17.9% | 5.2%(+12.7)#13 | 4.9%(+13.0)#758 |
| 14. | Sierra Ridge | 17.8% | 5.2%(+12.6)#14 | 4.9%(+12.9)#769 |
| 15. | Ignacio | 16.4% | 5.2%(+11.3)#15 | 4.9%(+11.6)#884 |
| 16. | Ellicott | 16.3% | 5.2%(+11.2)#16 | 4.9%(+11.4)#896 |
| 17. | Fowler | 15.2% | 5.2%(+10.1)#17 | 4.9%(+10.3)#1,014 |
| 18. | Aristocrat Ranchettes | 14.5% | 5.2%(+9.35)#18 | 4.9%(+9.62)#1,080 |
| 19. | St Ann Highlands | 14.4% | 5.2%(+9.28)#19 | 4.9%(+9.55)#1,093 |
| 20. | Jamestown | 14.3% | 5.2%(+9.12)#20 | 4.9%(+9.39)#1,124 |
| 21. | Leadville | 13.2% | 5.2%(+8.06)#21 | 4.9%(+8.33)#1,291 |
| 22. | Louviers | 13.2% | 5.2%(+8.04)#22 | 4.9%(+8.31)#1,296 |
| 23. | No Name | 11.5% | 5.2%(+6.31)#23 | 4.9%(+6.58)#1,658 |
| 24. | Keystone | 11.4% | 5.2%(+6.21)#24 | 4.9%(+6.48)#1,679 |
| 25. | Victor | 11.3% | 5.2%(+6.12)#25 | 4.9%(+6.40)#1,701 |
| 26. | Stratmoor | 11.2% | 5.2%(+6.05)#26 | 4.9%(+6.32)#1,711 |
| 27. | Eads | 11.1% | 5.2%(+5.94)#27 | 4.9%(+6.22)#1,737 |
| 28. | Valmont | 11.1% | 5.2%(+5.94)#28 | 4.9%(+6.22)#1,772 |
| 29. | El Jebel | 10.7% | 5.2%(+5.51)#29 | 4.9%(+5.78)#1,884 |
| 30. | Fraser | 10.7% | 5.2%(+5.49)#30 | 4.9%(+5.76)#1,892 |
| 31. | Dotsero | 10.4% | 5.2%(+5.21)#31 | 4.9%(+5.48)#1,991 |
| 32. | Watkins | 10.3% | 5.2%(+5.18)#32 | 4.9%(+5.45)#1,999 |
| 33. | Silverthorne | 10.3% | 5.2%(+5.11)#33 | 4.9%(+5.39)#2,025 |
| 34. | San Luis | 10.0% | 5.2%(+4.83)#34 | 4.9%(+5.11)#2,137 |
| 35. | Crowley | 10.0% | 5.2%(+4.83)#35 | 4.9%(+5.11)#2,151 |
| 36. | Leadville North | 9.8% | 5.2%(+4.64)#36 | 4.9%(+4.91)#2,229 |
| 37. | Upper Bear Creek | 9.6% | 5.2%(+4.39)#37 | 4.9%(+4.66)#2,338 |
| 38. | Mead | 9.6% | 5.2%(+4.38)#38 | 4.9%(+4.66)#2,340 |
| 39. | Crisman | 9.3% | 5.2%(+4.11)#39 | 4.9%(+4.38)#2,478 |
| 40. | Paragon Estates | 9.2% | 5.2%(+4.07)#40 | 4.9%(+4.34)#2,497 |
| 41. | Black Forest | 9.2% | 5.2%(+4.04)#41 | 4.9%(+4.32)#2,512 |
| 42. | Fountain | 9.2% | 5.2%(+4.02)#42 | 4.9%(+4.30)#2,521 |
| 43. | Niwot | 9.1% | 5.2%(+3.98)#43 | 4.9%(+4.25)#2,542 |
| 44. | Wray | 9.1% | 5.2%(+3.94)#44 | 4.9%(+4.22)#2,555 |
| 45. | Altona | 9.0% | 5.2%(+3.84)#45 | 4.9%(+4.11)#2,621 |
| 46. | Sterling Ranch | 9.0% | 5.2%(+3.79)#46 | 4.9%(+4.06)#2,647 |
| 47. | Air Force Academy | 8.9% | 5.2%(+3.73)#47 | 4.9%(+4.01)#2,683 |
| 48. | Gunbarrel | 8.9% | 5.2%(+3.73)#48 | 4.9%(+4.00)#2,685 |
| 49. | Sheridan | 8.7% | 5.2%(+3.58)#49 | 4.9%(+3.85)#2,764 |
| 50. | Hugo | 8.7% | 5.2%(+3.49)#50 | 4.9%(+3.77)#2,809 |
| 51. | Idaho Springs | 8.4% | 5.2%(+3.22)#51 | 4.9%(+3.49)#2,945 |
| 52. | Superior | 8.4% | 5.2%(+3.22)#52 | 4.9%(+3.49)#2,949 |
| 53. | Calhan | 8.3% | 5.2%(+3.17)#53 | 4.9%(+3.44)#2,996 |
| 54. | Alamosa East | 8.2% | 5.2%(+3.08)#54 | 4.9%(+3.35)#3,058 |
| 55. | Alma | 8.2% | 5.2%(+3.01)#55 | 4.9%(+3.29)#3,096 |
| 56. | Roxborough Park | 8.0% | 5.2%(+2.85)#56 | 4.9%(+3.12)#3,196 |
| 57. | Briggsdale | 8.0% | 5.2%(+2.83)#57 | 4.9%(+3.11)#3,217 |
| 58. | Milliken | 8.0% | 5.2%(+2.82)#58 | 4.9%(+3.10)#3,224 |
| 59. | Fort Carson | 7.9% | 5.2%(+2.76)#59 | 4.9%(+3.03)#3,270 |
| 60. | Wellington | 7.9% | 5.2%(+2.74)#60 | 4.9%(+3.01)#3,284 |
| 61. | Blue River | 7.8% | 5.2%(+2.67)#61 | 4.9%(+2.95)#3,340 |
| 62. | Woodmoor | 7.8% | 5.2%(+2.67)#62 | 4.9%(+2.94)#3,343 |
| 63. | Placerville | 7.8% | 5.2%(+2.59)#63 | 4.9%(+2.86)#3,402 |
| 64. | Lake City | 7.6% | 5.2%(+2.48)#64 | 4.9%(+2.75)#3,499 |
| 65. | Colorado City | 7.6% | 5.2%(+2.43)#65 | 4.9%(+2.70)#3,542 |
| 66. | Sugarloaf | 7.5% | 5.2%(+2.33)#66 | 4.9%(+2.61)#3,595 |
| 67. | Pritchett | 7.4% | 5.2%(+2.24)#67 | 4.9%(+2.51)#3,671 |
| 68. | Cherry Creek | 7.4% | 5.2%(+2.23)#68 | 4.9%(+2.50)#3,674 |
| 69. | Dillon | 7.4% | 5.2%(+2.20)#69 | 4.9%(+2.48)#3,698 |
| 70. | Kremmling | 7.3% | 5.2%(+2.17)#70 | 4.9%(+2.45)#3,721 |
| 71. | Cimarron Hills | 7.3% | 5.2%(+2.15)#71 | 4.9%(+2.42)#3,734 |
| 72. | Castle Pines Village | 7.3% | 5.2%(+2.11)#72 | 4.9%(+2.38)#3,765 |
| 73. | Nederland | 7.2% | 5.2%(+2.08)#73 | 4.9%(+2.35)#3,790 |
| 74. | Longmont | 7.1% | 5.2%(+1.95)#74 | 4.9%(+2.23)#3,922 |
| 75. | Dolores | 7.1% | 5.2%(+1.94)#75 | 4.9%(+2.22)#3,926 |
| 76. | Broomfield | 7.1% | 5.2%(+1.94)#76 | 4.9%(+2.21)#3,929 |
| 77. | Monument | 7.1% | 5.2%(+1.91)#77 | 4.9%(+2.18)#3,960 |
| 78. | Indian Hills | 7.1% | 5.2%(+1.90)#78 | 4.9%(+2.18)#3,965 |
| 79. | Pueblo West | 7.0% | 5.2%(+1.88)#79 | 4.9%(+2.15)#3,984 |
| 80. | Brook Forest | 7.0% | 5.2%(+1.84)#80 | 4.9%(+2.11)#4,023 |
| 81. | Mount Crested Butte | 7.0% | 5.2%(+1.80)#81 | 4.9%(+2.08)#4,062 |
| 82. | Lafayette | 7.0% | 5.2%(+1.79)#82 | 4.9%(+2.06)#4,079 |
| 83. | Green Mountain Falls | 6.9% | 5.2%(+1.74)#83 | 4.9%(+2.02)#4,114 |
| 84. | Security Widefield | 6.9% | 5.2%(+1.72)#84 | 4.9%(+1.99)#4,146 |
| 85. | Kittredge | 6.8% | 5.2%(+1.61)#85 | 4.9%(+1.88)#4,246 |
| 86. | Loghill Village | 6.8% | 5.2%(+1.60)#86 | 4.9%(+1.87)#4,253 |
| 87. | Westminster | 6.7% | 5.2%(+1.54)#87 | 4.9%(+1.81)#4,309 |
| 88. | Ponderosa Park | 6.7% | 5.2%(+1.50)#88 | 4.9%(+1.78)#4,337 |
| 89. | Las Animas | 6.7% | 5.2%(+1.50)#89 | 4.9%(+1.77)#4,341 |
| 90. | Lone Tree | 6.7% | 5.2%(+1.50)#90 | 4.9%(+1.77)#4,385 |
| 91. | Colorado Springs | 6.6% | 5.2%(+1.44)#91 | 4.9%(+1.71)#4,431 |
| 92. | Brush | 6.6% | 5.2%(+1.42)#92 | 4.9%(+1.70)#4,447 |
| 93. | Boulder | 6.6% | 5.2%(+1.42)#93 | 4.9%(+1.70)#4,450 |
| 94. | Florence | 6.5% | 5.2%(+1.37)#94 | 4.9%(+1.64)#4,510 |
| 95. | Manitou Springs | 6.5% | 5.2%(+1.33)#95 | 4.9%(+1.60)#4,558 |
| 96. | Shaw Heights | 6.5% | 5.2%(+1.32)#96 | 4.9%(+1.60)#4,564 |
| 97. | Castle Rock | 6.5% | 5.2%(+1.29)#97 | 4.9%(+1.57)#4,598 |
| 98. | Louisville | 6.4% | 5.2%(+1.26)#98 | 4.9%(+1.53)#4,637 |
| 99. | Pierce | 6.4% | 5.2%(+1.24)#99 | 4.9%(+1.52)#4,659 |
| 100. | Dakota Ridge | 6.4% | 5.2%(+1.22)#100 | 4.9%(+1.50)#4,688 |
Common Questions
What are the Top 10 Cities with the Highest Percentage of Population with a Degree in Computers and Mathematics in Colorado?
Top 10 Cities with the Highest Percentage of Population with a Degree in Computers and Mathematics in Colorado are:
#1
100.0%
#2
80.0%
#3
42.6%
#4
41.0%
#5
40.9%
#6
36.3%
#7
29.2%
#8
26.6%
#9
25.5%
#10
25.0%
What city has the Highest Percentage of Population with a Degree in Computers and Mathematics in Colorado?
Coaldale has the Highest Percentage of Population with a Degree in Computers and Mathematics in Colorado with 100.0%.
What is the Percentage of Population with a Degree in Computers and Mathematics in the State of Colorado?
Percentage of Population with a Degree in Computers and Mathematics in Colorado is 5.2%.
What is the Percentage of Population with a Degree in Computers and Mathematics in the United States?
Percentage of Population with a Degree in Computers and Mathematics in the United States is 4.9%.