Cities with the Highest Percentage of Population with a Degree in Computers and Mathematics in Utah
RELATED REPORTS & OPTIONS
Computers and Mathematics
Utah
Compare Cities
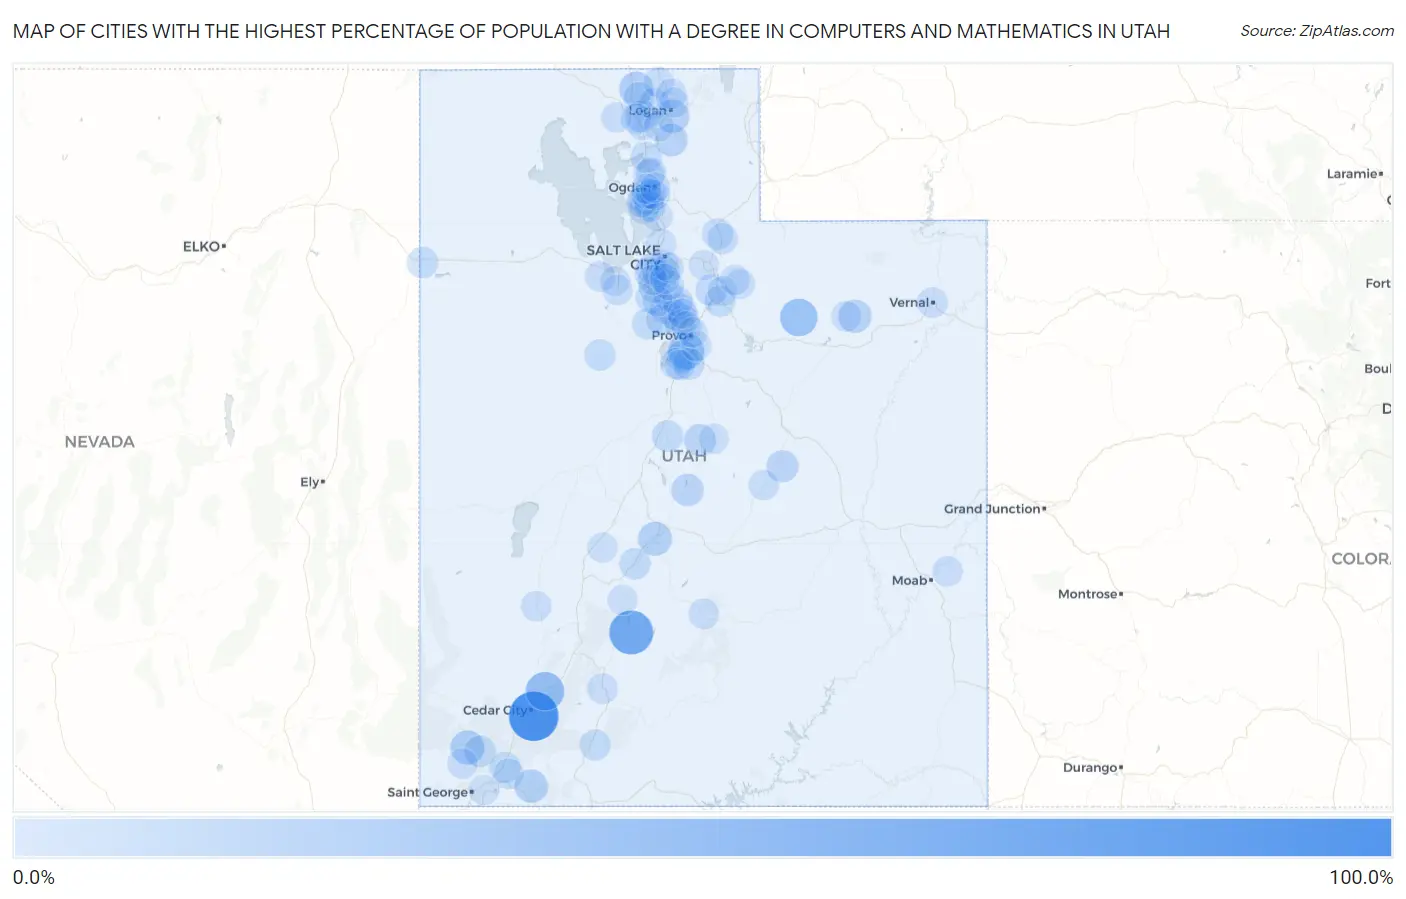
Map of Cities with the Highest Percentage of Population with a Degree in Computers and Mathematics in Utah
0.0%
100.0%
Cities with the Highest Percentage of Population with a Degree in Computers and Mathematics in Utah
| City | % Graduates | vs State | vs National | |
| 1. | Cedar Highlands | 100.0% | 5.5%(+94.5)#1 | 4.9%(+95.1)#36 |
| 2. | Kingston | 71.4% | 5.5%(+65.9)#2 | 4.9%(+66.5)#51 |
| 3. | Summit | 45.5% | 5.5%(+40.0)#3 | 4.9%(+40.6)#133 |
| 4. | Tabiona | 40.0% | 5.5%(+34.5)#4 | 4.9%(+35.1)#165 |
| 5. | Palmyra | 33.9% | 5.5%(+28.4)#5 | 4.9%(+29.0)#227 |
| 6. | Plymouth | 24.0% | 5.5%(+18.5)#6 | 4.9%(+19.1)#445 |
| 7. | Central | 23.5% | 5.5%(+18.0)#7 | 4.9%(+18.6)#461 |
| 8. | Sigurd | 22.9% | 5.5%(+17.4)#8 | 4.9%(+18.0)#488 |
| 9. | Millville | 20.6% | 5.5%(+15.1)#9 | 4.9%(+15.7)#574 |
| 10. | Rockville | 20.5% | 5.5%(+15.0)#10 | 4.9%(+15.6)#580 |
| 11. | Bluebell | 20.0% | 5.5%(+14.5)#11 | 4.9%(+15.1)#603 |
| 12. | Avon | 18.5% | 5.5%(+13.0)#12 | 4.9%(+13.6)#716 |
| 13. | Sterling | 15.8% | 5.5%(+10.3)#13 | 4.9%(+10.9)#953 |
| 14. | Moroni | 14.3% | 5.5%(+8.79)#14 | 4.9%(+9.39)#1,108 |
| 15. | Cleveland | 14.0% | 5.5%(+8.50)#15 | 4.9%(+9.11)#1,164 |
| 16. | Benjamin | 13.7% | 5.5%(+8.17)#16 | 4.9%(+8.78)#1,209 |
| 17. | Deweyville | 12.7% | 5.5%(+7.20)#17 | 4.9%(+7.80)#1,391 |
| 18. | Interlaken | 12.2% | 5.5%(+6.75)#18 | 4.9%(+7.35)#1,482 |
| 19. | Salem | 11.9% | 5.5%(+6.37)#19 | 4.9%(+6.98)#1,552 |
| 20. | Kearns | 11.9% | 5.5%(+6.37)#20 | 4.9%(+6.97)#1,553 |
| 21. | Pine Valley | 11.8% | 5.5%(+6.27)#21 | 4.9%(+6.87)#1,582 |
| 22. | Elsinore | 11.2% | 5.5%(+5.74)#22 | 4.9%(+6.34)#1,708 |
| 23. | West Mountain | 11.2% | 5.5%(+5.67)#23 | 4.9%(+6.28)#1,718 |
| 24. | Peter | 11.1% | 5.5%(+5.61)#24 | 4.9%(+6.22)#1,754 |
| 25. | Levan | 11.0% | 5.5%(+5.48)#25 | 4.9%(+6.08)#1,792 |
| 26. | Farr West | 10.8% | 5.5%(+5.25)#26 | 4.9%(+5.86)#1,858 |
| 27. | Herriman | 10.6% | 5.5%(+5.14)#27 | 4.9%(+5.74)#1,897 |
| 28. | Vernon | 10.5% | 5.5%(+5.03)#28 | 4.9%(+5.63)#1,943 |
| 29. | Eagle Mountain | 10.4% | 5.5%(+4.91)#29 | 4.9%(+5.52)#1,980 |
| 30. | Wendover | 10.3% | 5.5%(+4.85)#30 | 4.9%(+5.45)#1,998 |
| 31. | Alton | 10.3% | 5.5%(+4.76)#31 | 4.9%(+5.36)#2,037 |
| 32. | Willard | 10.2% | 5.5%(+4.68)#32 | 4.9%(+5.28)#2,067 |
| 33. | Sunset | 10.0% | 5.5%(+4.55)#33 | 4.9%(+5.15)#2,105 |
| 34. | Toquerville | 9.6% | 5.5%(+4.12)#34 | 4.9%(+4.73)#2,307 |
| 35. | Daniel | 9.4% | 5.5%(+3.94)#35 | 4.9%(+4.54)#2,399 |
| 36. | Coalville | 9.1% | 5.5%(+3.59)#36 | 4.9%(+4.20)#2,564 |
| 37. | Clinton | 8.8% | 5.5%(+3.29)#37 | 4.9%(+3.89)#2,730 |
| 38. | Cedar Hills | 8.7% | 5.5%(+3.19)#38 | 4.9%(+3.80)#2,798 |
| 39. | Clearfield | 8.5% | 5.5%(+2.96)#39 | 4.9%(+3.56)#2,920 |
| 40. | Lehi | 8.4% | 5.5%(+2.87)#40 | 4.9%(+3.47)#2,956 |
| 41. | Lindon | 8.2% | 5.5%(+2.73)#41 | 4.9%(+3.34)#3,066 |
| 42. | Hoytsville | 8.1% | 5.5%(+2.61)#42 | 4.9%(+3.21)#3,147 |
| 43. | Murray | 8.1% | 5.5%(+2.57)#43 | 4.9%(+3.18)#3,167 |
| 44. | Vineyard | 8.0% | 5.5%(+2.46)#44 | 4.9%(+3.07)#3,245 |
| 45. | Syracuse | 7.8% | 5.5%(+2.29)#45 | 4.9%(+2.89)#3,383 |
| 46. | South Jordan | 7.7% | 5.5%(+2.25)#46 | 4.9%(+2.85)#3,411 |
| 47. | Saratoga Springs | 7.7% | 5.5%(+2.23)#47 | 4.9%(+2.84)#3,419 |
| 48. | Fielding | 7.7% | 5.5%(+2.19)#48 | 4.9%(+2.80)#3,445 |
| 49. | La Verkin | 7.7% | 5.5%(+2.18)#49 | 4.9%(+2.78)#3,480 |
| 50. | Panguitch | 7.6% | 5.5%(+2.13)#50 | 4.9%(+2.73)#3,517 |
| 51. | Vernal | 7.6% | 5.5%(+2.08)#51 | 4.9%(+2.68)#3,551 |
| 52. | Grantsville | 7.5% | 5.5%(+1.97)#52 | 4.9%(+2.57)#3,615 |
| 53. | Draper | 7.3% | 5.5%(+1.85)#53 | 4.9%(+2.45)#3,716 |
| 54. | West Valley City | 7.3% | 5.5%(+1.84)#54 | 4.9%(+2.44)#3,724 |
| 55. | Tooele | 7.3% | 5.5%(+1.79)#55 | 4.9%(+2.39)#3,762 |
| 56. | Honeyville | 7.3% | 5.5%(+1.77)#56 | 4.9%(+2.37)#3,774 |
| 57. | American Fork | 7.2% | 5.5%(+1.66)#57 | 4.9%(+2.27)#3,846 |
| 58. | Roy | 7.1% | 5.5%(+1.62)#58 | 4.9%(+2.23)#3,919 |
| 59. | Bicknell | 7.0% | 5.5%(+1.52)#59 | 4.9%(+2.12)#4,012 |
| 60. | Trenton | 7.0% | 5.5%(+1.50)#60 | 4.9%(+2.11)#4,026 |
| 61. | Alpine | 7.0% | 5.5%(+1.49)#61 | 4.9%(+2.09)#4,041 |
| 62. | Milford | 7.0% | 5.5%(+1.47)#62 | 4.9%(+2.07)#4,064 |
| 63. | Dammeron Valley | 6.9% | 5.5%(+1.44)#63 | 4.9%(+2.05)#4,094 |
| 64. | Taylorsville | 6.8% | 5.5%(+1.35)#64 | 4.9%(+1.96)#4,179 |
| 65. | Bluffdale | 6.8% | 5.5%(+1.30)#65 | 4.9%(+1.90)#4,221 |
| 66. | Smithfield | 6.8% | 5.5%(+1.27)#66 | 4.9%(+1.87)#4,254 |
| 67. | Washington Terrace | 6.6% | 5.5%(+1.15)#67 | 4.9%(+1.75)#4,391 |
| 68. | Elwood | 6.6% | 5.5%(+1.14)#68 | 4.9%(+1.75)#4,398 |
| 69. | Orem | 6.5% | 5.5%(+1.02)#69 | 4.9%(+1.63)#4,538 |
| 70. | Castle Dale | 6.5% | 5.5%(+1.01)#70 | 4.9%(+1.61)#4,554 |
| 71. | Payson | 6.5% | 5.5%(+0.979)#71 | 4.9%(+1.58)#4,583 |
| 72. | Sandy | 6.5% | 5.5%(+0.954)#72 | 4.9%(+1.56)#4,601 |
| 73. | Thatcher | 6.4% | 5.5%(+0.935)#73 | 4.9%(+1.54)#4,629 |
| 74. | Castle Valley | 6.4% | 5.5%(+0.931)#74 | 4.9%(+1.53)#4,633 |
| 75. | Woodland | 6.4% | 5.5%(+0.902)#75 | 4.9%(+1.51)#4,676 |
| 76. | Springville | 6.2% | 5.5%(+0.735)#76 | 4.9%(+1.34)#4,870 |
| 77. | Pleasant View | 6.1% | 5.5%(+0.630)#77 | 4.9%(+1.23)#4,984 |
| 78. | Altamont | 6.1% | 5.5%(+0.625)#78 | 4.9%(+1.23)#4,991 |
| 79. | South Salt Lake | 6.0% | 5.5%(+0.539)#79 | 4.9%(+1.14)#5,107 |
| 80. | West Point | 6.0% | 5.5%(+0.533)#80 | 4.9%(+1.14)#5,113 |
| 81. | Riverdale | 6.0% | 5.5%(+0.511)#81 | 4.9%(+1.12)#5,144 |
| 82. | Washington | 5.7% | 5.5%(+0.234)#82 | 4.9%(+0.838)#5,500 |
| 83. | Snyderville | 5.7% | 5.5%(+0.164)#83 | 4.9%(+0.768)#5,577 |
| 84. | Marysvale | 5.7% | 5.5%(+0.162)#84 | 4.9%(+0.766)#5,585 |
| 85. | Kaysville | 5.7% | 5.5%(+0.162)#85 | 4.9%(+0.765)#5,592 |
| 86. | Mount Pleasant | 5.6% | 5.5%(+0.147)#86 | 4.9%(+0.751)#5,606 |
| 87. | Provo | 5.6% | 5.5%(+0.136)#87 | 4.9%(+0.740)#5,619 |
| 88. | Ogden | 5.6% | 5.5%(+0.135)#88 | 4.9%(+0.739)#5,628 |
| 89. | North Salt Lake | 5.6% | 5.5%(+0.100)#89 | 4.9%(+0.704)#5,687 |
| 90. | West Jordan | 5.6% | 5.5%(+0.061)#90 | 4.9%(+0.665)#5,734 |
| 91. | Kanosh | 5.6% | 5.5%(+0.058)#91 | 4.9%(+0.662)#5,753 |
| 92. | Heber | 5.6% | 5.5%(+0.054)#92 | 4.9%(+0.658)#5,778 |
| 93. | West Haven | 5.5% | 5.5%(+0.049)#93 | 4.9%(+0.653)#5,785 |
| 94. | Pleasant Grove | 5.5% | 5.5%(+0.034)#94 | 4.9%(+0.638)#5,812 |
| 95. | Francis | 5.5% | 5.5%(-0.015)#95 | 4.9%(+0.588)#5,880 |
| 96. | Millcreek | 5.4% | 5.5%(-0.089)#96 | 4.9%(+0.515)#5,972 |
| 97. | Erda | 5.4% | 5.5%(-0.132)#97 | 4.9%(+0.472)#6,047 |
| 98. | Midvale | 5.4% | 5.5%(-0.134)#98 | 4.9%(+0.470)#6,054 |
| 99. | Wellsville | 5.3% | 5.5%(-0.218)#99 | 4.9%(+0.386)#6,181 |
| 100. | North Logan | 5.3% | 5.5%(-0.231)#100 | 4.9%(+0.373)#6,198 |
Common Questions
What are the Top 10 Cities with the Highest Percentage of Population with a Degree in Computers and Mathematics in Utah?
Top 10 Cities with the Highest Percentage of Population with a Degree in Computers and Mathematics in Utah are:
What city has the Highest Percentage of Population with a Degree in Computers and Mathematics in Utah?
Cedar Highlands has the Highest Percentage of Population with a Degree in Computers and Mathematics in Utah with 100.0%.
What is the Percentage of Population with a Degree in Computers and Mathematics in the State of Utah?
Percentage of Population with a Degree in Computers and Mathematics in Utah is 5.5%.
What is the Percentage of Population with a Degree in Computers and Mathematics in the United States?
Percentage of Population with a Degree in Computers and Mathematics in the United States is 4.9%.