Cities with the Highest Percentage of Population with a Degree in Computers and Mathematics in Alabama
RELATED REPORTS & OPTIONS
Computers and Mathematics
Alabama
Compare Cities
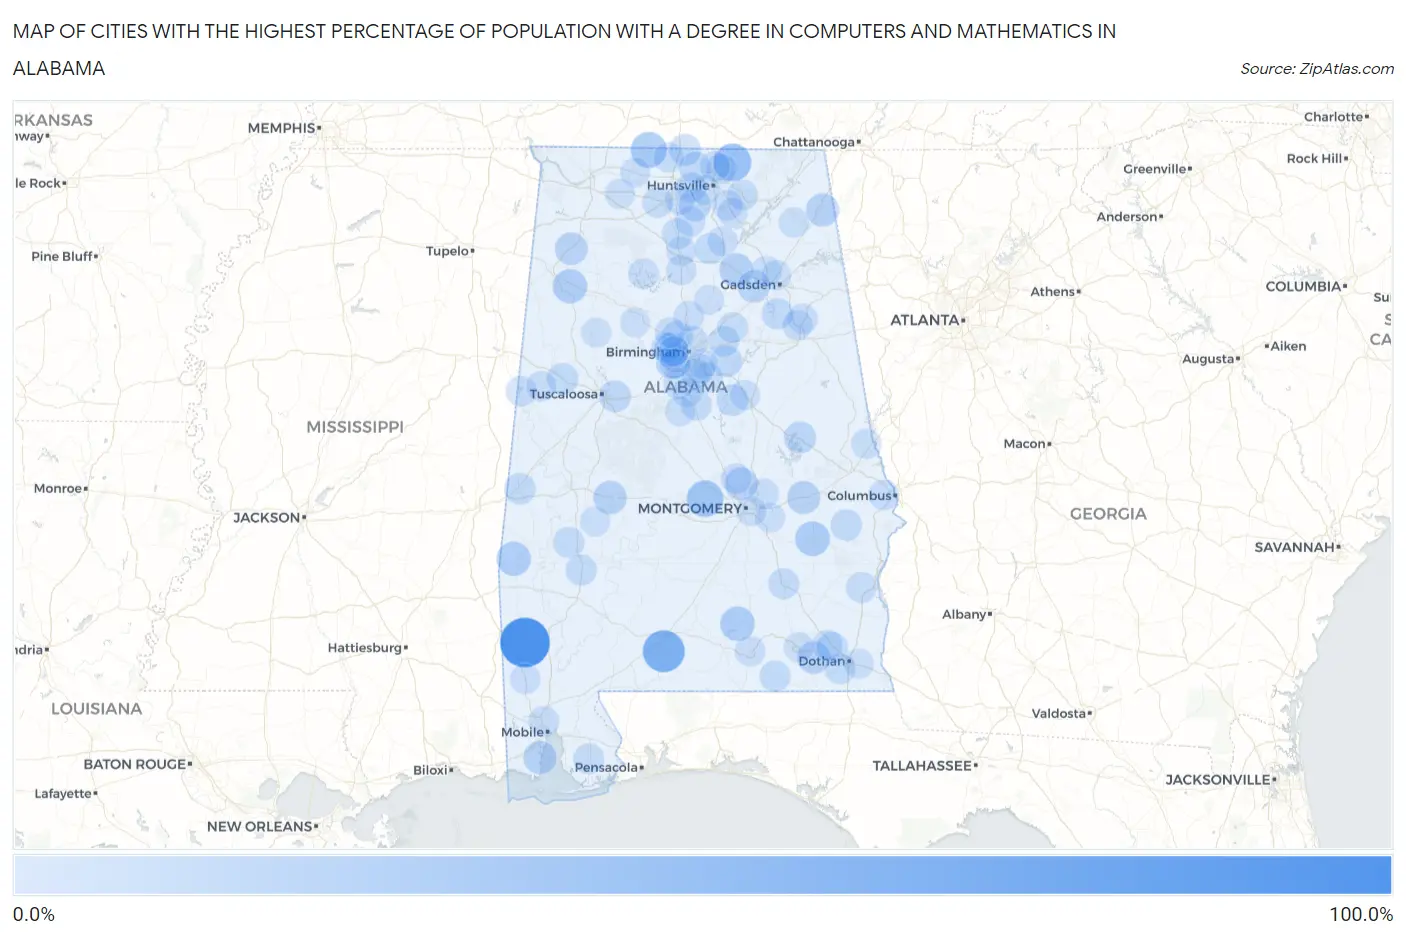
Map of Cities with the Highest Percentage of Population with a Degree in Computers and Mathematics in Alabama
0.0%
100.0%
Cities with the Highest Percentage of Population with a Degree in Computers and Mathematics in Alabama
| City | % Graduates | vs State | vs National | |
| 1. | Tibbie | 100.0% | 4.4%(+95.6)#1 | 4.9%(+95.1)#28 |
| 2. | Castleberry | 62.2% | 4.4%(+57.8)#2 | 4.9%(+57.3)#66 |
| 3. | New Market | 41.4% | 4.4%(+37.0)#3 | 4.9%(+36.5)#153 |
| 4. | Autaugaville | 35.5% | 4.4%(+31.1)#4 | 4.9%(+30.6)#215 |
| 5. | Lester | 33.3% | 4.4%(+29.0)#5 | 4.9%(+28.4)#244 |
| 6. | Union Springs | 27.1% | 4.4%(+22.7)#6 | 4.9%(+22.2)#355 |
| 7. | Dozier | 26.7% | 4.4%(+22.3)#7 | 4.9%(+21.8)#366 |
| 8. | Twin | 25.0% | 4.4%(+20.6)#8 | 4.9%(+20.1)#410 |
| 9. | Needham | 25.0% | 4.4%(+20.6)#9 | 4.9%(+20.1)#423 |
| 10. | Edgewater | 23.8% | 4.4%(+19.4)#10 | 4.9%(+18.9)#452 |
| 11. | Snead | 22.0% | 4.4%(+17.6)#11 | 4.9%(+17.1)#522 |
| 12. | Uniontown | 20.6% | 4.4%(+16.2)#12 | 4.9%(+15.7)#575 |
| 13. | Belle Fontaine | 20.5% | 4.4%(+16.1)#13 | 4.9%(+15.6)#576 |
| 14. | Franklin | 19.6% | 4.4%(+15.2)#14 | 4.9%(+14.7)#637 |
| 15. | Valley Head | 19.3% | 4.4%(+14.9)#15 | 4.9%(+14.4)#652 |
| 16. | Clayhatchee | 18.9% | 4.4%(+14.5)#16 | 4.9%(+14.0)#678 |
| 17. | Elmore | 18.5% | 4.4%(+14.1)#17 | 4.9%(+13.6)#705 |
| 18. | Brighton | 18.0% | 4.4%(+13.6)#18 | 4.9%(+13.1)#748 |
| 19. | Hackleburg | 17.7% | 4.4%(+13.4)#19 | 4.9%(+12.8)#770 |
| 20. | Gallant | 17.4% | 4.4%(+13.0)#20 | 4.9%(+12.5)#798 |
| 21. | Triana | 15.9% | 4.4%(+11.5)#21 | 4.9%(+11.0)#946 |
| 22. | Jacksons Gap | 15.2% | 4.4%(+10.8)#22 | 4.9%(+10.3)#1,027 |
| 23. | Cottondale | 14.4% | 4.4%(+10.0)#23 | 4.9%(+9.52)#1,099 |
| 24. | Sterrett | 14.0% | 4.4%(+9.62)#24 | 4.9%(+9.11)#1,163 |
| 25. | Fayetteville | 13.6% | 4.4%(+9.20)#25 | 4.9%(+8.69)#1,226 |
| 26. | Ardmore | 13.4% | 4.4%(+9.01)#26 | 4.9%(+8.49)#1,257 |
| 27. | Harvest | 13.1% | 4.4%(+8.69)#27 | 4.9%(+8.17)#1,324 |
| 28. | Ohatchee | 12.2% | 4.4%(+7.82)#28 | 4.9%(+7.30)#1,487 |
| 29. | Gordo | 12.1% | 4.4%(+7.77)#29 | 4.9%(+7.25)#1,497 |
| 30. | York | 12.1% | 4.4%(+7.70)#30 | 4.9%(+7.18)#1,511 |
| 31. | Hurtsboro | 11.6% | 4.4%(+7.25)#31 | 4.9%(+6.73)#1,619 |
| 32. | Sweet Water | 11.1% | 4.4%(+6.73)#32 | 4.9%(+6.22)#1,758 |
| 33. | Thomasville | 10.9% | 4.4%(+6.51)#33 | 4.9%(+6.00)#1,820 |
| 34. | Troy | 10.7% | 4.4%(+6.34)#34 | 4.9%(+5.83)#1,865 |
| 35. | Baileyton | 10.6% | 4.4%(+6.21)#35 | 4.9%(+5.69)#1,914 |
| 36. | Moody | 10.3% | 4.4%(+5.95)#36 | 4.9%(+5.43)#2,014 |
| 37. | Calera | 10.2% | 4.4%(+5.86)#37 | 4.9%(+5.34)#2,044 |
| 38. | Pinckard | 10.1% | 4.4%(+5.77)#38 | 4.9%(+5.25)#2,077 |
| 39. | Samson | 10.1% | 4.4%(+5.71)#39 | 4.9%(+5.19)#2,091 |
| 40. | Brookside | 10.0% | 4.4%(+5.62)#40 | 4.9%(+5.11)#2,126 |
| 41. | Falkville | 9.9% | 4.4%(+5.53)#41 | 4.9%(+5.02)#2,186 |
| 42. | Taylor | 9.9% | 4.4%(+5.53)#42 | 4.9%(+5.01)#2,189 |
| 43. | Tarrant | 9.8% | 4.4%(+5.41)#43 | 4.9%(+4.90)#2,233 |
| 44. | Summerdale | 9.5% | 4.4%(+5.13)#44 | 4.9%(+4.61)#2,375 |
| 45. | Odenville | 9.1% | 4.4%(+4.77)#45 | 4.9%(+4.25)#2,541 |
| 46. | Bakerhill | 9.1% | 4.4%(+4.71)#46 | 4.9%(+4.20)#2,581 |
| 47. | Madison | 9.0% | 4.4%(+4.60)#47 | 4.9%(+4.08)#2,635 |
| 48. | Moores Mill | 8.8% | 4.4%(+4.45)#48 | 4.9%(+3.93)#2,706 |
| 49. | Deatsville | 8.8% | 4.4%(+4.40)#49 | 4.9%(+3.89)#2,735 |
| 50. | Helena | 8.7% | 4.4%(+4.32)#50 | 4.9%(+3.80)#2,786 |
| 51. | Chickasaw | 8.6% | 4.4%(+4.17)#51 | 4.9%(+3.66)#2,869 |
| 52. | Pickensville | 8.5% | 4.4%(+4.10)#52 | 4.9%(+3.58)#2,902 |
| 53. | Trinity | 8.5% | 4.4%(+4.08)#53 | 4.9%(+3.56)#2,919 |
| 54. | Paint Rock | 8.3% | 4.4%(+3.96)#54 | 4.9%(+3.44)#3,011 |
| 55. | Weaver | 8.3% | 4.4%(+3.93)#55 | 4.9%(+3.41)#3,027 |
| 56. | Owens Cross Roads | 8.3% | 4.4%(+3.91)#56 | 4.9%(+3.40)#3,029 |
| 57. | Kimberly | 8.3% | 4.4%(+3.90)#57 | 4.9%(+3.39)#3,040 |
| 58. | Citronelle | 8.2% | 4.4%(+3.86)#58 | 4.9%(+3.34)#3,062 |
| 59. | Newton | 8.2% | 4.4%(+3.80)#59 | 4.9%(+3.28)#3,100 |
| 60. | Ladonia | 8.0% | 4.4%(+3.63)#60 | 4.9%(+3.12)#3,198 |
| 61. | Arley | 8.0% | 4.4%(+3.62)#61 | 4.9%(+3.11)#3,209 |
| 62. | Chelsea | 7.9% | 4.4%(+3.55)#62 | 4.9%(+3.04)#3,267 |
| 63. | Somerville | 7.8% | 4.4%(+3.43)#63 | 4.9%(+2.92)#3,368 |
| 64. | Fairfield | 7.8% | 4.4%(+3.38)#64 | 4.9%(+2.86)#3,406 |
| 65. | Arab | 7.5% | 4.4%(+3.17)#65 | 4.9%(+2.65)#3,570 |
| 66. | Opp | 7.5% | 4.4%(+3.10)#66 | 4.9%(+2.58)#3,608 |
| 67. | Maytown | 7.4% | 4.4%(+3.03)#67 | 4.9%(+2.51)#3,668 |
| 68. | Saks | 7.4% | 4.4%(+3.02)#68 | 4.9%(+2.50)#3,676 |
| 69. | Graysville | 7.3% | 4.4%(+2.96)#69 | 4.9%(+2.45)#3,720 |
| 70. | Mooresville | 7.3% | 4.4%(+2.89)#70 | 4.9%(+2.38)#3,771 |
| 71. | Shiloh | 7.1% | 4.4%(+2.76)#71 | 4.9%(+2.25)#3,884 |
| 72. | Good Hope | 7.1% | 4.4%(+2.72)#72 | 4.9%(+2.20)#3,944 |
| 73. | Meridianville | 7.0% | 4.4%(+2.58)#73 | 4.9%(+2.07)#4,072 |
| 74. | Redland | 6.9% | 4.4%(+2.53)#74 | 4.9%(+2.01)#4,117 |
| 75. | Huguley | 6.8% | 4.4%(+2.46)#75 | 4.9%(+1.95)#4,182 |
| 76. | Carrollton | 6.8% | 4.4%(+2.46)#76 | 4.9%(+1.94)#4,185 |
| 77. | Carlisle Rockledge | 6.8% | 4.4%(+2.44)#77 | 4.9%(+1.92)#4,195 |
| 78. | Elkmont | 6.8% | 4.4%(+2.44)#78 | 4.9%(+1.92)#4,201 |
| 79. | Indian Springs Village | 6.7% | 4.4%(+2.36)#79 | 4.9%(+1.85)#4,272 |
| 80. | Cowarts | 6.7% | 4.4%(+2.32)#80 | 4.9%(+1.81)#4,313 |
| 81. | South Vinemont | 6.7% | 4.4%(+2.29)#81 | 4.9%(+1.77)#4,347 |
| 82. | Mcdonald Chapel | 6.7% | 4.4%(+2.29)#82 | 4.9%(+1.77)#4,353 |
| 83. | Parrish | 6.6% | 4.4%(+2.20)#83 | 4.9%(+1.68)#4,457 |
| 84. | Oak Grove | 6.6% | 4.4%(+2.19)#84 | 4.9%(+1.68)#4,469 |
| 85. | Thomaston | 6.6% | 4.4%(+2.18)#85 | 4.9%(+1.66)#4,490 |
| 86. | Huntsville | 6.6% | 4.4%(+2.18)#86 | 4.9%(+1.66)#4,491 |
| 87. | Alabaster | 6.5% | 4.4%(+2.17)#87 | 4.9%(+1.66)#4,496 |
| 88. | Lipscomb | 6.5% | 4.4%(+2.13)#88 | 4.9%(+1.61)#4,549 |
| 89. | Pike Road | 6.5% | 4.4%(+2.09)#89 | 4.9%(+1.58)#4,587 |
| 90. | Berry | 6.4% | 4.4%(+2.03)#90 | 4.9%(+1.52)#4,660 |
| 91. | Town Creek | 6.4% | 4.4%(+2.01)#91 | 4.9%(+1.49)#4,695 |
| 92. | Wilton | 6.4% | 4.4%(+2.01)#92 | 4.9%(+1.49)#4,697 |
| 93. | Locust Fork | 6.3% | 4.4%(+1.97)#93 | 4.9%(+1.46)#4,732 |
| 94. | Montgomery | 6.3% | 4.4%(+1.96)#94 | 4.9%(+1.45)#4,745 |
| 95. | New Hope | 6.3% | 4.4%(+1.91)#95 | 4.9%(+1.40)#4,788 |
| 96. | Brook Highland | 6.2% | 4.4%(+1.79)#96 | 4.9%(+1.28)#4,926 |
| 97. | Enterprise | 6.1% | 4.4%(+1.74)#97 | 4.9%(+1.22)#4,999 |
| 98. | Meadowbrook | 6.0% | 4.4%(+1.65)#98 | 4.9%(+1.13)#5,118 |
| 99. | Rogersville | 6.0% | 4.4%(+1.62)#99 | 4.9%(+1.11)#5,157 |
| 100. | Reece City | 6.0% | 4.4%(+1.59)#100 | 4.9%(+1.08)#5,196 |
Common Questions
What are the Top 10 Cities with the Highest Percentage of Population with a Degree in Computers and Mathematics in Alabama?
Top 10 Cities with the Highest Percentage of Population with a Degree in Computers and Mathematics in Alabama are:
#1
100.0%
#2
62.2%
#3
41.4%
#4
35.5%
#5
33.3%
#6
27.1%
#7
26.7%
#8
25.0%
#9
25.0%
#10
23.8%
What city has the Highest Percentage of Population with a Degree in Computers and Mathematics in Alabama?
Tibbie has the Highest Percentage of Population with a Degree in Computers and Mathematics in Alabama with 100.0%.
What is the Percentage of Population with a Degree in Computers and Mathematics in the State of Alabama?
Percentage of Population with a Degree in Computers and Mathematics in Alabama is 4.4%.
What is the Percentage of Population with a Degree in Computers and Mathematics in the United States?
Percentage of Population with a Degree in Computers and Mathematics in the United States is 4.9%.