Pacheco, CA Map & Demographics
Pacheco Map
Pacheco Overview
$43,539
PER CAPITA INCOME
$105,064
AVG FAMILY INCOME
$100,904
AVG HOUSEHOLD INCOME
24.8%
WAGE / INCOME GAP [ % ]
75.2¢/ $1
WAGE / INCOME GAP [ $ ]
0.44
INEQUALITY / GINI INDEX
5,041
TOTAL POPULATION
2,556
MALE POPULATION
2,485
FEMALE POPULATION
102.86
MALES / 100 FEMALES
97.22
FEMALES / 100 MALES
44.1
MEDIAN AGE
3.0
AVG FAMILY SIZE
2.6
AVG HOUSEHOLD SIZE
2,895
LABOR FORCE [ PEOPLE ]
66.4%
PERCENT IN LABOR FORCE
6.2%
UNEMPLOYMENT RATE
Pacheco Area Codes
Income in Pacheco
Income Overview in Pacheco
Per Capita Income in Pacheco is $43,539, while median incomes of families and households are $105,064 and $100,904 respectively.
| Characteristic | Number | Measure |
| Per Capita Income | 5,041 | $43,539 |
| Median Family Income | 1,382 | $105,064 |
| Mean Family Income | 1,382 | $133,833 |
| Median Household Income | 1,950 | $100,904 |
| Mean Household Income | 1,950 | $113,718 |
| Income Deficit | 1,382 | $0 |
| Wage / Income Gap (%) | 5,041 | 24.80% |
| Wage / Income Gap ($) | 5,041 | 75.20¢ per $1 |
| Gini / Inequality Index | 5,041 | 0.44 |
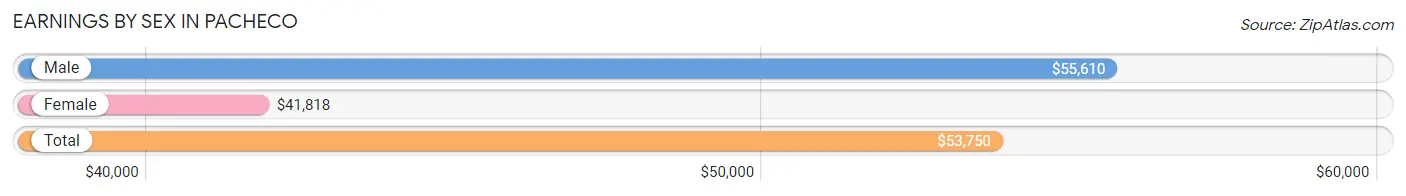
Earnings by Sex in Pacheco
Average Earnings in Pacheco are $53,750, $55,610 for men and $41,818 for women, a difference of 24.8%.
| Sex | Number | Average Earnings |
| Male | 1,540 (53.7%) | $55,610 |
| Female | 1,328 (46.3%) | $41,818 |
| Total | 2,868 (100.0%) | $53,750 |
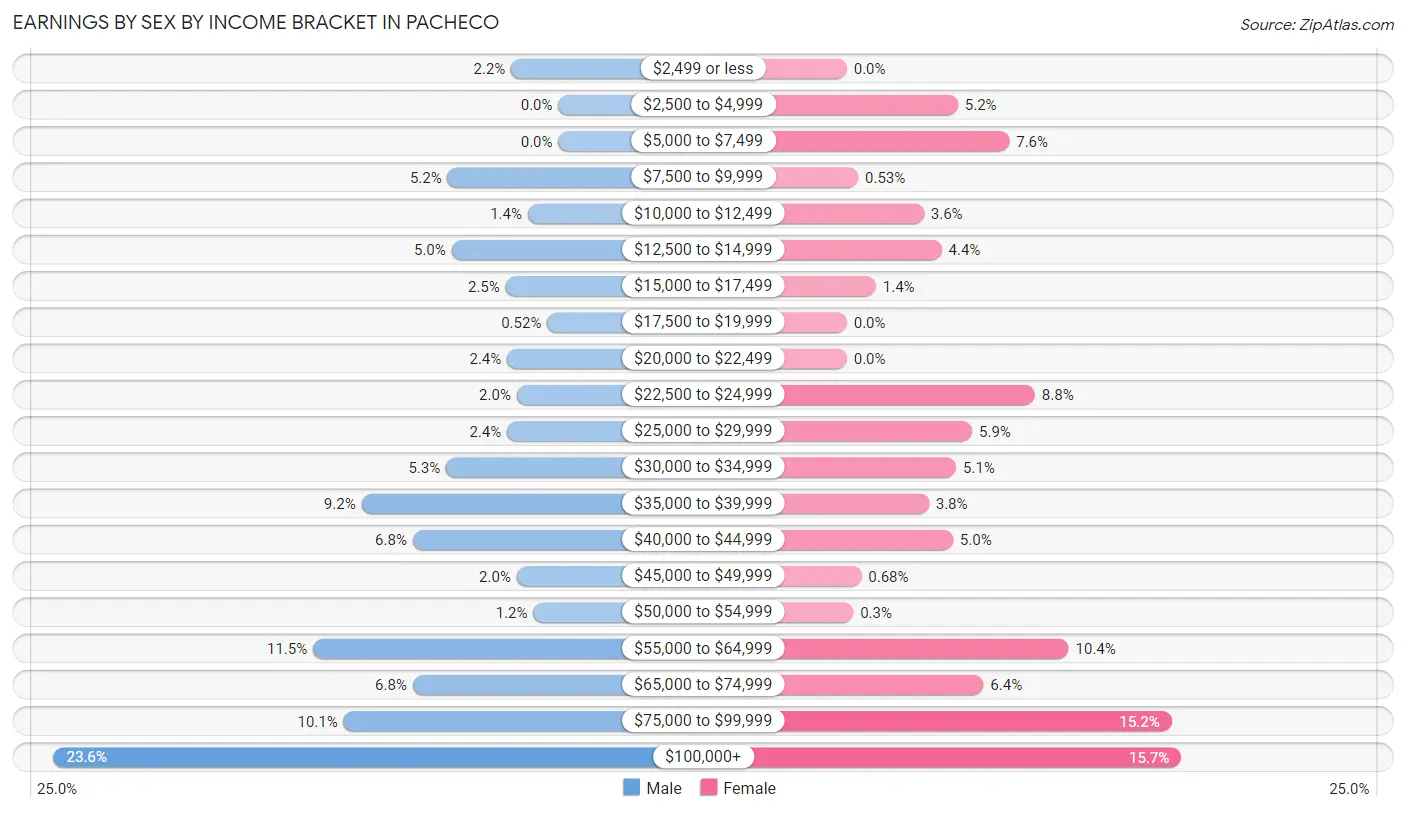
Earnings by Sex by Income Bracket in Pacheco
The most common earnings brackets in Pacheco are $100,000+ for men (364 | 23.6%) and $100,000+ for women (208 | 15.7%).
| Income | Male | Female |
| $2,499 or less | 34 (2.2%) | 0 (0.0%) |
| $2,500 to $4,999 | 0 (0.0%) | 69 (5.2%) |
| $5,000 to $7,499 | 0 (0.0%) | 101 (7.6%) |
| $7,500 to $9,999 | 80 (5.2%) | 7 (0.5%) |
| $10,000 to $12,499 | 22 (1.4%) | 48 (3.6%) |
| $12,500 to $14,999 | 77 (5.0%) | 59 (4.4%) |
| $15,000 to $17,499 | 38 (2.5%) | 18 (1.4%) |
| $17,500 to $19,999 | 8 (0.5%) | 0 (0.0%) |
| $20,000 to $22,499 | 37 (2.4%) | 0 (0.0%) |
| $22,500 to $24,999 | 30 (1.9%) | 117 (8.8%) |
| $25,000 to $29,999 | 37 (2.4%) | 78 (5.9%) |
| $30,000 to $34,999 | 81 (5.3%) | 68 (5.1%) |
| $35,000 to $39,999 | 142 (9.2%) | 51 (3.8%) |
| $40,000 to $44,999 | 105 (6.8%) | 66 (5.0%) |
| $45,000 to $49,999 | 30 (1.9%) | 9 (0.7%) |
| $50,000 to $54,999 | 18 (1.2%) | 4 (0.3%) |
| $55,000 to $64,999 | 177 (11.5%) | 138 (10.4%) |
| $65,000 to $74,999 | 105 (6.8%) | 85 (6.4%) |
| $75,000 to $99,999 | 155 (10.1%) | 202 (15.2%) |
| $100,000+ | 364 (23.6%) | 208 (15.7%) |
| Total | 1,540 (100.0%) | 1,328 (100.0%) |
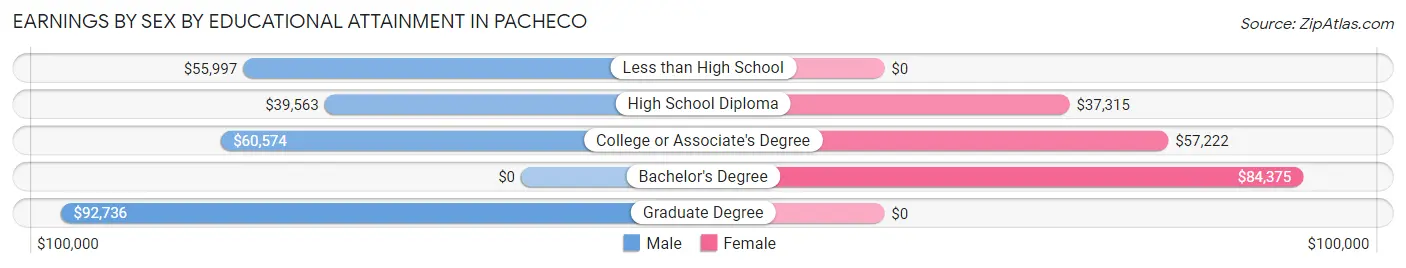
Earnings by Sex by Educational Attainment in Pacheco
Average earnings in Pacheco are $58,750 for men and $58,153 for women, a difference of 1.0%. Men with an educational attainment of graduate degree enjoy the highest average annual earnings of $92,736, while those with high school diploma education earn the least with $39,563. Women with an educational attainment of bachelor's degree earn the most with the average annual earnings of $84,375, while those with high school diploma education have the smallest earnings of $37,315.
| Educational Attainment | Male Income | Female Income |
| Less than High School | $55,997 | $0 |
| High School Diploma | $39,563 | $37,315 |
| College or Associate's Degree | $60,574 | $57,222 |
| Bachelor's Degree | - | - |
| Graduate Degree | $92,736 | $0 |
| Total | $58,750 | $58,153 |
Family Income in Pacheco
Family Income Brackets in Pacheco
According to the Pacheco family income data, there are 412 families falling into the $100,000 to $149,999 income range, which is the most common income bracket and makes up 29.8% of all families.
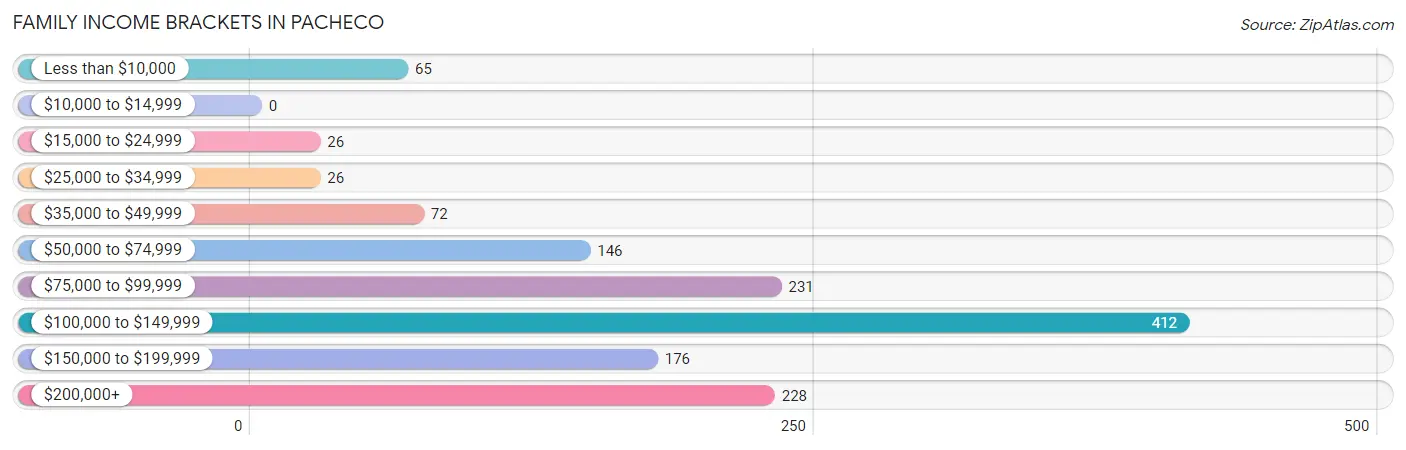
| Income Bracket | # Families | % Families |
| Less than $10,000 | 65 | 4.7% |
| $10,000 to $14,999 | 0 | 0.0% |
| $15,000 to $24,999 | 26 | 1.9% |
| $25,000 to $34,999 | 26 | 1.9% |
| $35,000 to $49,999 | 72 | 5.2% |
| $50,000 to $74,999 | 146 | 10.6% |
| $75,000 to $99,999 | 231 | 16.7% |
| $100,000 to $149,999 | 412 | 29.8% |
| $150,000 to $199,999 | 176 | 12.7% |
| $200,000+ | 228 | 16.5% |
Family Income by Famaliy Size in Pacheco
3-person families (397 | 28.7%) account for the highest median family income in Pacheco with $147,721 per family, while 2-person families (514 | 37.2%) have the highest median income of $53,558 per family member.
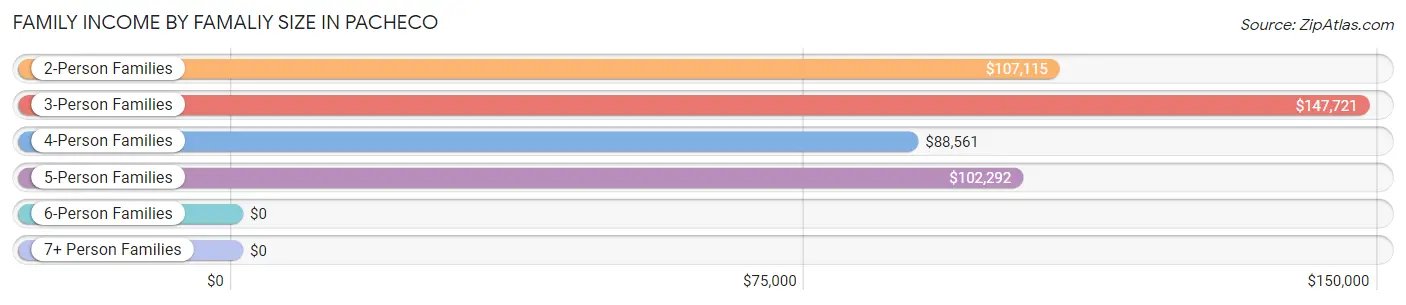
| Income Bracket | # Families | Median Income |
| 2-Person Families | 514 (37.2%) | $107,115 |
| 3-Person Families | 397 (28.7%) | $147,721 |
| 4-Person Families | 323 (23.4%) | $88,561 |
| 5-Person Families | 88 (6.4%) | $102,292 |
| 6-Person Families | 60 (4.3%) | $0 |
| 7+ Person Families | 0 (0.0%) | $0 |
| Total | 1,382 (100.0%) | $105,064 |
Family Income by Number of Earners in Pacheco
The median family income in Pacheco is $105,064, with families comprising 3+ earners (288) having the highest median family income of $178,889, while families with no earners (251) have the lowest median family income of $40,483, accounting for 20.8% and 18.2% of families, respectively.
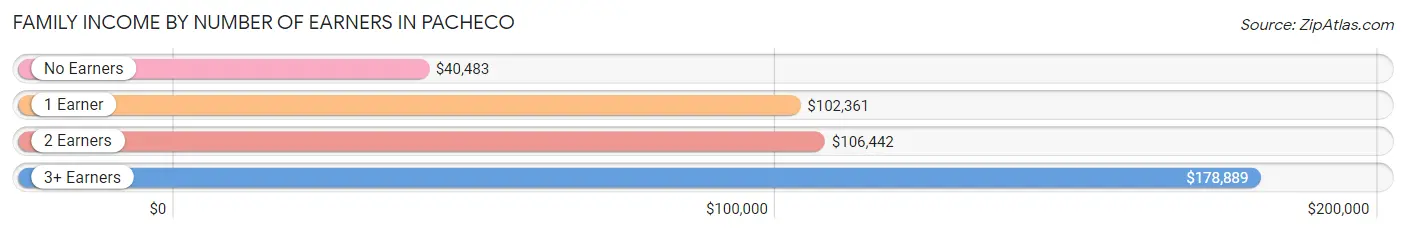
| Number of Earners | # Families | Median Income |
| No Earners | 251 (18.2%) | $40,483 |
| 1 Earner | 280 (20.3%) | $102,361 |
| 2 Earners | 563 (40.7%) | $106,442 |
| 3+ Earners | 288 (20.8%) | $178,889 |
| Total | 1,382 (100.0%) | $105,064 |
Household Income in Pacheco
Household Income Brackets in Pacheco
With 536 households falling in the category, the $100,000 to $149,999 income range is the most frequent in Pacheco, accounting for 27.5% of all households.
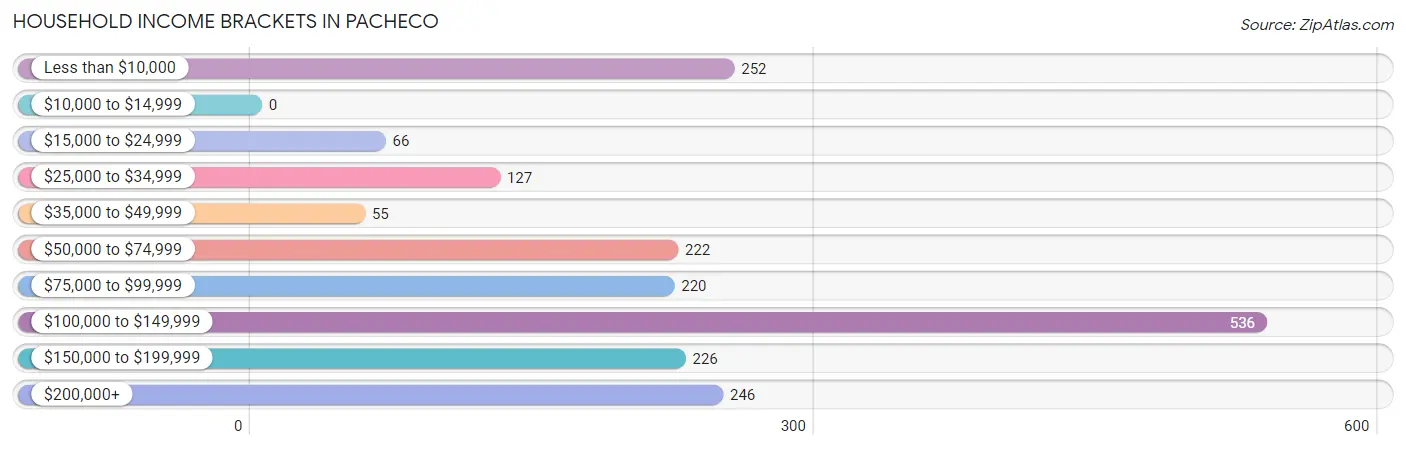
| Income Bracket | # Households | % Households |
| Less than $10,000 | 252 | 12.9% |
| $10,000 to $14,999 | 0 | 0.0% |
| $15,000 to $24,999 | 66 | 3.4% |
| $25,000 to $34,999 | 127 | 6.5% |
| $35,000 to $49,999 | 55 | 2.8% |
| $50,000 to $74,999 | 222 | 11.4% |
| $75,000 to $99,999 | 220 | 11.3% |
| $100,000 to $149,999 | 536 | 27.5% |
| $150,000 to $199,999 | 226 | 11.6% |
| $200,000+ | 246 | 12.6% |
Household Income by Householder Age in Pacheco
The median household income in Pacheco is $100,904, with the highest median household income of $104,503 found in the 45 to 64 years age bracket for the primary householder. A total of 853 households (43.7%) fall into this category.
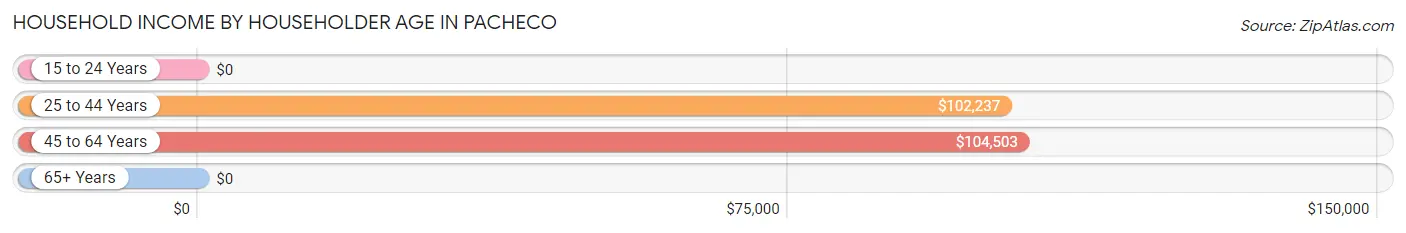
| Income Bracket | # Households | Median Income |
| 15 to 24 Years | 0 (0.0%) | $0 |
| 25 to 44 Years | 610 (31.3%) | $102,237 |
| 45 to 64 Years | 853 (43.7%) | $104,503 |
| 65+ Years | 487 (25.0%) | $0 |
| Total | 1,950 (100.0%) | $100,904 |
Poverty in Pacheco
Income Below Poverty by Sex and Age in Pacheco
With 8.4% poverty level for males and 6.8% for females among the residents of Pacheco, 75 year old and over males and 75 year old and over females are the most vulnerable to poverty, with 111 males (56.1%) and 34 females (18.0%) in their respective age groups living below the poverty level.
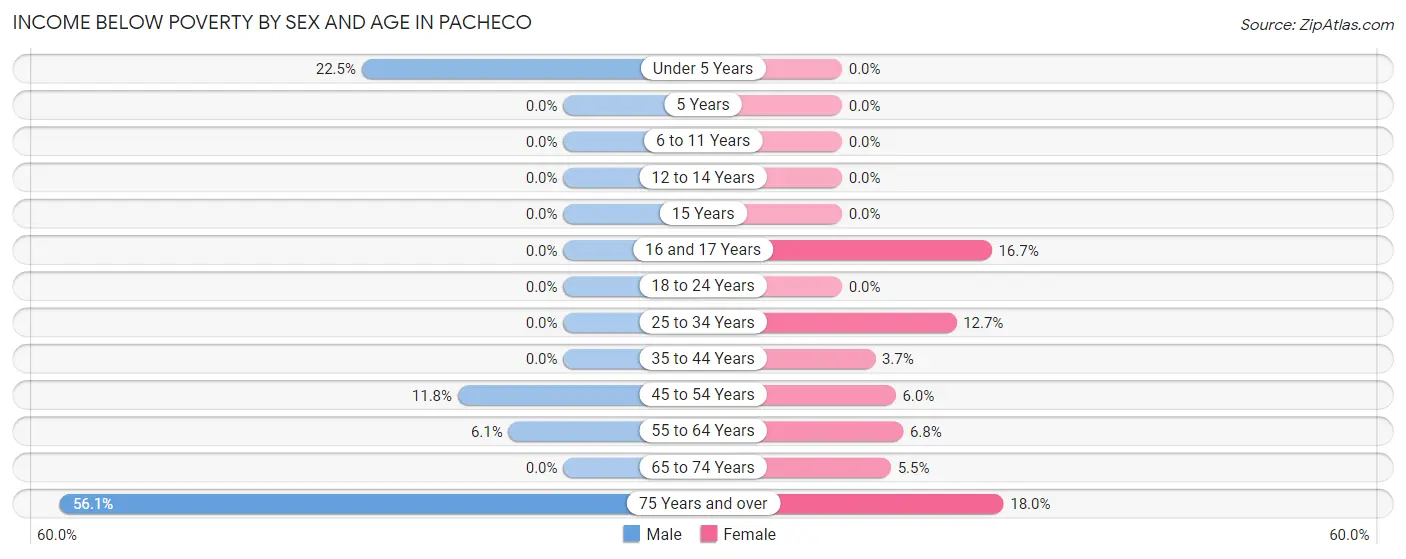
| Age Bracket | Male | Female |
| Under 5 Years | 33 (22.5%) | 0 (0.0%) |
| 5 Years | 0 (0.0%) | 0 (0.0%) |
| 6 to 11 Years | 0 (0.0%) | 0 (0.0%) |
| 12 to 14 Years | 0 (0.0%) | 0 (0.0%) |
| 15 Years | 0 (0.0%) | 0 (0.0%) |
| 16 and 17 Years | 0 (0.0%) | 11 (16.7%) |
| 18 to 24 Years | 0 (0.0%) | 0 (0.0%) |
| 25 to 34 Years | 0 (0.0%) | 47 (12.7%) |
| 35 to 44 Years | 0 (0.0%) | 15 (3.7%) |
| 45 to 54 Years | 53 (11.7%) | 26 (6.0%) |
| 55 to 64 Years | 18 (6.1%) | 22 (6.8%) |
| 65 to 74 Years | 0 (0.0%) | 15 (5.4%) |
| 75 Years and over | 111 (56.1%) | 34 (18.0%) |
| Total | 215 (8.4%) | 170 (6.8%) |
Income Above Poverty by Sex and Age in Pacheco
According to the poverty statistics in Pacheco, males aged 6 to 11 years and females aged under 5 years are the age groups that are most secure financially, with 100.0% of males and 100.0% of females in these age groups living above the poverty line.
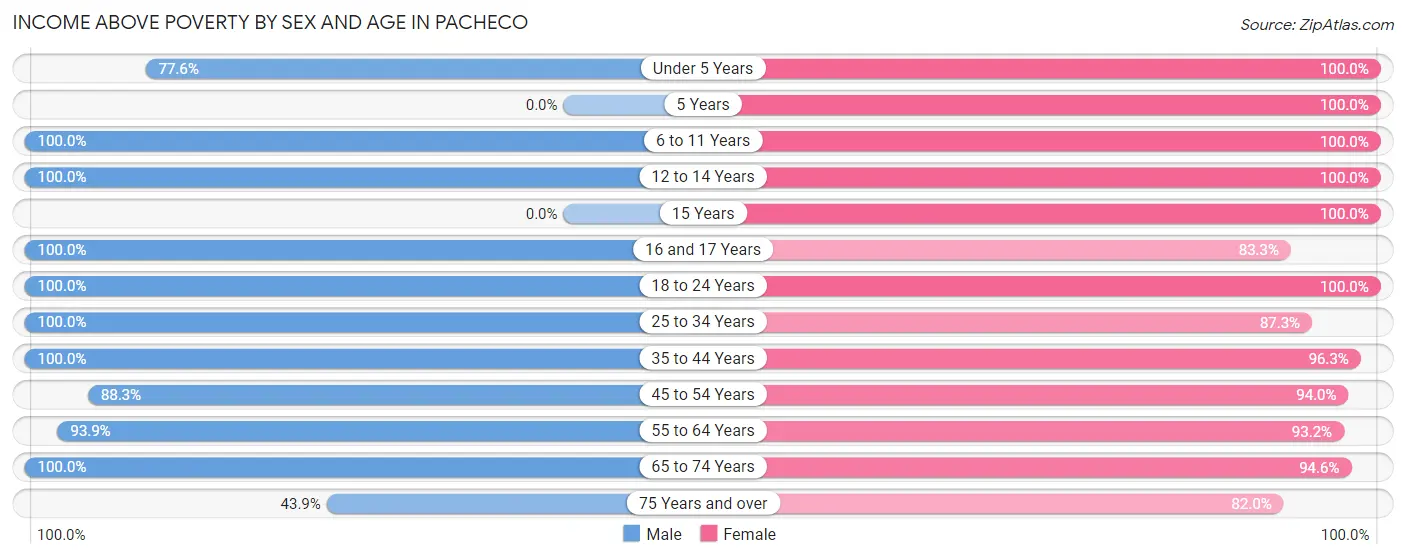
| Age Bracket | Male | Female |
| Under 5 Years | 114 (77.5%) | 43 (100.0%) |
| 5 Years | 0 (0.0%) | 54 (100.0%) |
| 6 to 11 Years | 105 (100.0%) | 68 (100.0%) |
| 12 to 14 Years | 177 (100.0%) | 69 (100.0%) |
| 15 Years | 0 (0.0%) | 18 (100.0%) |
| 16 and 17 Years | 66 (100.0%) | 55 (83.3%) |
| 18 to 24 Years | 214 (100.0%) | 170 (100.0%) |
| 25 to 34 Years | 242 (100.0%) | 322 (87.3%) |
| 35 to 44 Years | 422 (100.0%) | 391 (96.3%) |
| 45 to 54 Years | 398 (88.2%) | 409 (94.0%) |
| 55 to 64 Years | 277 (93.9%) | 301 (93.2%) |
| 65 to 74 Years | 239 (100.0%) | 260 (94.6%) |
| 75 Years and over | 87 (43.9%) | 155 (82.0%) |
| Total | 2,341 (91.6%) | 2,315 (93.2%) |
Income Below Poverty Among Married-Couple Families in Pacheco
The poverty statistics for married-couple families in Pacheco show that 2.1% or 18 of the total 862 families live below the poverty line. Families with 1 or 2 children have the highest poverty rate of 4.4%, comprising of 18 families. On the other hand, families with no children have the lowest poverty rate of 0.0%, which includes 0 families.
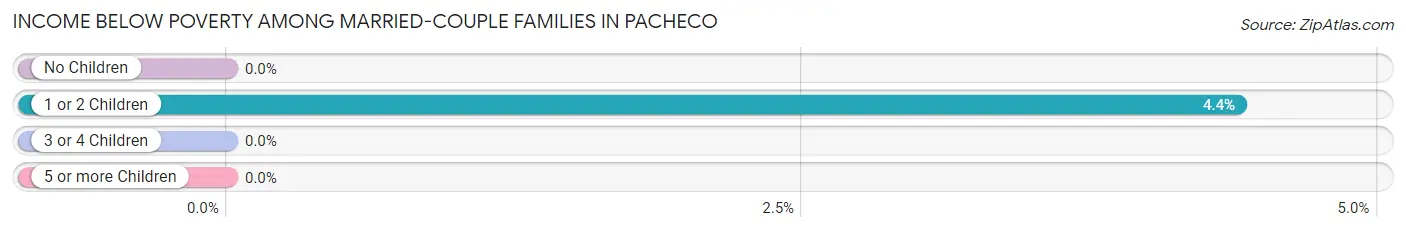
| Children | Above Poverty | Below Poverty |
| No Children | 432 (100.0%) | 0 (0.0%) |
| 1 or 2 Children | 392 (95.6%) | 18 (4.4%) |
| 3 or 4 Children | 20 (100.0%) | 0 (0.0%) |
| 5 or more Children | 0 (0.0%) | 0 (0.0%) |
| Total | 844 (97.9%) | 18 (2.1%) |
Income Below Poverty Among Single-Parent Households in Pacheco
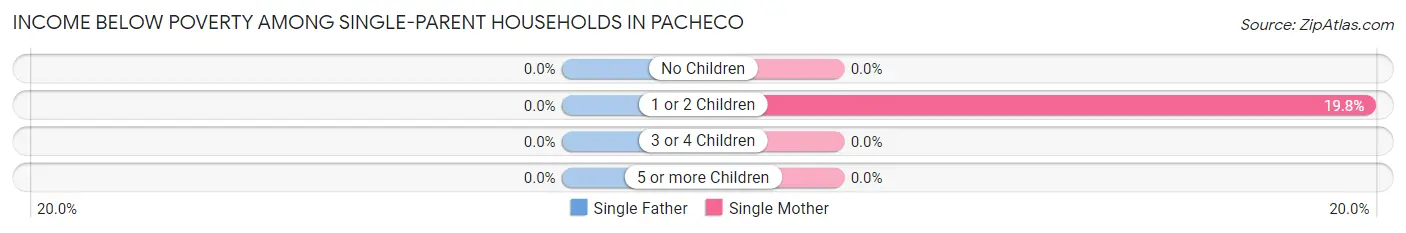
| Children | Single Father | Single Mother |
| No Children | 0 (0.0%) | 0 (0.0%) |
| 1 or 2 Children | 0 (0.0%) | 47 (19.8%) |
| 3 or 4 Children | 0 (0.0%) | 0 (0.0%) |
| 5 or more Children | 0 (0.0%) | 0 (0.0%) |
| Total | 0 (0.0%) | 47 (14.1%) |
Income Below Poverty Among Married-Couple vs Single-Parent Households in Pacheco
The poverty data for Pacheco shows that 18 of the married-couple family households (2.1%) and 47 of the single-parent households (9.0%) are living below the poverty level. Within the married-couple family households, those with 1 or 2 children have the highest poverty rate, with 18 households (4.4%) falling below the poverty line. Among the single-parent households, those with 1 or 2 children have the highest poverty rate, with 47 household (17.2%) living below poverty.
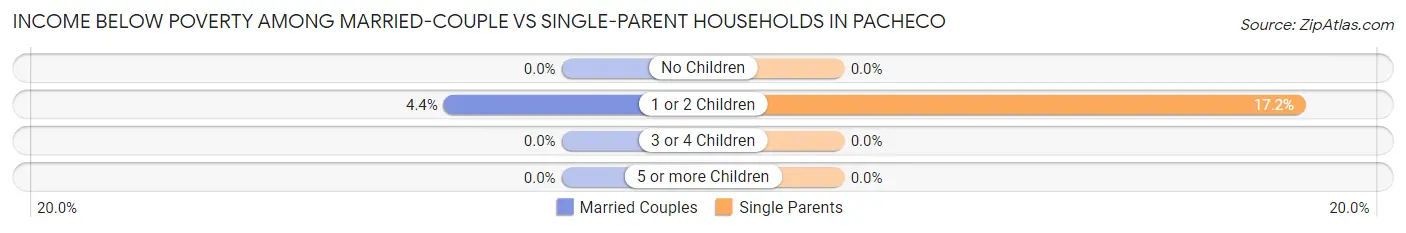
| Children | Married-Couple Families | Single-Parent Households |
| No Children | 0 (0.0%) | 0 (0.0%) |
| 1 or 2 Children | 18 (4.4%) | 47 (17.2%) |
| 3 or 4 Children | 0 (0.0%) | 0 (0.0%) |
| 5 or more Children | 0 (0.0%) | 0 (0.0%) |
| Total | 18 (2.1%) | 47 (9.0%) |
Race in Pacheco
The most populous races in Pacheco are White / Caucasian (2,758 | 54.7%), Hispanic or Latino (1,041 | 20.6%), and Asian (955 | 18.9%).
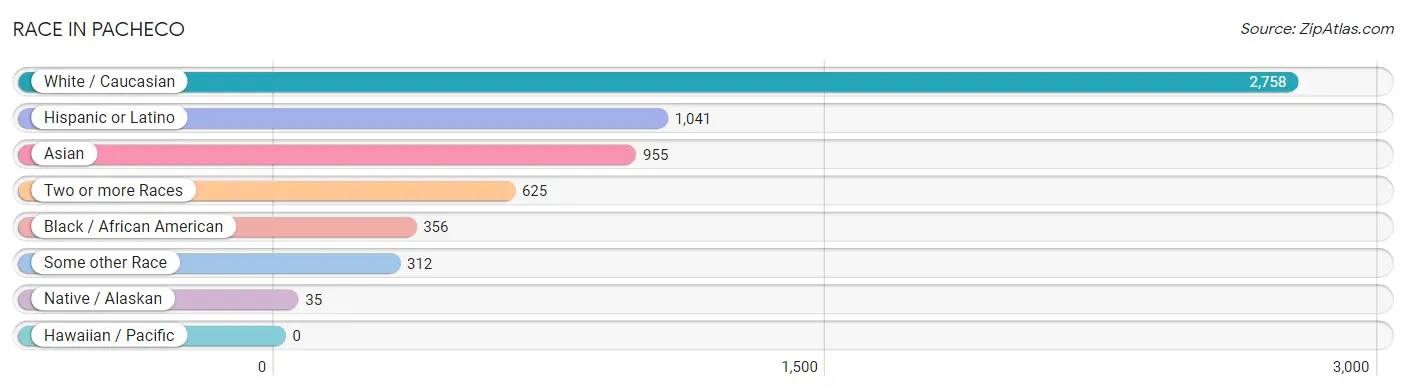
| Race | # Population | % Population |
| Asian | 955 | 18.9% |
| Black / African American | 356 | 7.1% |
| Hawaiian / Pacific | 0 | 0.0% |
| Hispanic or Latino | 1,041 | 20.6% |
| Native / Alaskan | 35 | 0.7% |
| White / Caucasian | 2,758 | 54.7% |
| Two or more Races | 625 | 12.4% |
| Some other Race | 312 | 6.2% |
| Total | 5,041 | 100.0% |
Ancestry in Pacheco
The most populous ancestries reported in Pacheco are English (985 | 19.5%), Mexican (928 | 18.4%), Irish (375 | 7.4%), Indian (Asian) (365 | 7.2%), and Sri Lankan (315 | 6.2%), together accounting for 58.9% of all Pacheco residents.
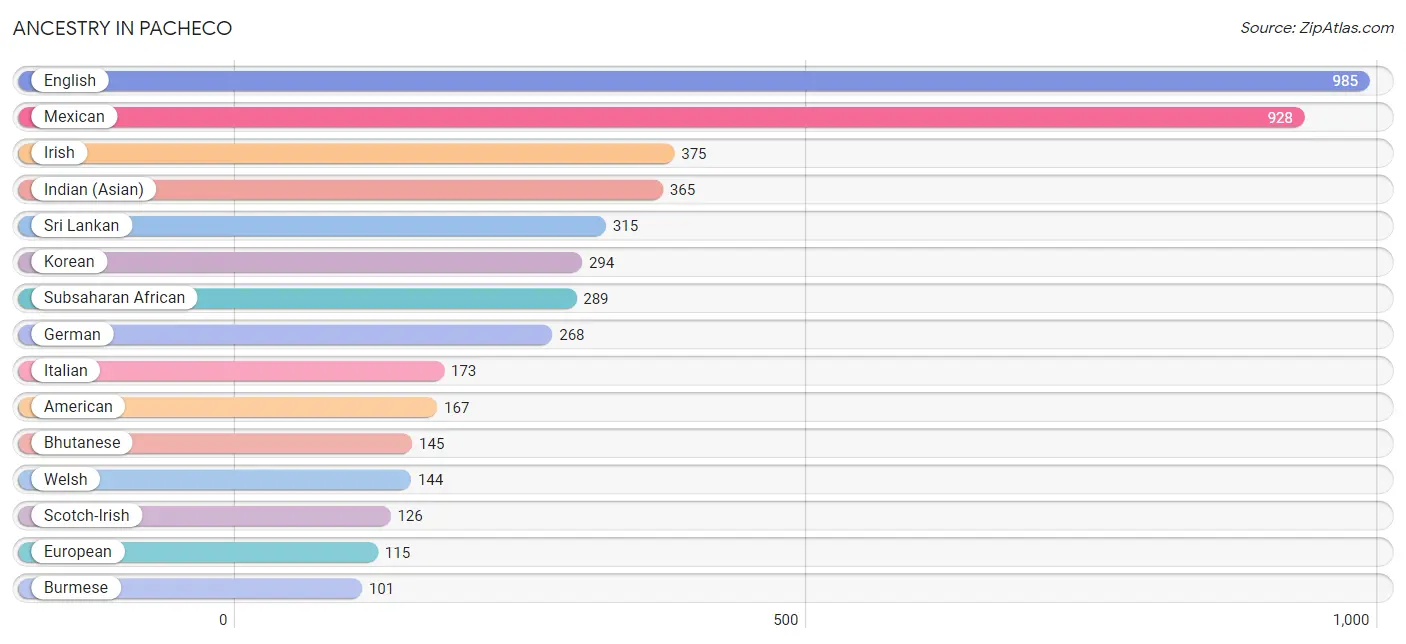
| Ancestry | # Population | % Population |
| American | 167 | 3.3% |
| Belgian | 39 | 0.8% |
| Bhutanese | 145 | 2.9% |
| Brazilian | 52 | 1.0% |
| British | 30 | 0.6% |
| Burmese | 101 | 2.0% |
| Canadian | 7 | 0.1% |
| Central American | 58 | 1.1% |
| Chickasaw | 88 | 1.8% |
| Chippewa | 19 | 0.4% |
| Costa Rican | 10 | 0.2% |
| Danish | 21 | 0.4% |
| English | 985 | 19.5% |
| European | 115 | 2.3% |
| Finnish | 27 | 0.5% |
| French | 40 | 0.8% |
| German | 268 | 5.3% |
| Hungarian | 24 | 0.5% |
| Icelander | 15 | 0.3% |
| Indian (Asian) | 365 | 7.2% |
| Irish | 375 | 7.4% |
| Italian | 173 | 3.4% |
| Korean | 294 | 5.8% |
| Lithuanian | 12 | 0.2% |
| Mexican | 928 | 18.4% |
| Northern European | 93 | 1.8% |
| Norwegian | 49 | 1.0% |
| Polish | 63 | 1.3% |
| Portuguese | 89 | 1.8% |
| Puerto Rican | 19 | 0.4% |
| Salvadoran | 48 | 0.9% |
| Scotch-Irish | 126 | 2.5% |
| Scottish | 98 | 1.9% |
| Sri Lankan | 315 | 6.2% |
| Subsaharan African | 289 | 5.7% |
| Swedish | 61 | 1.2% |
| Swiss | 21 | 0.4% |
| U.S. Virgin Islander | 55 | 1.1% |
| Welsh | 144 | 2.9% | View All 39 Rows |
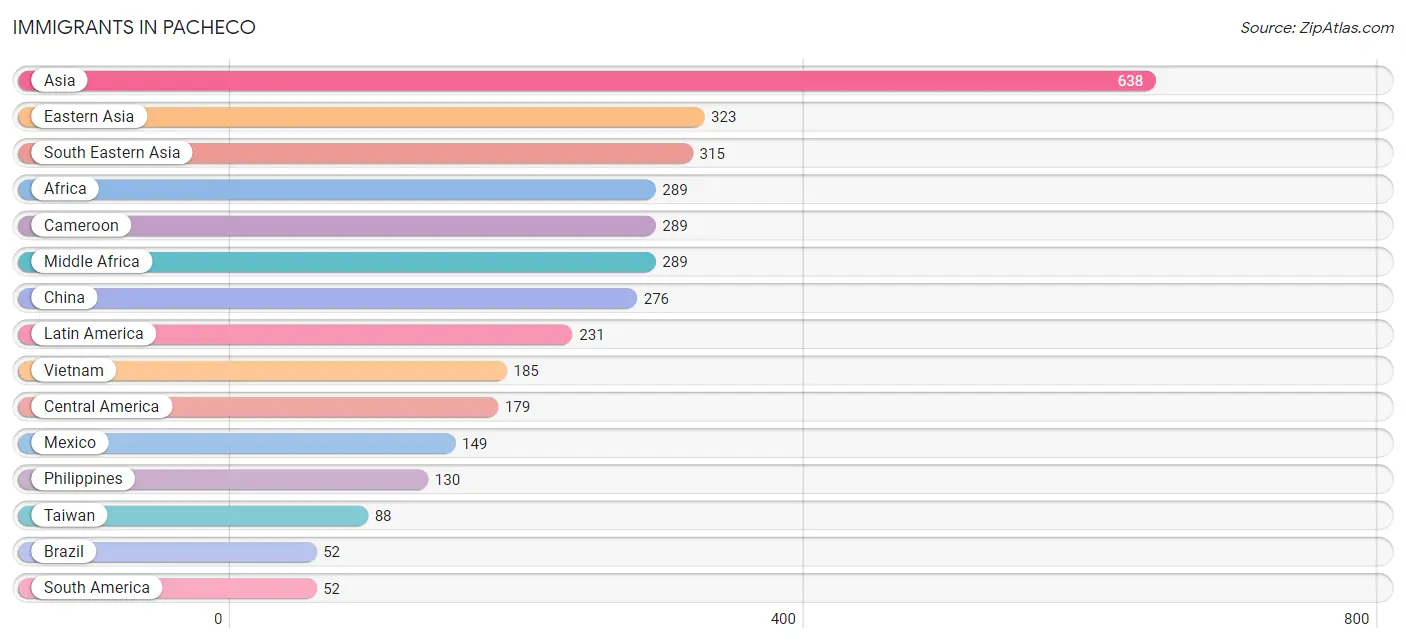
Immigrants in Pacheco
The most numerous immigrant groups reported in Pacheco came from Asia (638 | 12.7%), Eastern Asia (323 | 6.4%), South Eastern Asia (315 | 6.2%), Africa (289 | 5.7%), and Cameroon (289 | 5.7%), together accounting for 36.8% of all Pacheco residents.
| Immigration Origin | # Population | % Population |
| Africa | 289 | 5.7% |
| Asia | 638 | 12.7% |
| Belgium | 39 | 0.8% |
| Brazil | 52 | 1.0% |
| Cameroon | 289 | 5.7% |
| Canada | 7 | 0.1% |
| Central America | 179 | 3.5% |
| China | 276 | 5.5% |
| Costa Rica | 15 | 0.3% |
| Eastern Asia | 323 | 6.4% |
| El Salvador | 8 | 0.2% |
| Europe | 39 | 0.8% |
| Guatemala | 7 | 0.1% |
| Japan | 16 | 0.3% |
| Korea | 31 | 0.6% |
| Latin America | 231 | 4.6% |
| Mexico | 149 | 3.0% |
| Middle Africa | 289 | 5.7% |
| Philippines | 130 | 2.6% |
| South America | 52 | 1.0% |
| South Eastern Asia | 315 | 6.2% |
| Taiwan | 88 | 1.8% |
| Vietnam | 185 | 3.7% |
| Western Europe | 39 | 0.8% | View All 24 Rows |
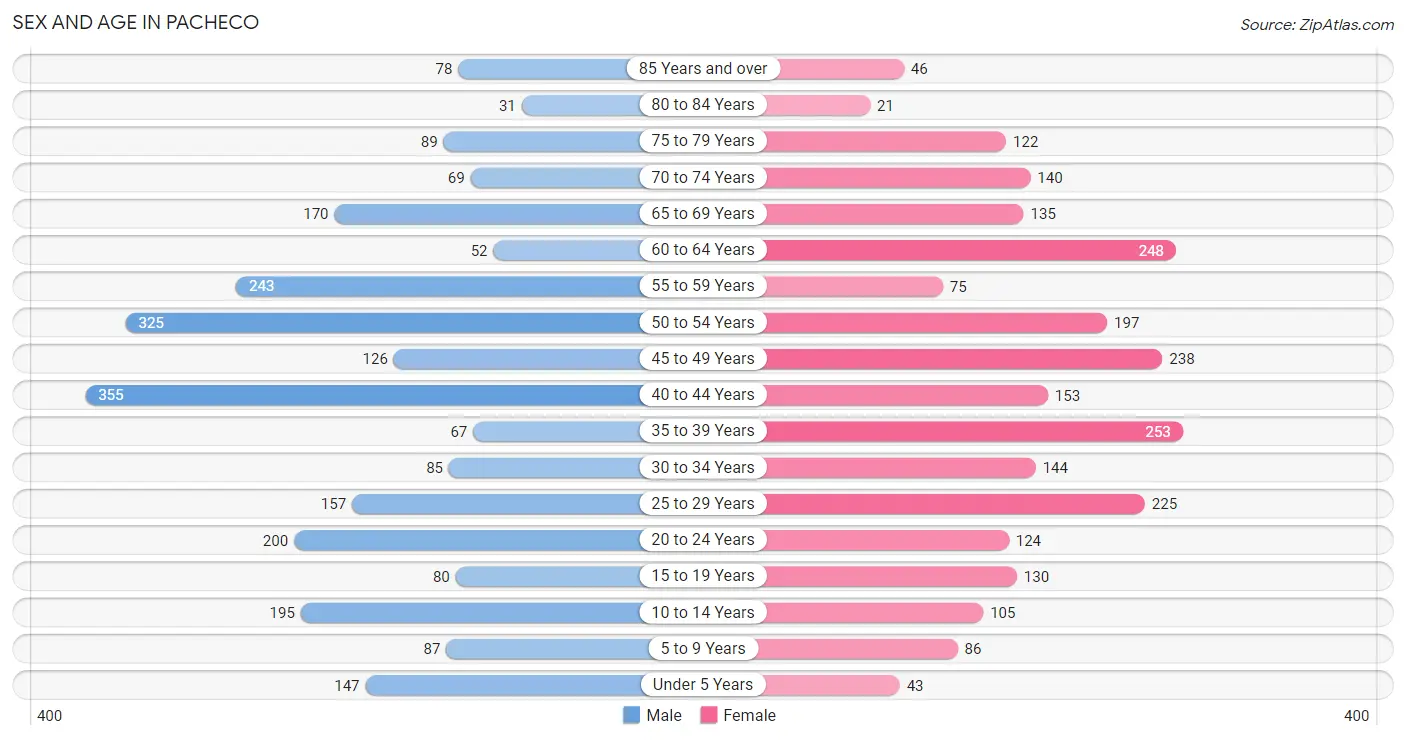
Sex and Age in Pacheco
Sex and Age in Pacheco
The most populous age groups in Pacheco are 40 to 44 Years (355 | 13.9%) for men and 35 to 39 Years (253 | 10.2%) for women.
| Age Bracket | Male | Female |
| Under 5 Years | 147 (5.8%) | 43 (1.7%) |
| 5 to 9 Years | 87 (3.4%) | 86 (3.5%) |
| 10 to 14 Years | 195 (7.6%) | 105 (4.2%) |
| 15 to 19 Years | 80 (3.1%) | 130 (5.2%) |
| 20 to 24 Years | 200 (7.8%) | 124 (5.0%) |
| 25 to 29 Years | 157 (6.1%) | 225 (9.0%) |
| 30 to 34 Years | 85 (3.3%) | 144 (5.8%) |
| 35 to 39 Years | 67 (2.6%) | 253 (10.2%) |
| 40 to 44 Years | 355 (13.9%) | 153 (6.2%) |
| 45 to 49 Years | 126 (4.9%) | 238 (9.6%) |
| 50 to 54 Years | 325 (12.7%) | 197 (7.9%) |
| 55 to 59 Years | 243 (9.5%) | 75 (3.0%) |
| 60 to 64 Years | 52 (2.0%) | 248 (10.0%) |
| 65 to 69 Years | 170 (6.7%) | 135 (5.4%) |
| 70 to 74 Years | 69 (2.7%) | 140 (5.6%) |
| 75 to 79 Years | 89 (3.5%) | 122 (4.9%) |
| 80 to 84 Years | 31 (1.2%) | 21 (0.9%) |
| 85 Years and over | 78 (3.0%) | 46 (1.8%) |
| Total | 2,556 (100.0%) | 2,485 (100.0%) |
Families and Households in Pacheco
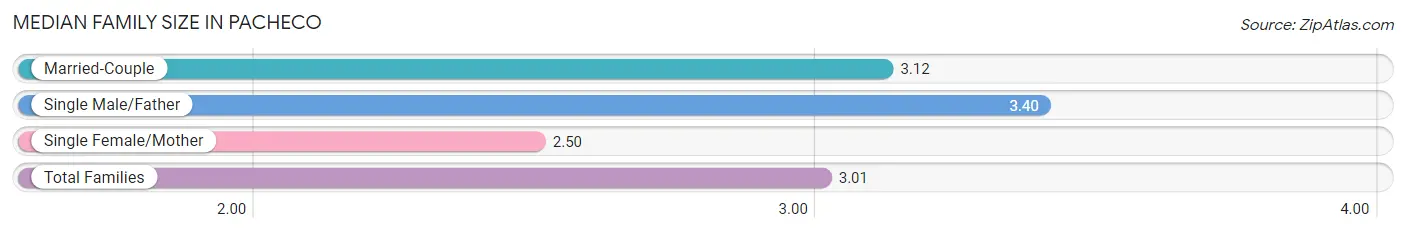
Median Family Size in Pacheco
The median family size in Pacheco is 3.01 persons per family, with single male/father families (187 | 13.5%) accounting for the largest median family size of 3.4 persons per family. On the other hand, single female/mother families (333 | 24.1%) represent the smallest median family size with 2.50 persons per family.
| Family Type | # Families | Family Size |
| Married-Couple | 862 (62.4%) | 3.12 |
| Single Male/Father | 187 (13.5%) | 3.40 |
| Single Female/Mother | 333 (24.1%) | 2.50 |
| Total Families | 1,382 (100.0%) | 3.01 |
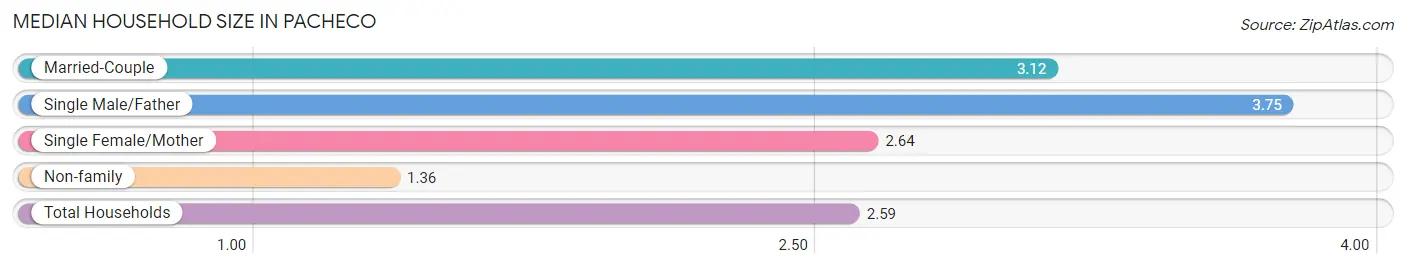
Median Household Size in Pacheco
The median household size in Pacheco is 2.59 persons per household, with single male/father households (187 | 9.6%) accounting for the largest median household size of 3.75 persons per household. non-family households (568 | 29.1%) represent the smallest median household size with 1.36 persons per household.
| Household Type | # Households | Household Size |
| Married-Couple | 862 (44.2%) | 3.12 |
| Single Male/Father | 187 (9.6%) | 3.75 |
| Single Female/Mother | 333 (17.1%) | 2.64 |
| Non-family | 568 (29.1%) | 1.36 |
| Total Households | 1,950 (100.0%) | 2.59 |
Household Size by Marriage Status in Pacheco
Out of a total of 1,950 households in Pacheco, 1,382 (70.9%) are family households, while 568 (29.1%) are nonfamily households. The most numerous type of family households are 3-person households, comprising 480, and the most common type of nonfamily households are 1-person households, comprising 441.
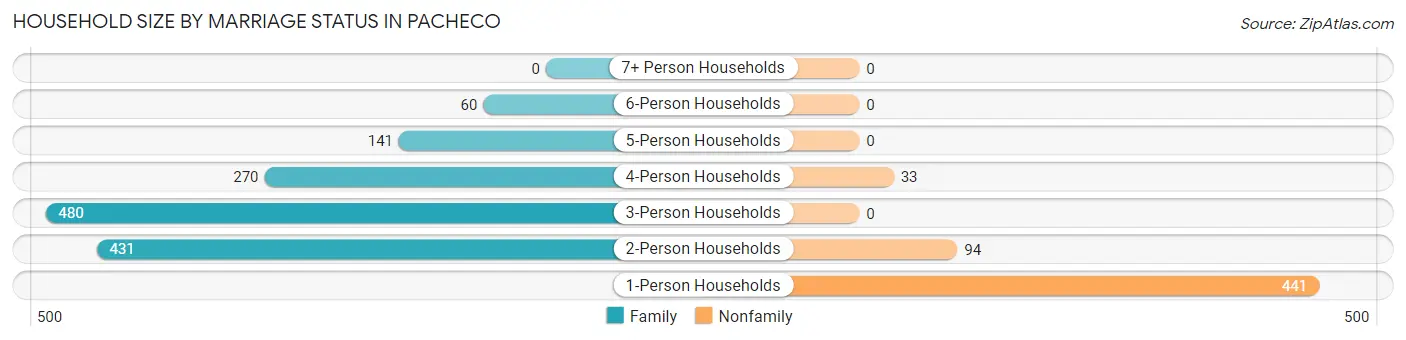
| Household Size | Family Households | Nonfamily Households |
| 1-Person Households | - | 441 (22.6%) |
| 2-Person Households | 431 (22.1%) | 94 (4.8%) |
| 3-Person Households | 480 (24.6%) | 0 (0.0%) |
| 4-Person Households | 270 (13.9%) | 33 (1.7%) |
| 5-Person Households | 141 (7.2%) | 0 (0.0%) |
| 6-Person Households | 60 (3.1%) | 0 (0.0%) |
| 7+ Person Households | 0 (0.0%) | 0 (0.0%) |
| Total | 1,382 (70.9%) | 568 (29.1%) |
Female Fertility in Pacheco
Fertility by Age in Pacheco
Average fertility rate in Pacheco is 59.0 births per 1,000 women. Women in the age bracket of 20 to 34 years have the highest fertility rate with 156.0 births per 1,000 women. Women in the age bracket of 20 to 34 years acount for 100.0% of all women with births.
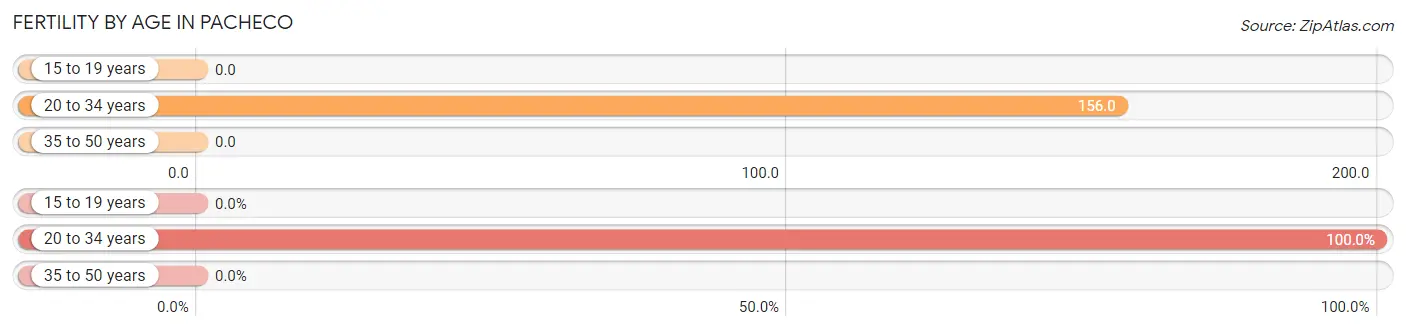
| Age Bracket | Women with Births | Births / 1,000 Women |
| 15 to 19 years | 0 (0.0%) | 0.0 |
| 20 to 34 years | 77 (100.0%) | 156.0 |
| 35 to 50 years | 0 (0.0%) | 0.0 |
| Total | 77 (100.0%) | 59.0 |
Fertility by Age by Marriage Status in Pacheco
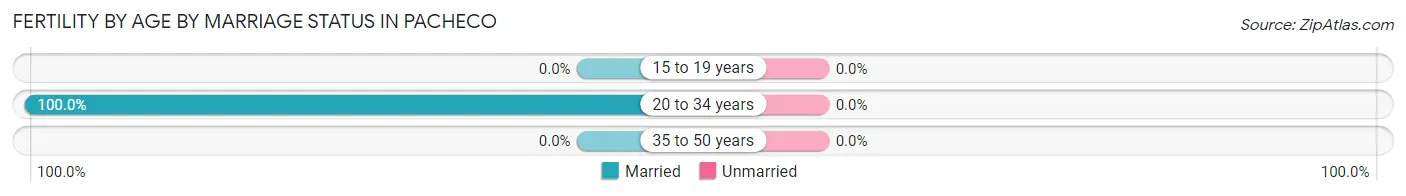
| Age Bracket | Married | Unmarried |
| 15 to 19 years | 0 (0.0%) | 0 (0.0%) |
| 20 to 34 years | 77 (100.0%) | 0 (0.0%) |
| 35 to 50 years | 0 (0.0%) | 0 (0.0%) |
| Total | 77 (100.0%) | 0 (0.0%) |
Fertility by Education in Pacheco
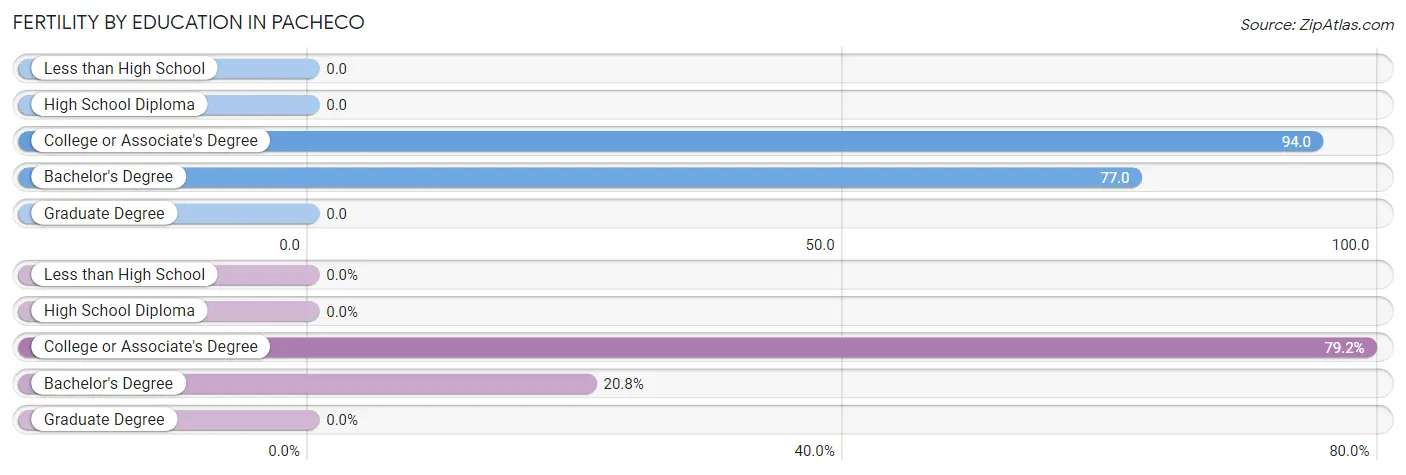
| Educational Attainment | Women with Births | Births / 1,000 Women |
| Less than High School | 0 (0.0%) | 0.0 |
| High School Diploma | 0 (0.0%) | 0.0 |
| College or Associate's Degree | 61 (79.2%) | 94.0 |
| Bachelor's Degree | 16 (20.8%) | 77.0 |
| Graduate Degree | 0 (0.0%) | 0.0 |
| Total | 77 (100.0%) | 59.0 |
Fertility by Education by Marriage Status in Pacheco
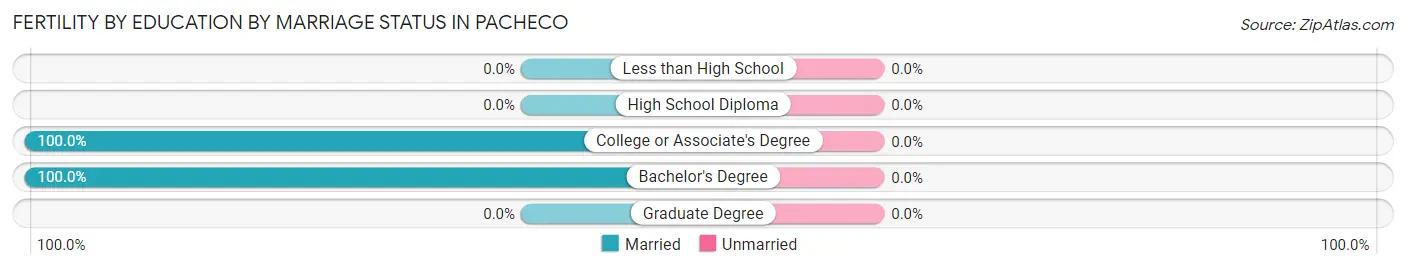
| Educational Attainment | Married | Unmarried |
| Less than High School | 0 (0.0%) | 0 (0.0%) |
| High School Diploma | 0 (0.0%) | 0 (0.0%) |
| College or Associate's Degree | 61 (100.0%) | 0 (0.0%) |
| Bachelor's Degree | 16 (100.0%) | 0 (0.0%) |
| Graduate Degree | 0 (0.0%) | 0 (0.0%) |
| Total | 77 (100.0%) | 0 (0.0%) |
Employment Characteristics in Pacheco
Employment by Class of Employer in Pacheco
Among the 2,660 employed individuals in Pacheco, private company employees (1,784 | 67.1%), not-for-profit organizations (366 | 13.8%), and local government employees (225 | 8.5%) make up the most common classes of employment.
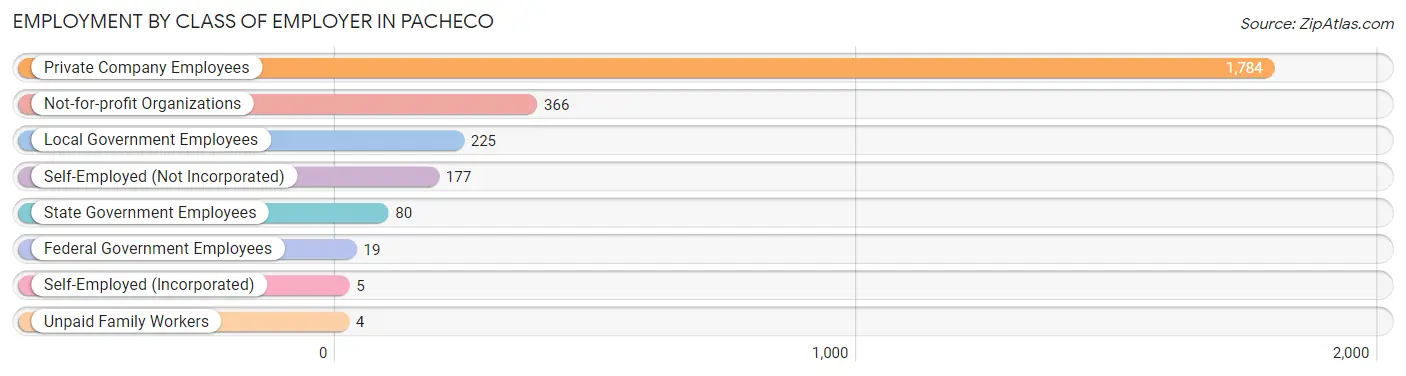
| Employer Class | # Employees | % Employees |
| Private Company Employees | 1,784 | 67.1% |
| Self-Employed (Incorporated) | 5 | 0.2% |
| Self-Employed (Not Incorporated) | 177 | 6.7% |
| Not-for-profit Organizations | 366 | 13.8% |
| Local Government Employees | 225 | 8.5% |
| State Government Employees | 80 | 3.0% |
| Federal Government Employees | 19 | 0.7% |
| Unpaid Family Workers | 4 | 0.2% |
| Total | 2,660 | 100.0% |
Employment Status by Age in Pacheco
According to the labor force statistics for Pacheco, out of the total population over 16 years of age (4,360), 66.4% or 2,895 individuals are in the labor force, with 6.2% or 179 of them unemployed. The age group with the highest labor force participation rate is 30 to 34 years, with 100.0% or 229 individuals in the labor force. Within the labor force, the 45 to 54 years age range has the highest percentage of unemployed individuals, with 12.5% or 92 of them being unemployed.
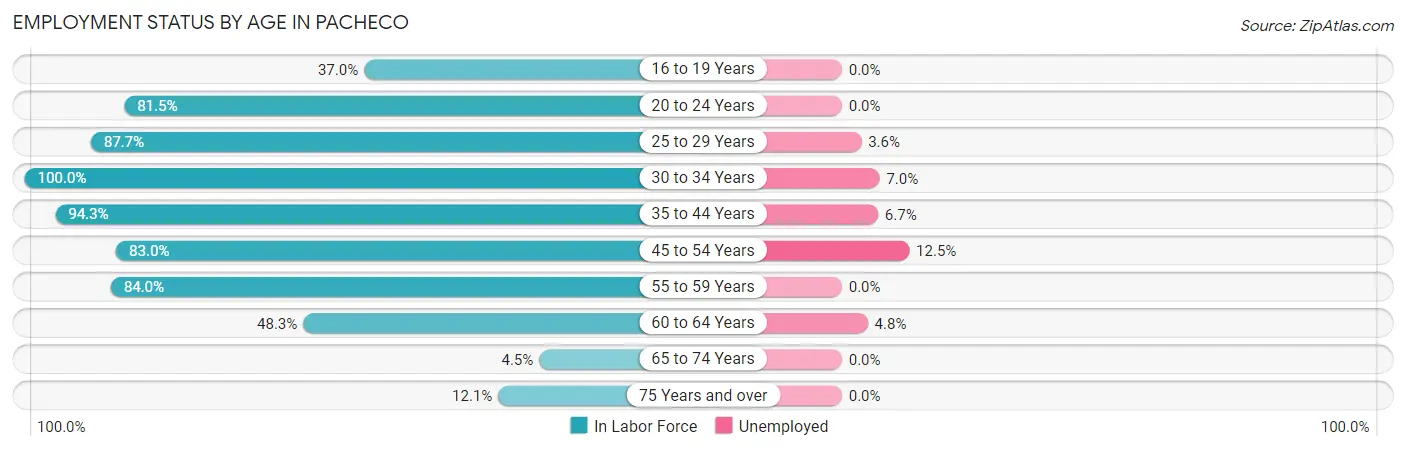
| Age Bracket | In Labor Force | Unemployed |
| 16 to 19 Years | 71 (37.0%) | 0 (0.0%) |
| 20 to 24 Years | 264 (81.5%) | 0 (0.0%) |
| 25 to 29 Years | 335 (87.7%) | 12 (3.6%) |
| 30 to 34 Years | 229 (100.0%) | 16 (7.0%) |
| 35 to 44 Years | 781 (94.3%) | 52 (6.7%) |
| 45 to 54 Years | 735 (83.0%) | 92 (12.5%) |
| 55 to 59 Years | 267 (84.0%) | 0 (0.0%) |
| 60 to 64 Years | 145 (48.3%) | 7 (4.8%) |
| 65 to 74 Years | 23 (4.5%) | 0 (0.0%) |
| 75 Years and over | 47 (12.1%) | 0 (0.0%) |
| Total | 2,895 (66.4%) | 179 (6.2%) |
Employment Status by Educational Attainment in Pacheco
According to labor force statistics for Pacheco, 84.7% of individuals (2,493) out of the total population between 25 and 64 years of age (2,943) are in the labor force, with 7.2% or 179 of them being unemployed. The group with the highest labor force participation rate are those with the educational attainment of bachelor's degree or higher, with 91.7% or 686 individuals in the labor force. Within the labor force, individuals with college / associate degree education have the highest percentage of unemployment, with 12.0% or 105 of them being unemployed.
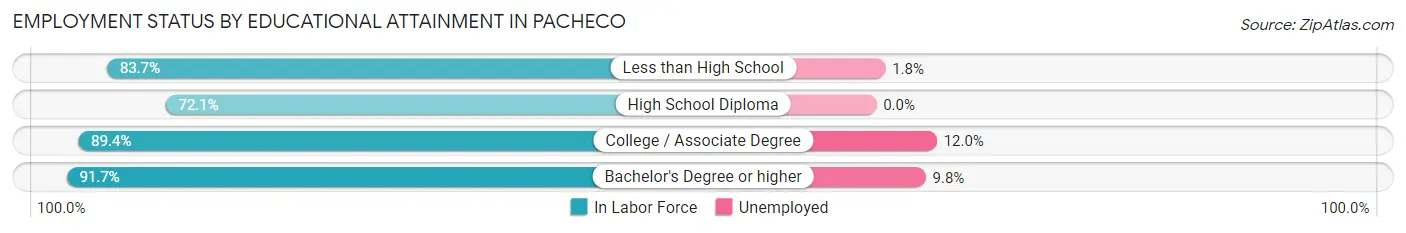
| Educational Attainment | In Labor Force | Unemployed |
| Less than High School | 386 (83.7%) | 8 (1.8%) |
| High School Diploma | 544 (72.1%) | 0 (0.0%) |
| College / Associate Degree | 876 (89.4%) | 118 (12.0%) |
| Bachelor's Degree or higher | 686 (91.7%) | 73 (9.8%) |
| Total | 2,493 (84.7%) | 212 (7.2%) |
Employment Occupations by Sex in Pacheco
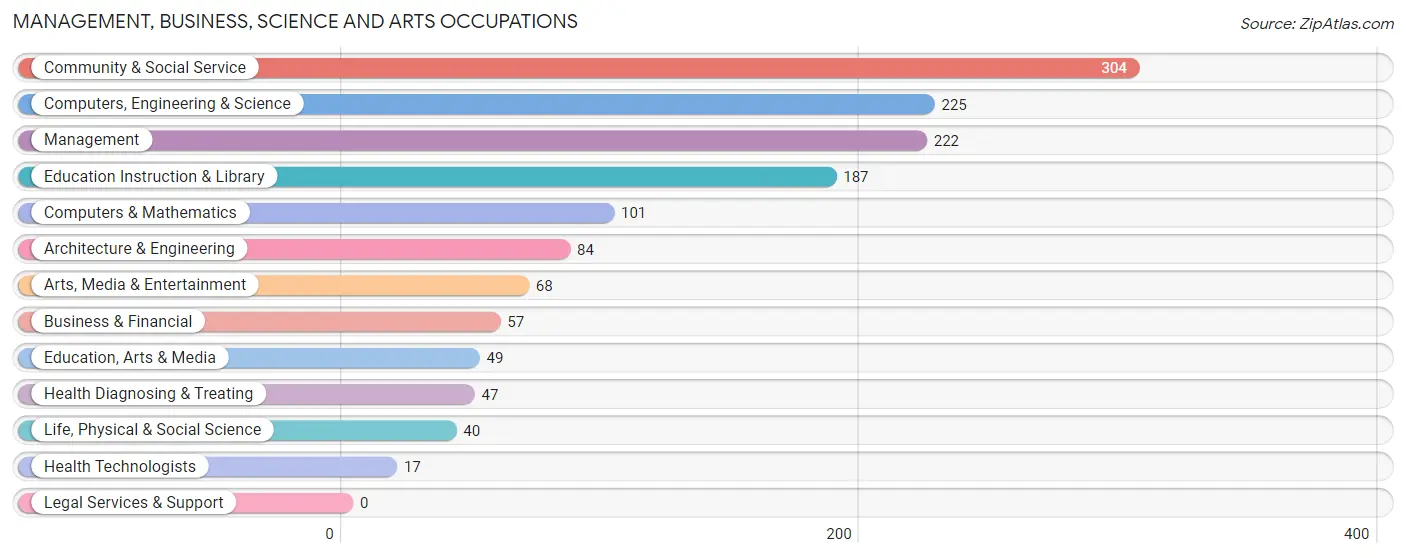
Management, Business, Science and Arts Occupations
The most common Management, Business, Science and Arts occupations in Pacheco are Community & Social Service (304 | 11.2%), Computers, Engineering & Science (225 | 8.3%), Management (222 | 8.2%), Education Instruction & Library (187 | 6.9%), and Computers & Mathematics (101 | 3.7%).
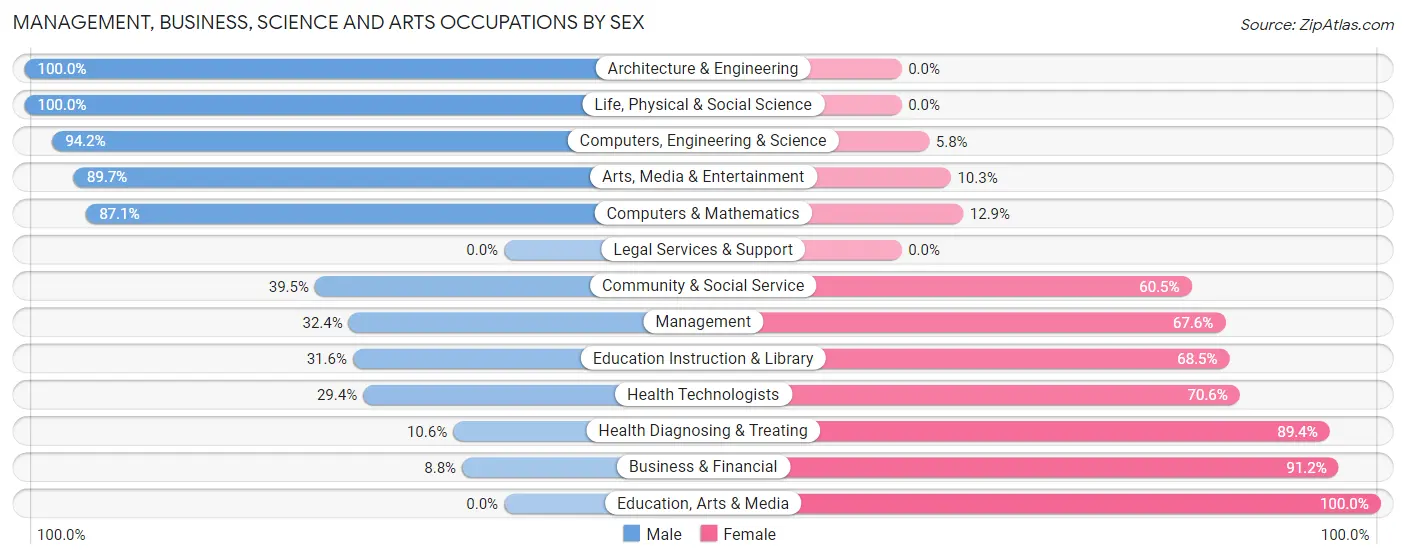
Management, Business, Science and Arts Occupations by Sex
Within the Management, Business, Science and Arts occupations in Pacheco, the most male-oriented occupations are Architecture & Engineering (100.0%), Life, Physical & Social Science (100.0%), and Computers, Engineering & Science (94.2%), while the most female-oriented occupations are Education, Arts & Media (100.0%), Business & Financial (91.2%), and Health Diagnosing & Treating (89.4%).
| Occupation | Male | Female |
| Management | 72 (32.4%) | 150 (67.6%) |
| Business & Financial | 5 (8.8%) | 52 (91.2%) |
| Computers, Engineering & Science | 212 (94.2%) | 13 (5.8%) |
| Computers & Mathematics | 88 (87.1%) | 13 (12.9%) |
| Architecture & Engineering | 84 (100.0%) | 0 (0.0%) |
| Life, Physical & Social Science | 40 (100.0%) | 0 (0.0%) |
| Community & Social Service | 120 (39.5%) | 184 (60.5%) |
| Education, Arts & Media | 0 (0.0%) | 49 (100.0%) |
| Legal Services & Support | 0 (0.0%) | 0 (0.0%) |
| Education Instruction & Library | 59 (31.6%) | 128 (68.4%) |
| Arts, Media & Entertainment | 61 (89.7%) | 7 (10.3%) |
| Health Diagnosing & Treating | 5 (10.6%) | 42 (89.4%) |
| Health Technologists | 5 (29.4%) | 12 (70.6%) |
| Total (Category) | 414 (48.4%) | 441 (51.6%) |
| Total (Overall) | 1,526 (56.1%) | 1,192 (43.9%) |
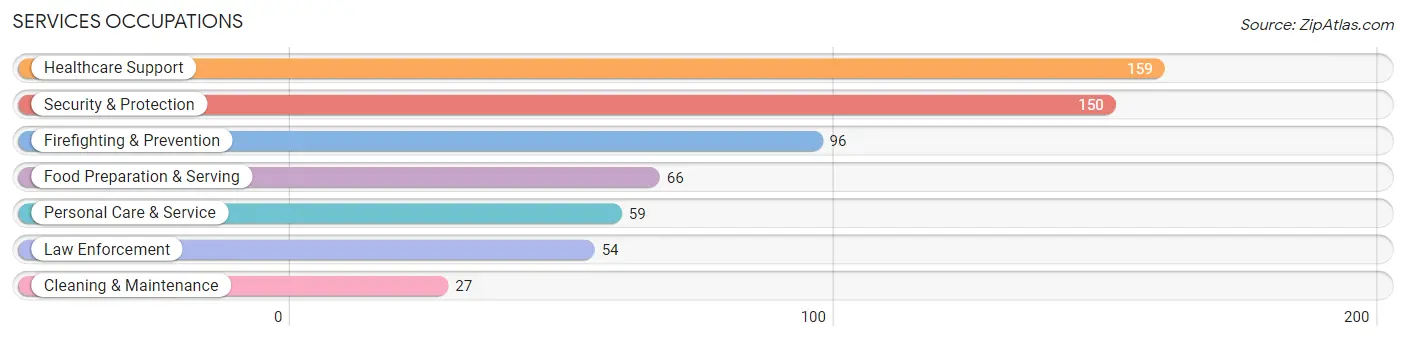
Services Occupations
The most common Services occupations in Pacheco are Healthcare Support (159 | 5.9%), Security & Protection (150 | 5.5%), Firefighting & Prevention (96 | 3.5%), Food Preparation & Serving (66 | 2.4%), and Personal Care & Service (59 | 2.2%).
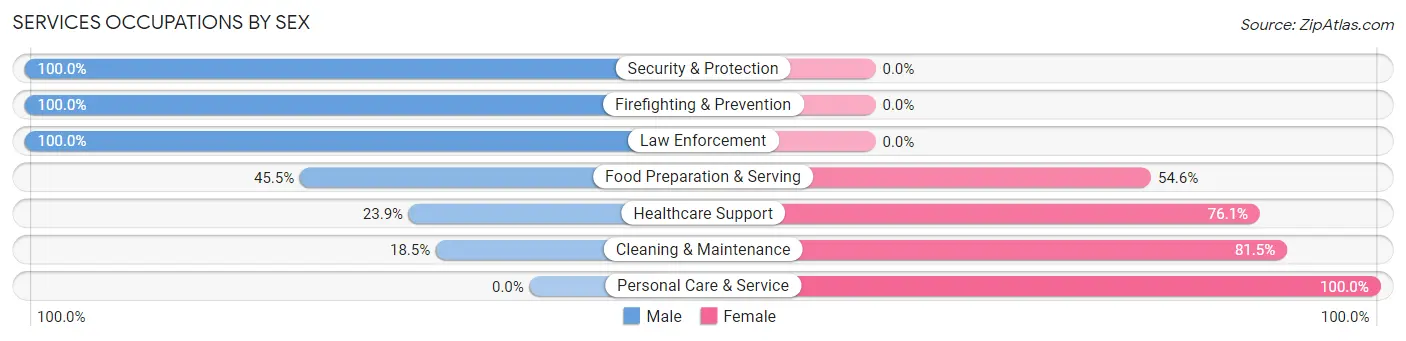
Services Occupations by Sex
Within the Services occupations in Pacheco, the most male-oriented occupations are Security & Protection (100.0%), Firefighting & Prevention (100.0%), and Law Enforcement (100.0%), while the most female-oriented occupations are Personal Care & Service (100.0%), Cleaning & Maintenance (81.5%), and Healthcare Support (76.1%).
| Occupation | Male | Female |
| Healthcare Support | 38 (23.9%) | 121 (76.1%) |
| Security & Protection | 150 (100.0%) | 0 (0.0%) |
| Firefighting & Prevention | 96 (100.0%) | 0 (0.0%) |
| Law Enforcement | 54 (100.0%) | 0 (0.0%) |
| Food Preparation & Serving | 30 (45.5%) | 36 (54.5%) |
| Cleaning & Maintenance | 5 (18.5%) | 22 (81.5%) |
| Personal Care & Service | 0 (0.0%) | 59 (100.0%) |
| Total (Category) | 223 (48.4%) | 238 (51.6%) |
| Total (Overall) | 1,526 (56.1%) | 1,192 (43.9%) |
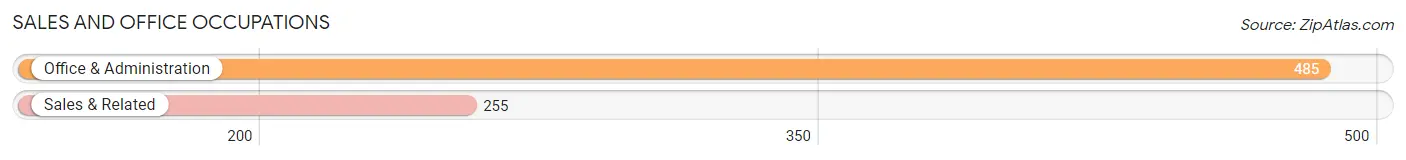
Sales and Office Occupations
The most common Sales and Office occupations in Pacheco are Office & Administration (485 | 17.8%), and Sales & Related (255 | 9.4%).
Sales and Office Occupations by Sex
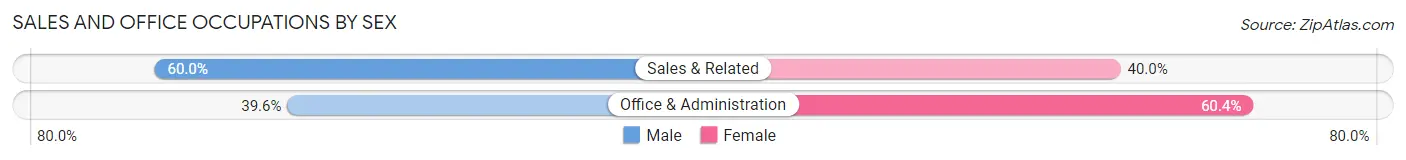
| Occupation | Male | Female |
| Sales & Related | 153 (60.0%) | 102 (40.0%) |
| Office & Administration | 192 (39.6%) | 293 (60.4%) |
| Total (Category) | 345 (46.6%) | 395 (53.4%) |
| Total (Overall) | 1,526 (56.1%) | 1,192 (43.9%) |
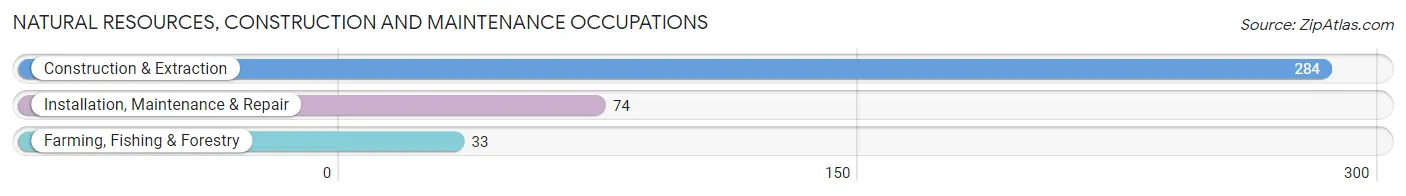
Natural Resources, Construction and Maintenance Occupations
The most common Natural Resources, Construction and Maintenance occupations in Pacheco are Construction & Extraction (284 | 10.4%), Installation, Maintenance & Repair (74 | 2.7%), and Farming, Fishing & Forestry (33 | 1.2%).
Natural Resources, Construction and Maintenance Occupations by Sex
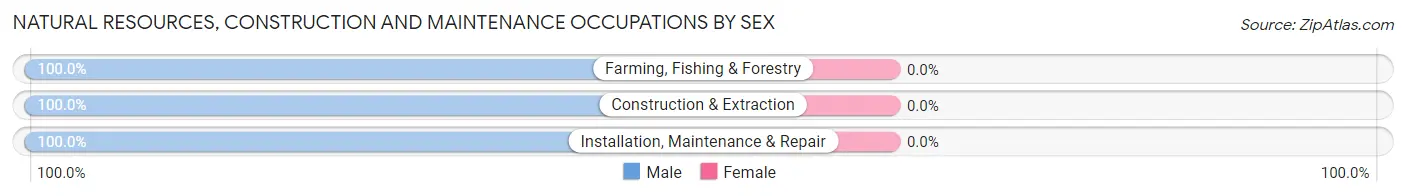
| Occupation | Male | Female |
| Farming, Fishing & Forestry | 33 (100.0%) | 0 (0.0%) |
| Construction & Extraction | 284 (100.0%) | 0 (0.0%) |
| Installation, Maintenance & Repair | 74 (100.0%) | 0 (0.0%) |
| Total (Category) | 391 (100.0%) | 0 (0.0%) |
| Total (Overall) | 1,526 (56.1%) | 1,192 (43.9%) |
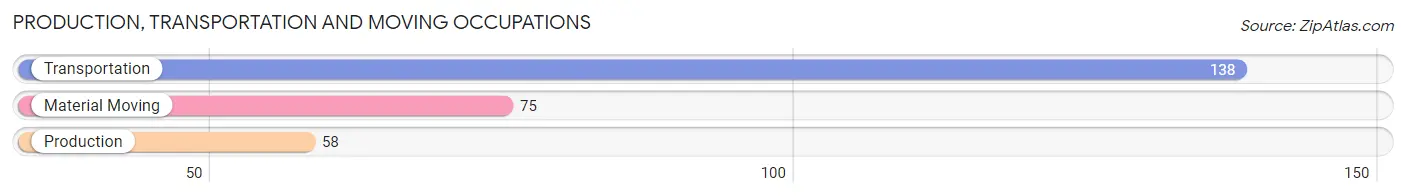
Production, Transportation and Moving Occupations
The most common Production, Transportation and Moving occupations in Pacheco are Transportation (138 | 5.1%), Material Moving (75 | 2.8%), and Production (58 | 2.1%).
Production, Transportation and Moving Occupations by Sex
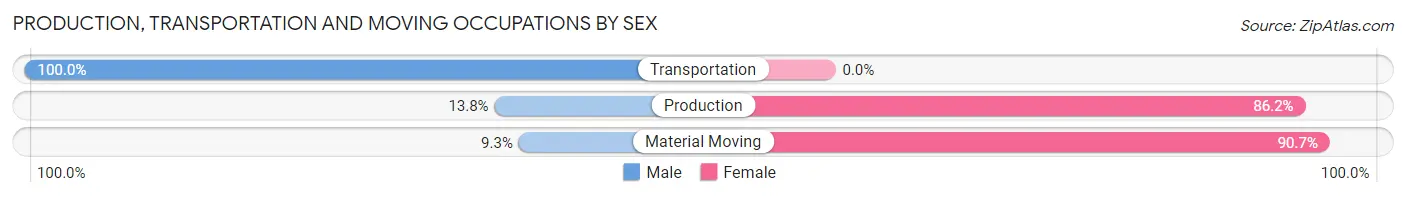
| Occupation | Male | Female |
| Production | 8 (13.8%) | 50 (86.2%) |
| Transportation | 138 (100.0%) | 0 (0.0%) |
| Material Moving | 7 (9.3%) | 68 (90.7%) |
| Total (Category) | 153 (56.5%) | 118 (43.5%) |
| Total (Overall) | 1,526 (56.1%) | 1,192 (43.9%) |
Employment Industries by Sex in Pacheco
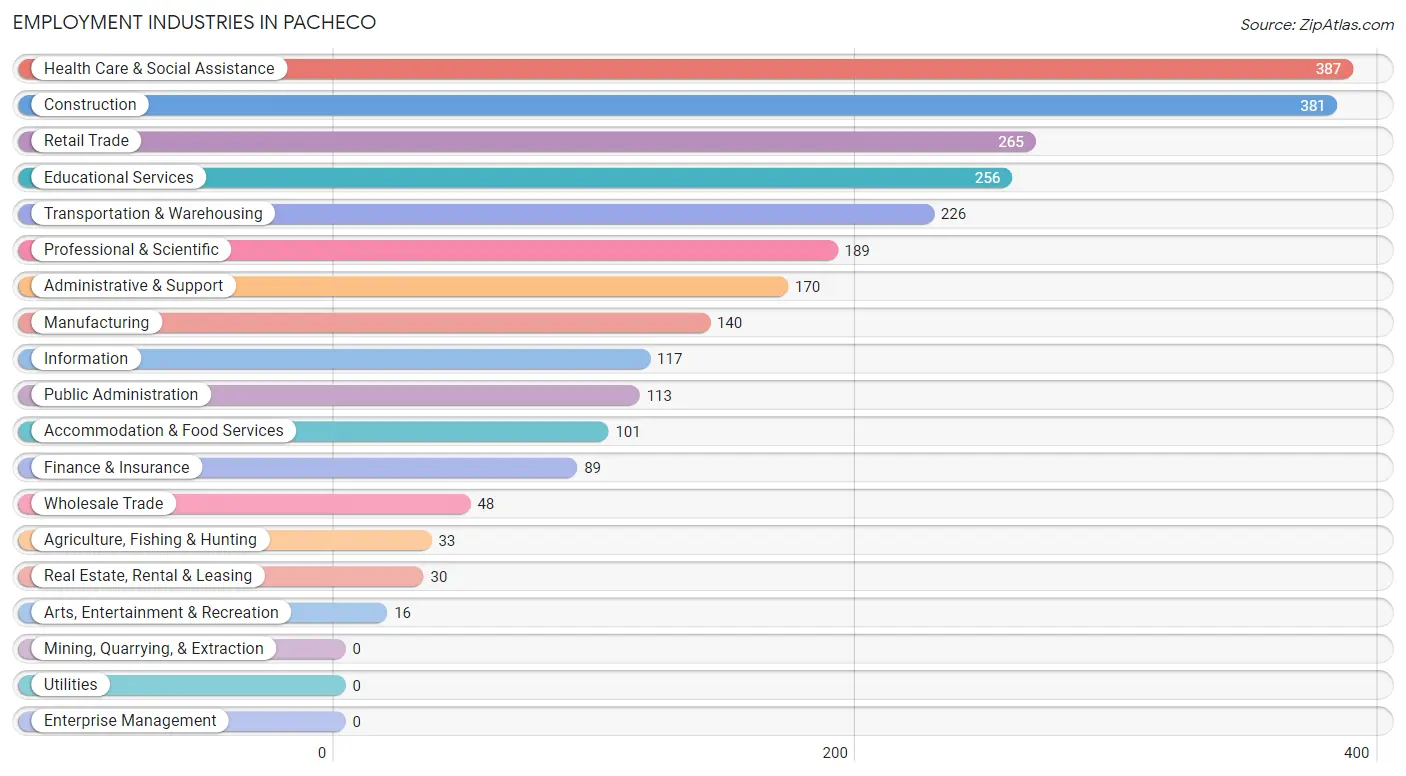
Employment Industries in Pacheco
The major employment industries in Pacheco include Health Care & Social Assistance (387 | 14.2%), Construction (381 | 14.0%), Retail Trade (265 | 9.8%), Educational Services (256 | 9.4%), and Transportation & Warehousing (226 | 8.3%).
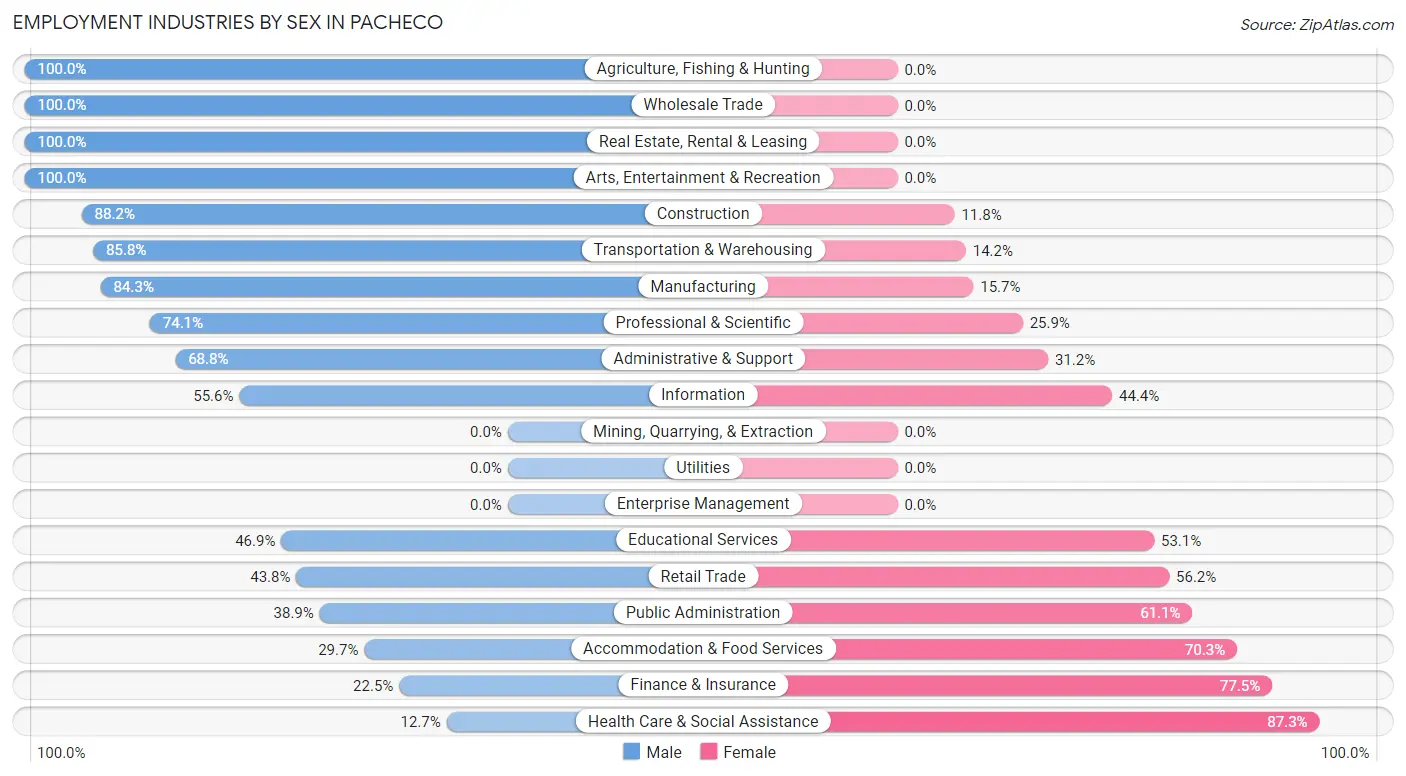
Employment Industries by Sex in Pacheco
The Pacheco industries that see more men than women are Agriculture, Fishing & Hunting (100.0%), Wholesale Trade (100.0%), and Real Estate, Rental & Leasing (100.0%), whereas the industries that tend to have a higher number of women are Health Care & Social Assistance (87.3%), Finance & Insurance (77.5%), and Accommodation & Food Services (70.3%).
| Industry | Male | Female |
| Agriculture, Fishing & Hunting | 33 (100.0%) | 0 (0.0%) |
| Mining, Quarrying, & Extraction | 0 (0.0%) | 0 (0.0%) |
| Construction | 336 (88.2%) | 45 (11.8%) |
| Manufacturing | 118 (84.3%) | 22 (15.7%) |
| Wholesale Trade | 48 (100.0%) | 0 (0.0%) |
| Retail Trade | 116 (43.8%) | 149 (56.2%) |
| Transportation & Warehousing | 194 (85.8%) | 32 (14.2%) |
| Utilities | 0 (0.0%) | 0 (0.0%) |
| Information | 65 (55.6%) | 52 (44.4%) |
| Finance & Insurance | 20 (22.5%) | 69 (77.5%) |
| Real Estate, Rental & Leasing | 30 (100.0%) | 0 (0.0%) |
| Professional & Scientific | 140 (74.1%) | 49 (25.9%) |
| Enterprise Management | 0 (0.0%) | 0 (0.0%) |
| Administrative & Support | 117 (68.8%) | 53 (31.2%) |
| Educational Services | 120 (46.9%) | 136 (53.1%) |
| Health Care & Social Assistance | 49 (12.7%) | 338 (87.3%) |
| Arts, Entertainment & Recreation | 16 (100.0%) | 0 (0.0%) |
| Accommodation & Food Services | 30 (29.7%) | 71 (70.3%) |
| Public Administration | 44 (38.9%) | 69 (61.1%) |
| Total | 1,526 (56.1%) | 1,192 (43.9%) |
Education in Pacheco
School Enrollment in Pacheco
The most common levels of schooling among the 909 students in Pacheco are high school (242 | 26.6%), middle school (225 | 24.7%), and college / undergraduate (149 | 16.4%).
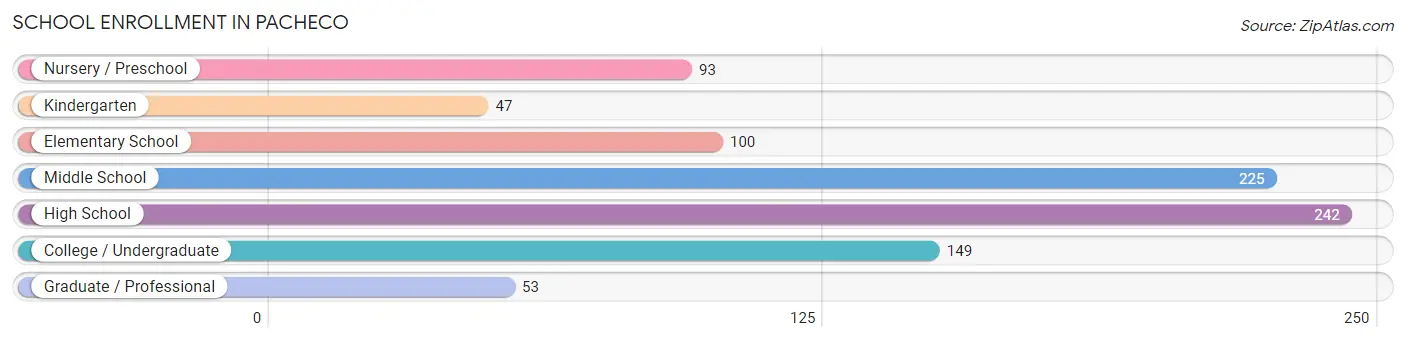
| School Level | # Students | % Students |
| Nursery / Preschool | 93 | 10.2% |
| Kindergarten | 47 | 5.2% |
| Elementary School | 100 | 11.0% |
| Middle School | 225 | 24.7% |
| High School | 242 | 26.6% |
| College / Undergraduate | 149 | 16.4% |
| Graduate / Professional | 53 | 5.8% |
| Total | 909 | 100.0% |
School Enrollment by Age by Funding Source in Pacheco
Out of a total of 909 students who are enrolled in schools in Pacheco, 70 (7.7%) attend a private institution, while the remaining 839 (92.3%) are enrolled in public schools. The age group of 35 years and over has the highest likelihood of being enrolled in private schools, with 15 (24.2% in the age bracket) enrolled. Conversely, the age group of 3 to 4 year olds has the lowest likelihood of being enrolled in a private school, with 67 (100.0% in the age bracket) attending a public institution.
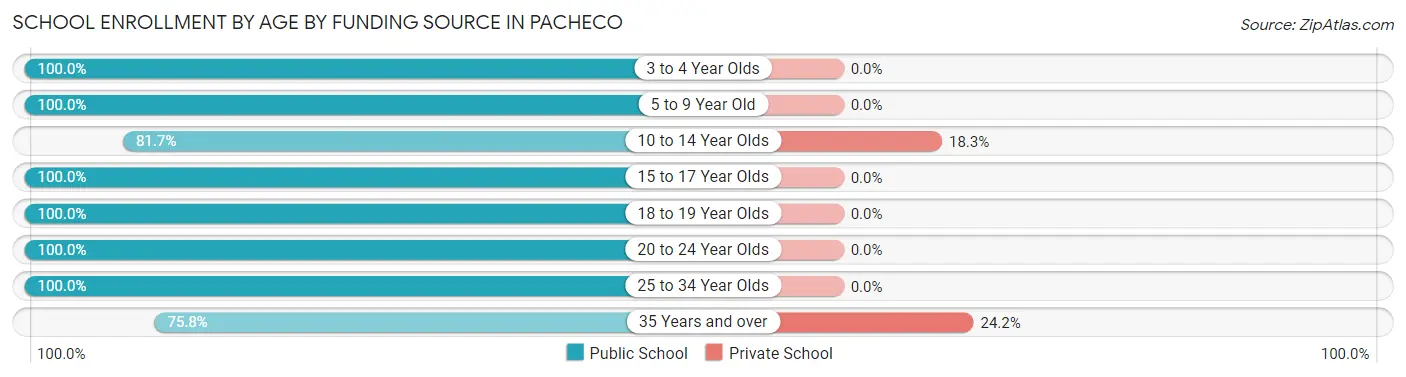
| Age Bracket | Public School | Private School |
| 3 to 4 Year Olds | 67 (100.0%) | 0 (0.0%) |
| 5 to 9 Year Old | 173 (100.0%) | 0 (0.0%) |
| 10 to 14 Year Olds | 245 (81.7%) | 55 (18.3%) |
| 15 to 17 Year Olds | 143 (100.0%) | 0 (0.0%) |
| 18 to 19 Year Olds | 60 (100.0%) | 0 (0.0%) |
| 20 to 24 Year Olds | 66 (100.0%) | 0 (0.0%) |
| 25 to 34 Year Olds | 38 (100.0%) | 0 (0.0%) |
| 35 Years and over | 47 (75.8%) | 15 (24.2%) |
| Total | 839 (92.3%) | 70 (7.7%) |
Educational Attainment by Field of Study in Pacheco
Business (159 | 15.4%), computers & mathematics (112 | 10.9%), literature & languages (99 | 9.6%), bio, nature & agricultural (86 | 8.4%), and engineering (83 | 8.1%) are the most common fields of study among 1,030 individuals in Pacheco who have obtained a bachelor's degree or higher.
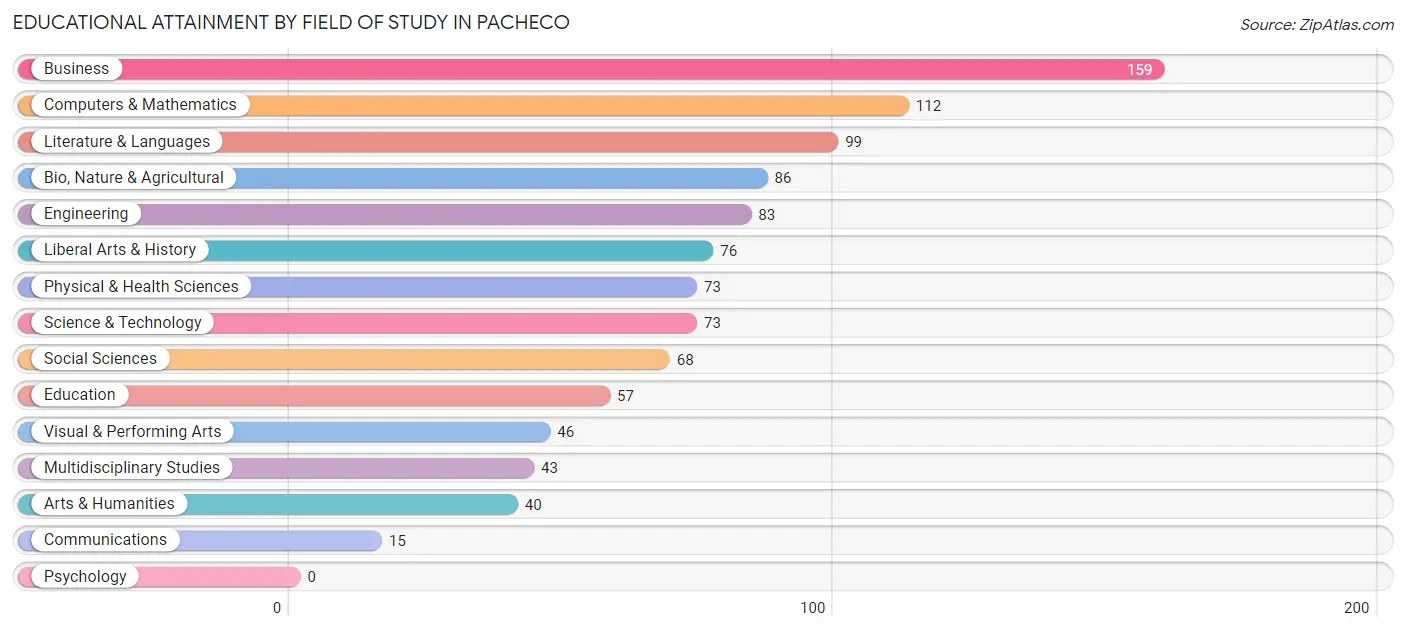
| Field of Study | # Graduates | % Graduates |
| Computers & Mathematics | 112 | 10.9% |
| Bio, Nature & Agricultural | 86 | 8.4% |
| Physical & Health Sciences | 73 | 7.1% |
| Psychology | 0 | 0.0% |
| Social Sciences | 68 | 6.6% |
| Engineering | 83 | 8.1% |
| Multidisciplinary Studies | 43 | 4.2% |
| Science & Technology | 73 | 7.1% |
| Business | 159 | 15.4% |
| Education | 57 | 5.5% |
| Literature & Languages | 99 | 9.6% |
| Liberal Arts & History | 76 | 7.4% |
| Visual & Performing Arts | 46 | 4.5% |
| Communications | 15 | 1.5% |
| Arts & Humanities | 40 | 3.9% |
| Total | 1,030 | 100.0% |
Transportation & Commute in Pacheco
Vehicle Availability by Sex in Pacheco
The most prevalent vehicle ownership categories in Pacheco are males with 2 vehicles (638, accounting for 42.6%) and females with 2 vehicles (596, making up 54.8%).
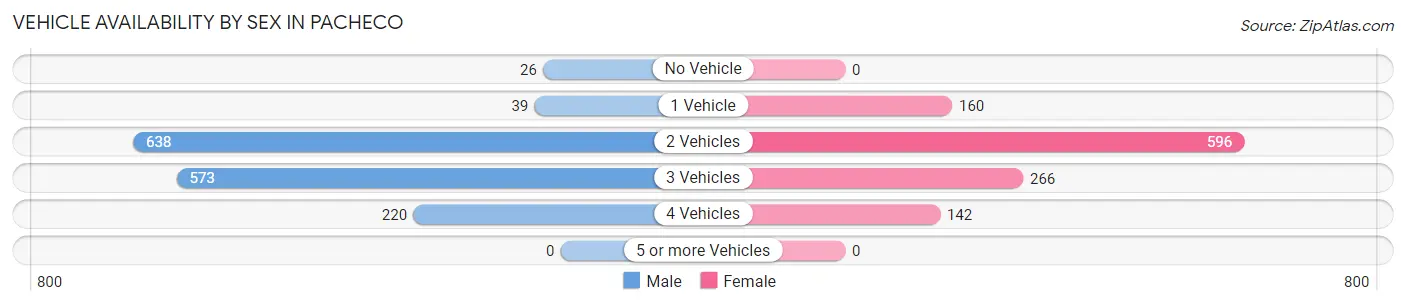
| Vehicles Available | Male | Female |
| No Vehicle | 26 (1.7%) | 0 (0.0%) |
| 1 Vehicle | 39 (2.6%) | 160 (13.8%) |
| 2 Vehicles | 638 (42.6%) | 596 (51.2%) |
| 3 Vehicles | 573 (38.3%) | 266 (22.9%) |
| 4 Vehicles | 220 (14.7%) | 142 (12.2%) |
| 5 or more Vehicles | 0 (0.0%) | 0 (0.0%) |
| Total | 1,496 (100.0%) | 1,164 (100.0%) |
Commute Time in Pacheco
The most frequently occuring commute durations in Pacheco are 15 to 19 minutes (432 commuters, 17.8%), 20 to 24 minutes (331 commuters, 13.7%), and 60 to 89 minutes (281 commuters, 11.6%).
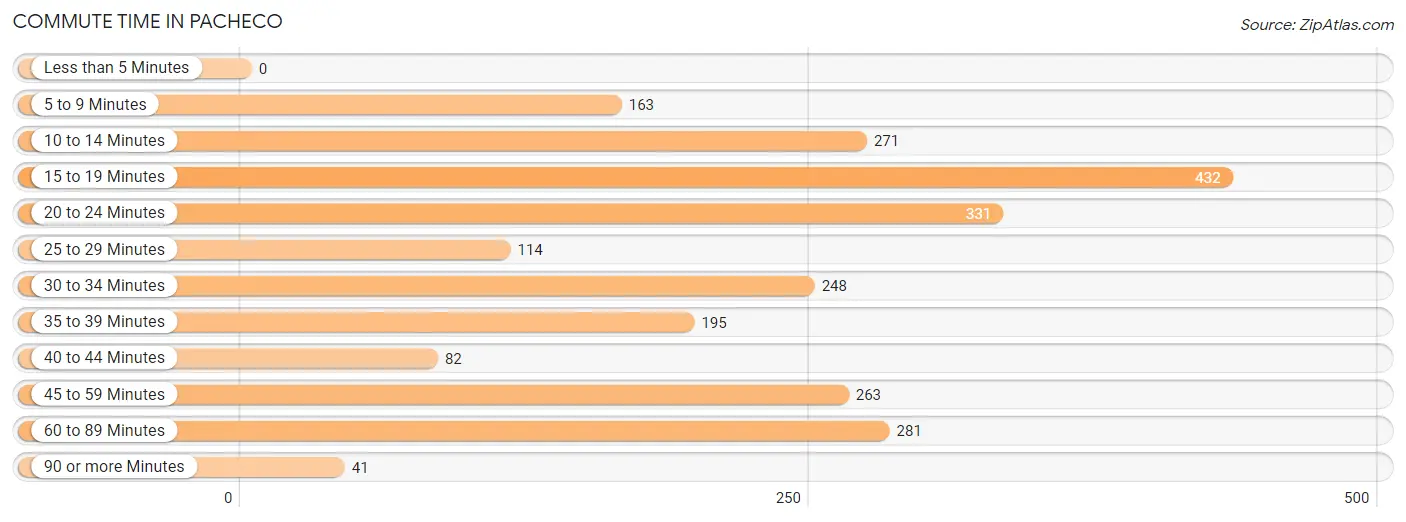
| Commute Time | # Commuters | % Commuters |
| Less than 5 Minutes | 0 | 0.0% |
| 5 to 9 Minutes | 163 | 6.7% |
| 10 to 14 Minutes | 271 | 11.2% |
| 15 to 19 Minutes | 432 | 17.8% |
| 20 to 24 Minutes | 331 | 13.7% |
| 25 to 29 Minutes | 114 | 4.7% |
| 30 to 34 Minutes | 248 | 10.2% |
| 35 to 39 Minutes | 195 | 8.1% |
| 40 to 44 Minutes | 82 | 3.4% |
| 45 to 59 Minutes | 263 | 10.9% |
| 60 to 89 Minutes | 281 | 11.6% |
| 90 or more Minutes | 41 | 1.7% |
Commute Time by Sex in Pacheco
The most common commute times in Pacheco are 45 to 59 minutes (253 commuters, 18.0%) for males and 15 to 19 minutes (279 commuters, 27.5%) for females.
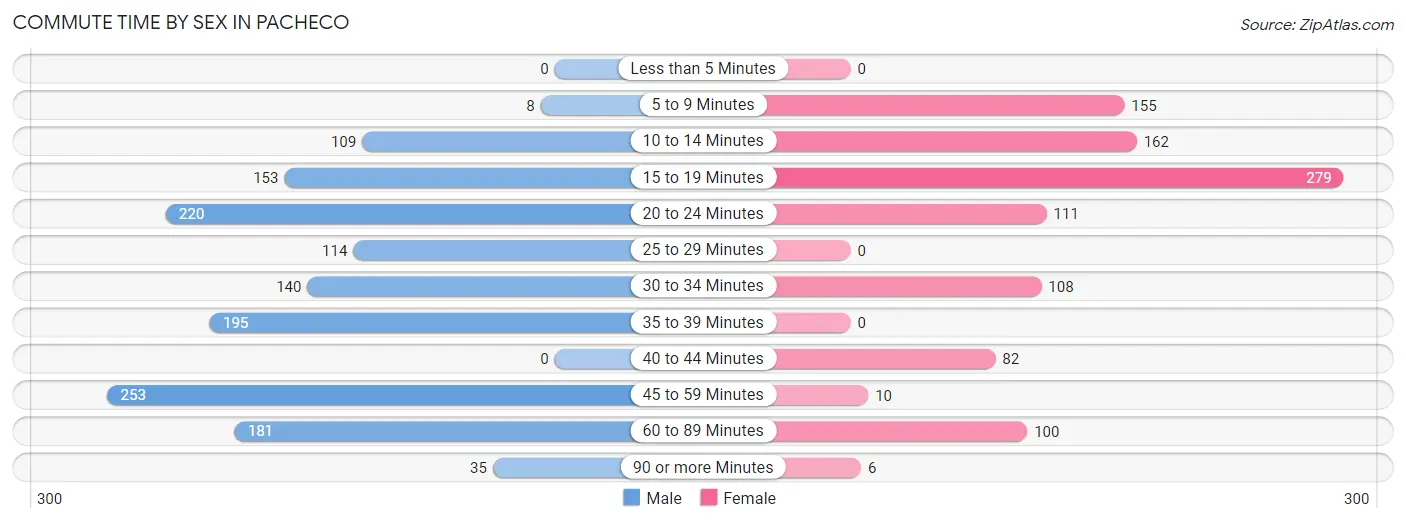
| Commute Time | Male | Female |
| Less than 5 Minutes | 0 (0.0%) | 0 (0.0%) |
| 5 to 9 Minutes | 8 (0.6%) | 155 (15.3%) |
| 10 to 14 Minutes | 109 (7.7%) | 162 (16.0%) |
| 15 to 19 Minutes | 153 (10.9%) | 279 (27.5%) |
| 20 to 24 Minutes | 220 (15.6%) | 111 (11.0%) |
| 25 to 29 Minutes | 114 (8.1%) | 0 (0.0%) |
| 30 to 34 Minutes | 140 (9.9%) | 108 (10.7%) |
| 35 to 39 Minutes | 195 (13.9%) | 0 (0.0%) |
| 40 to 44 Minutes | 0 (0.0%) | 82 (8.1%) |
| 45 to 59 Minutes | 253 (18.0%) | 10 (1.0%) |
| 60 to 89 Minutes | 181 (12.9%) | 100 (9.9%) |
| 90 or more Minutes | 35 (2.5%) | 6 (0.6%) |
Time of Departure to Work by Sex in Pacheco
The most frequent times of departure to work in Pacheco are 6:00 AM to 6:29 AM (197, 14.0%) for males and 7:00 AM to 7:29 AM (285, 28.1%) for females.
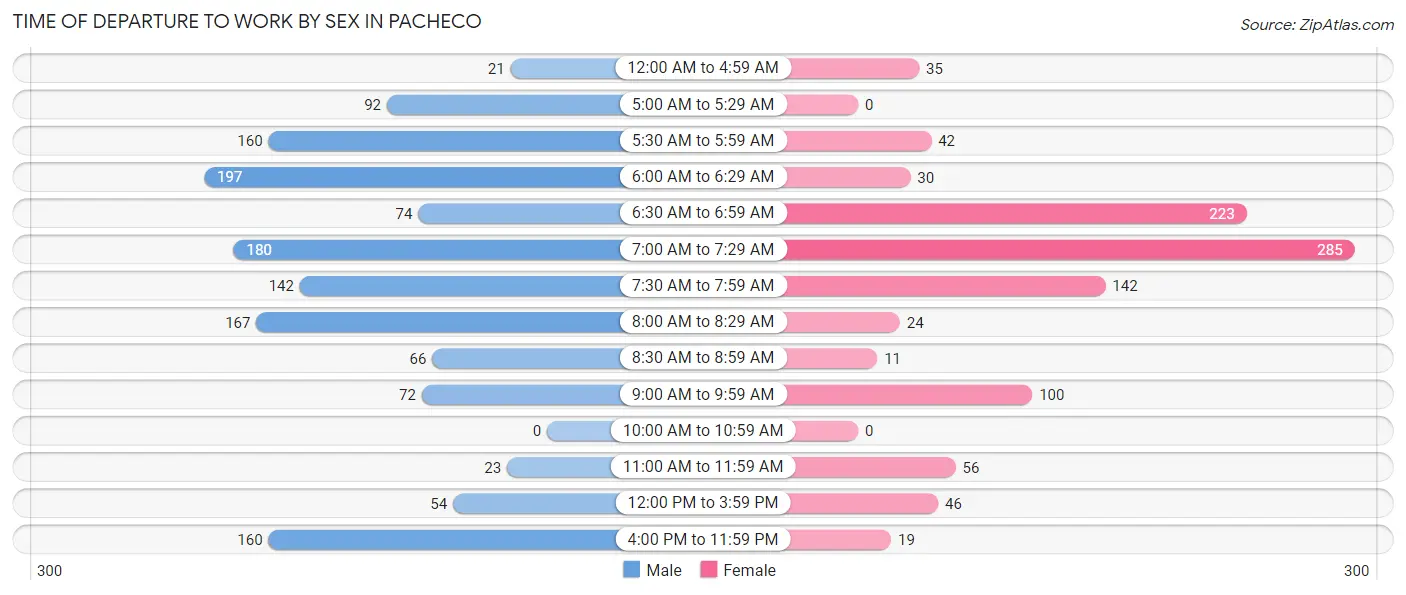
| Time of Departure | Male | Female |
| 12:00 AM to 4:59 AM | 21 (1.5%) | 35 (3.5%) |
| 5:00 AM to 5:29 AM | 92 (6.5%) | 0 (0.0%) |
| 5:30 AM to 5:59 AM | 160 (11.4%) | 42 (4.2%) |
| 6:00 AM to 6:29 AM | 197 (14.0%) | 30 (3.0%) |
| 6:30 AM to 6:59 AM | 74 (5.3%) | 223 (22.0%) |
| 7:00 AM to 7:29 AM | 180 (12.8%) | 285 (28.1%) |
| 7:30 AM to 7:59 AM | 142 (10.1%) | 142 (14.0%) |
| 8:00 AM to 8:29 AM | 167 (11.9%) | 24 (2.4%) |
| 8:30 AM to 8:59 AM | 66 (4.7%) | 11 (1.1%) |
| 9:00 AM to 9:59 AM | 72 (5.1%) | 100 (9.9%) |
| 10:00 AM to 10:59 AM | 0 (0.0%) | 0 (0.0%) |
| 11:00 AM to 11:59 AM | 23 (1.6%) | 56 (5.5%) |
| 12:00 PM to 3:59 PM | 54 (3.8%) | 46 (4.5%) |
| 4:00 PM to 11:59 PM | 160 (11.4%) | 19 (1.9%) |
| Total | 1,408 (100.0%) | 1,013 (100.0%) |
Housing Occupancy in Pacheco
Occupancy by Ownership in Pacheco
Of the total 1,950 dwellings in Pacheco, owner-occupied units account for 1,453 (74.5%), while renter-occupied units make up 497 (25.5%).
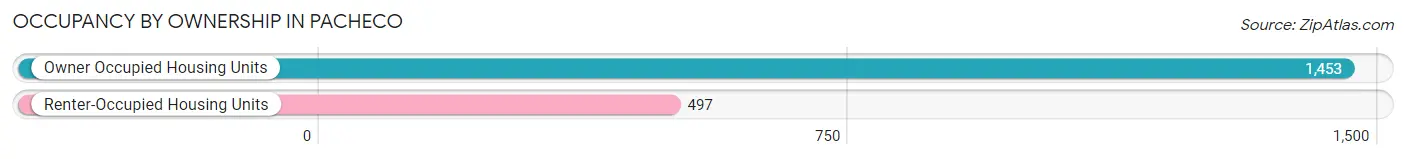
| Occupancy | # Housing Units | % Housing Units |
| Owner Occupied Housing Units | 1,453 | 74.5% |
| Renter-Occupied Housing Units | 497 | 25.5% |
| Total Occupied Housing Units | 1,950 | 100.0% |
Occupancy by Household Size in Pacheco
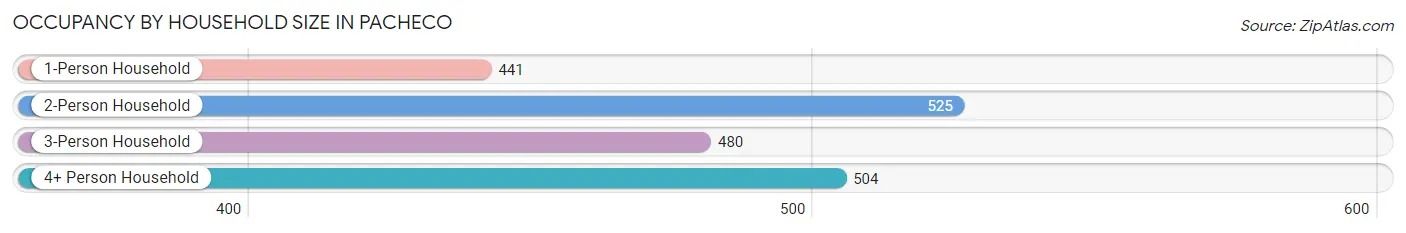
| Household Size | # Housing Units | % Housing Units |
| 1-Person Household | 441 | 22.6% |
| 2-Person Household | 525 | 26.9% |
| 3-Person Household | 480 | 24.6% |
| 4+ Person Household | 504 | 25.9% |
| Total Housing Units | 1,950 | 100.0% |
Occupancy by Ownership by Household Size in Pacheco
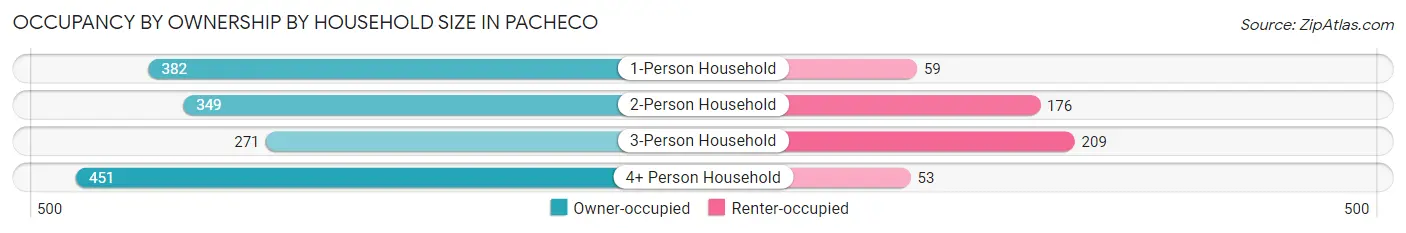
| Household Size | Owner-occupied | Renter-occupied |
| 1-Person Household | 382 (86.6%) | 59 (13.4%) |
| 2-Person Household | 349 (66.5%) | 176 (33.5%) |
| 3-Person Household | 271 (56.5%) | 209 (43.5%) |
| 4+ Person Household | 451 (89.5%) | 53 (10.5%) |
| Total Housing Units | 1,453 (74.5%) | 497 (25.5%) |
Occupancy by Educational Attainment in Pacheco
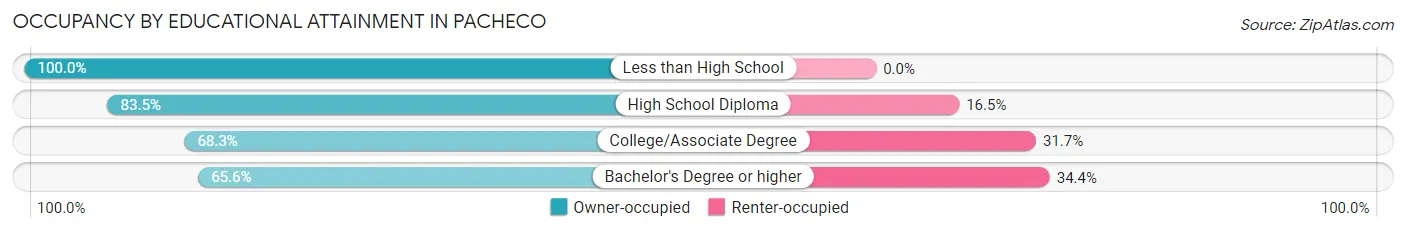
| Household Size | Owner-occupied | Renter-occupied |
| Less than High School | 212 (100.0%) | 0 (0.0%) |
| High School Diploma | 355 (83.5%) | 70 (16.5%) |
| College/Associate Degree | 627 (68.3%) | 291 (31.7%) |
| Bachelor's Degree or higher | 259 (65.6%) | 136 (34.4%) |
Occupancy by Age of Householder in Pacheco
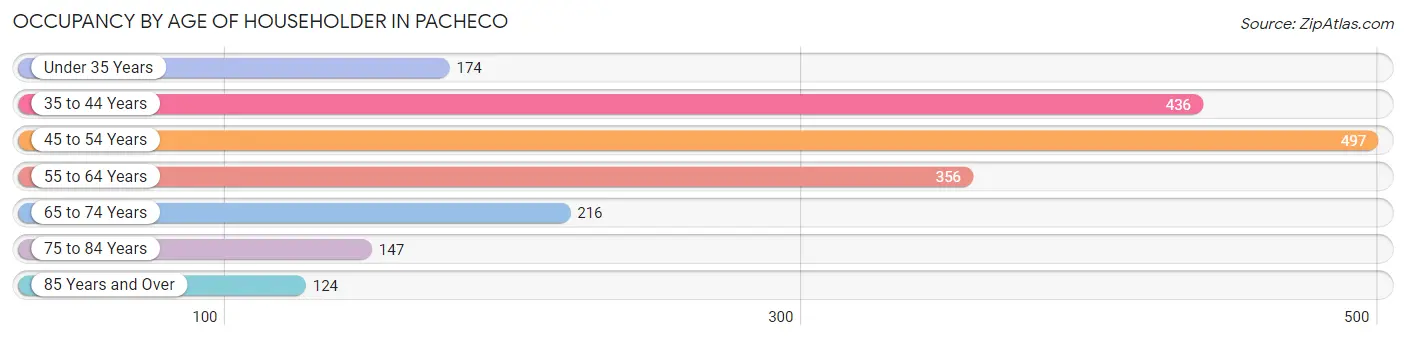
| Age Bracket | # Households | % Households |
| Under 35 Years | 174 | 8.9% |
| 35 to 44 Years | 436 | 22.4% |
| 45 to 54 Years | 497 | 25.5% |
| 55 to 64 Years | 356 | 18.3% |
| 65 to 74 Years | 216 | 11.1% |
| 75 to 84 Years | 147 | 7.5% |
| 85 Years and Over | 124 | 6.4% |
| Total | 1,950 | 100.0% |
Housing Finances in Pacheco
Median Income by Occupancy in Pacheco
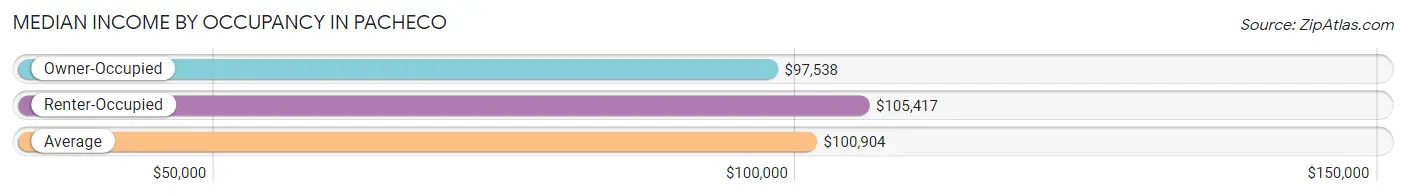
| Occupancy Type | # Households | Median Income |
| Owner-Occupied | 1,453 (74.5%) | $97,538 |
| Renter-Occupied | 497 (25.5%) | $105,417 |
| Average | 1,950 (100.0%) | $100,904 |
Occupancy by Householder Income Bracket in Pacheco
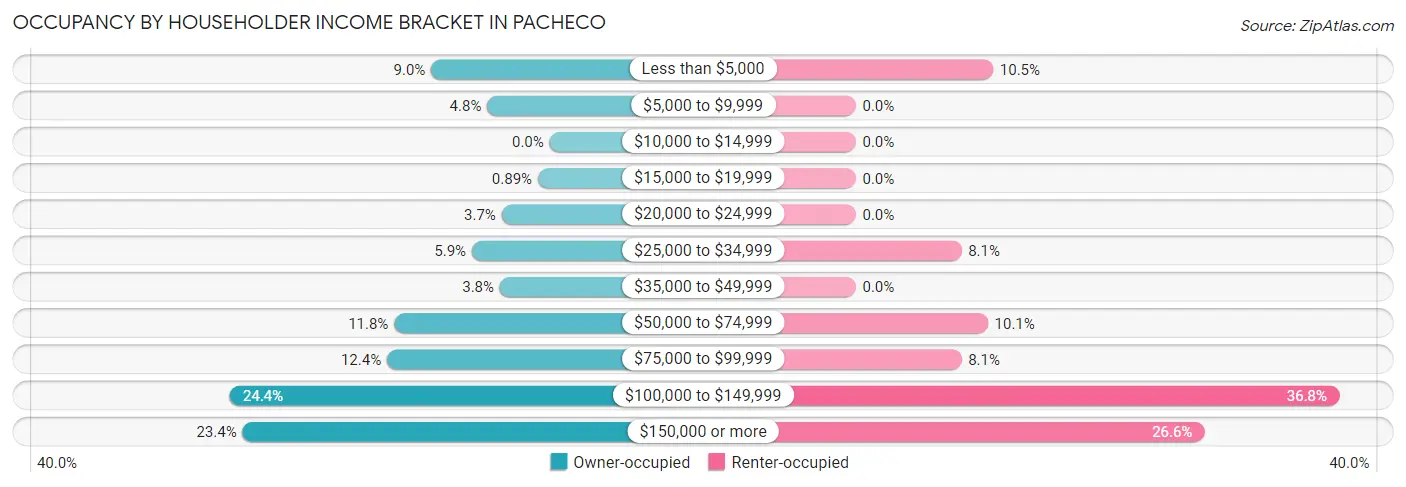
| Income Bracket | Owner-occupied | Renter-occupied |
| Less than $5,000 | 131 (9.0%) | 52 (10.5%) |
| $5,000 to $9,999 | 69 (4.8%) | 0 (0.0%) |
| $10,000 to $14,999 | 0 (0.0%) | 0 (0.0%) |
| $15,000 to $19,999 | 13 (0.9%) | 0 (0.0%) |
| $20,000 to $24,999 | 53 (3.6%) | 0 (0.0%) |
| $25,000 to $34,999 | 86 (5.9%) | 40 (8.1%) |
| $35,000 to $49,999 | 55 (3.8%) | 0 (0.0%) |
| $50,000 to $74,999 | 172 (11.8%) | 50 (10.1%) |
| $75,000 to $99,999 | 180 (12.4%) | 40 (8.1%) |
| $100,000 to $149,999 | 354 (24.4%) | 183 (36.8%) |
| $150,000 or more | 340 (23.4%) | 132 (26.6%) |
| Total | 1,453 (100.0%) | 497 (100.0%) |
Monthly Housing Cost Tiers in Pacheco
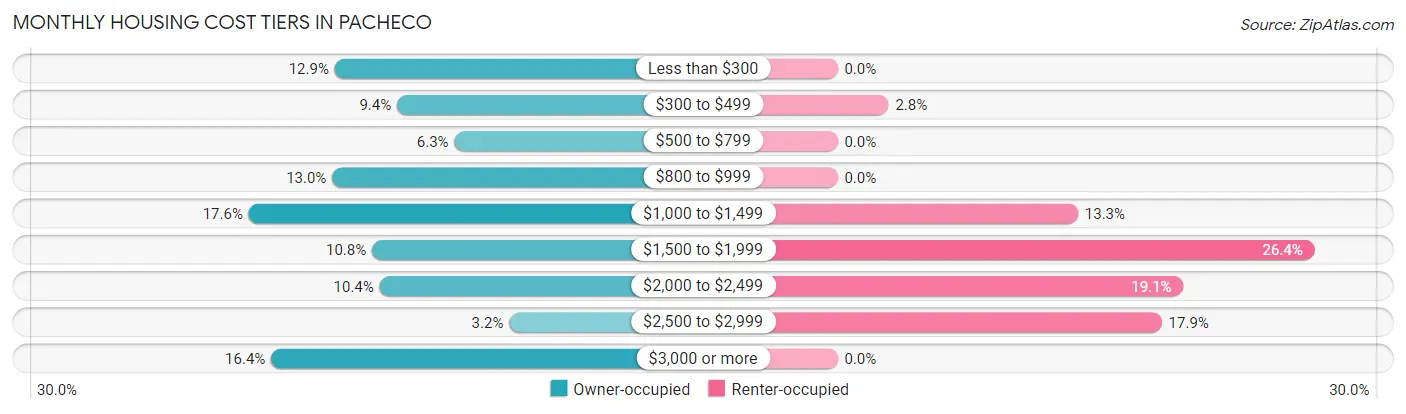
| Monthly Cost | Owner-occupied | Renter-occupied |
| Less than $300 | 187 (12.9%) | 0 (0.0%) |
| $300 to $499 | 137 (9.4%) | 14 (2.8%) |
| $500 to $799 | 91 (6.3%) | 0 (0.0%) |
| $800 to $999 | 189 (13.0%) | 0 (0.0%) |
| $1,000 to $1,499 | 256 (17.6%) | 66 (13.3%) |
| $1,500 to $1,999 | 157 (10.8%) | 131 (26.4%) |
| $2,000 to $2,499 | 151 (10.4%) | 95 (19.1%) |
| $2,500 to $2,999 | 47 (3.2%) | 89 (17.9%) |
| $3,000 or more | 238 (16.4%) | 0 (0.0%) |
| Total | 1,453 (100.0%) | 497 (100.0%) |
Physical Housing Characteristics in Pacheco
Housing Structures in Pacheco
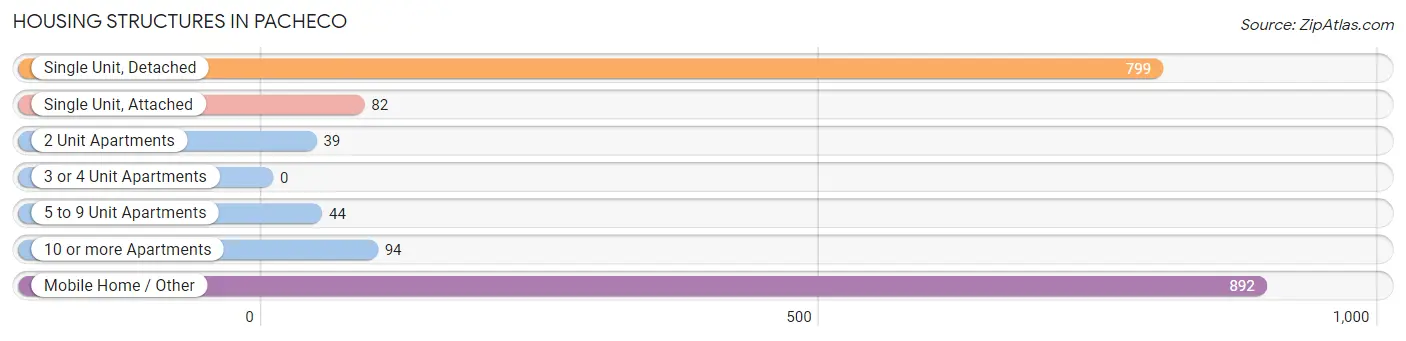
| Structure Type | # Housing Units | % Housing Units |
| Single Unit, Detached | 799 | 41.0% |
| Single Unit, Attached | 82 | 4.2% |
| 2 Unit Apartments | 39 | 2.0% |
| 3 or 4 Unit Apartments | 0 | 0.0% |
| 5 to 9 Unit Apartments | 44 | 2.3% |
| 10 or more Apartments | 94 | 4.8% |
| Mobile Home / Other | 892 | 45.7% |
| Total | 1,950 | 100.0% |
Housing Structures by Occupancy in Pacheco
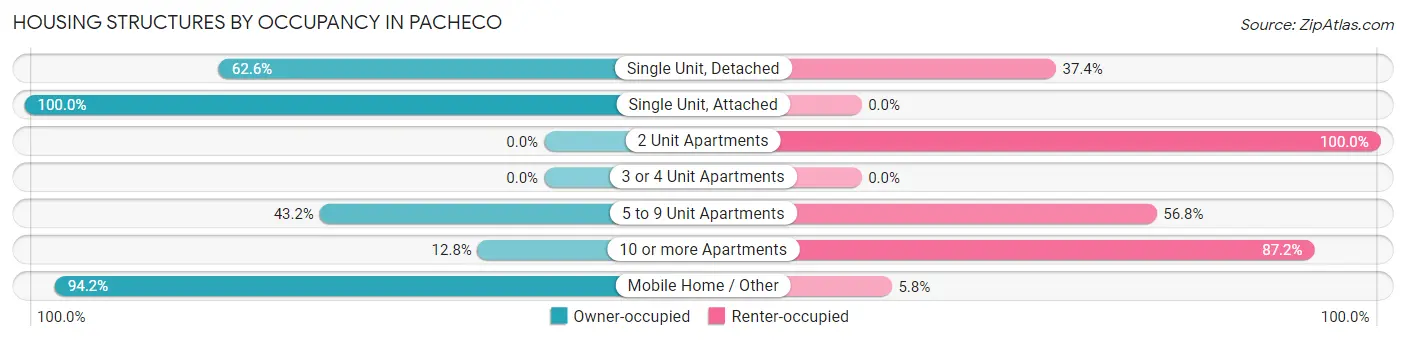
| Structure Type | Owner-occupied | Renter-occupied |
| Single Unit, Detached | 500 (62.6%) | 299 (37.4%) |
| Single Unit, Attached | 82 (100.0%) | 0 (0.0%) |
| 2 Unit Apartments | 0 (0.0%) | 39 (100.0%) |
| 3 or 4 Unit Apartments | 0 (0.0%) | 0 (0.0%) |
| 5 to 9 Unit Apartments | 19 (43.2%) | 25 (56.8%) |
| 10 or more Apartments | 12 (12.8%) | 82 (87.2%) |
| Mobile Home / Other | 840 (94.2%) | 52 (5.8%) |
| Total | 1,453 (74.5%) | 497 (25.5%) |
Housing Structures by Number of Rooms in Pacheco
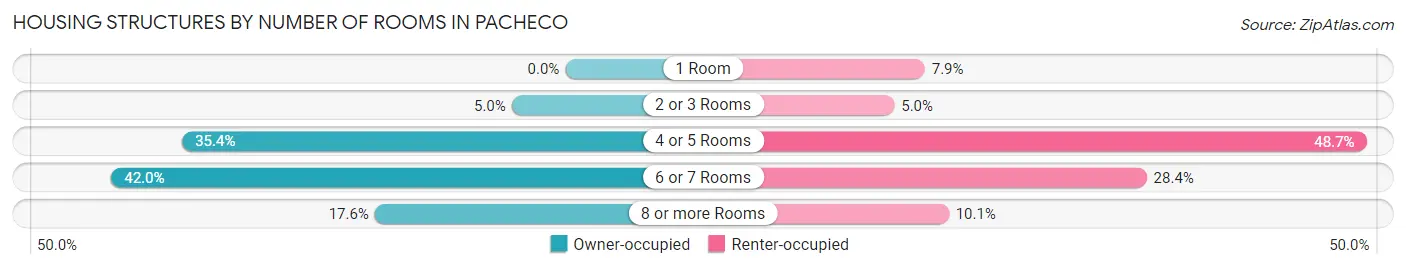
| Number of Rooms | Owner-occupied | Renter-occupied |
| 1 Room | 0 (0.0%) | 39 (7.9%) |
| 2 or 3 Rooms | 72 (5.0%) | 25 (5.0%) |
| 4 or 5 Rooms | 515 (35.4%) | 242 (48.7%) |
| 6 or 7 Rooms | 610 (42.0%) | 141 (28.4%) |
| 8 or more Rooms | 256 (17.6%) | 50 (10.1%) |
| Total | 1,453 (100.0%) | 497 (100.0%) |
Housing Structure by Heating Type in Pacheco
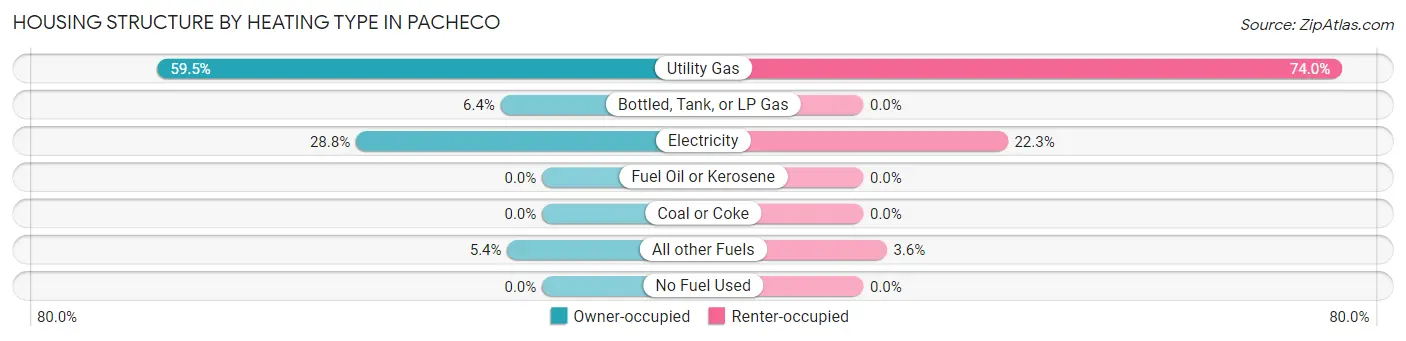
| Heating Type | Owner-occupied | Renter-occupied |
| Utility Gas | 864 (59.5%) | 368 (74.0%) |
| Bottled, Tank, or LP Gas | 93 (6.4%) | 0 (0.0%) |
| Electricity | 418 (28.8%) | 111 (22.3%) |
| Fuel Oil or Kerosene | 0 (0.0%) | 0 (0.0%) |
| Coal or Coke | 0 (0.0%) | 0 (0.0%) |
| All other Fuels | 78 (5.4%) | 18 (3.6%) |
| No Fuel Used | 0 (0.0%) | 0 (0.0%) |
| Total | 1,453 (100.0%) | 497 (100.0%) |
Household Vehicle Usage in Pacheco
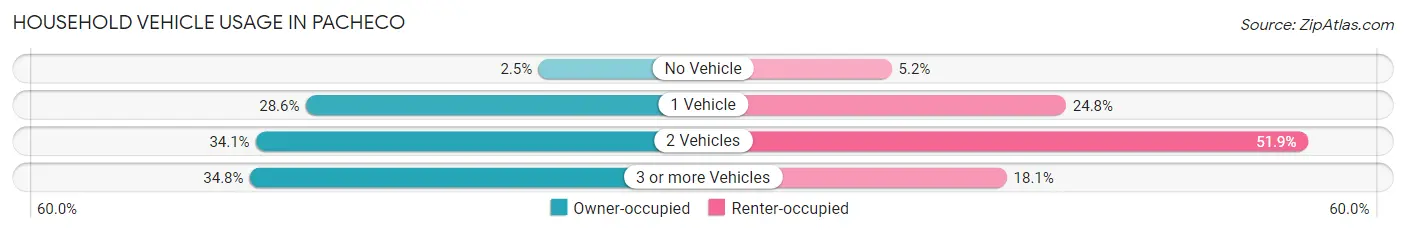
| Vehicles per Household | Owner-occupied | Renter-occupied |
| No Vehicle | 36 (2.5%) | 26 (5.2%) |
| 1 Vehicle | 415 (28.6%) | 123 (24.7%) |
| 2 Vehicles | 496 (34.1%) | 258 (51.9%) |
| 3 or more Vehicles | 506 (34.8%) | 90 (18.1%) |
| Total | 1,453 (100.0%) | 497 (100.0%) |
Real Estate & Mortgages in Pacheco
Real Estate and Mortgage Overview in Pacheco
| Characteristic | Without Mortgage | With Mortgage |
| Housing Units | 911 | 542 |
| Median Property Value | $126,000 | $622,400 |
| Median Household Income | $75,824 | $211 |
| Monthly Housing Costs | $929 | $238 |
| Real Estate Taxes | - | - |
Property Value by Mortgage Status in Pacheco
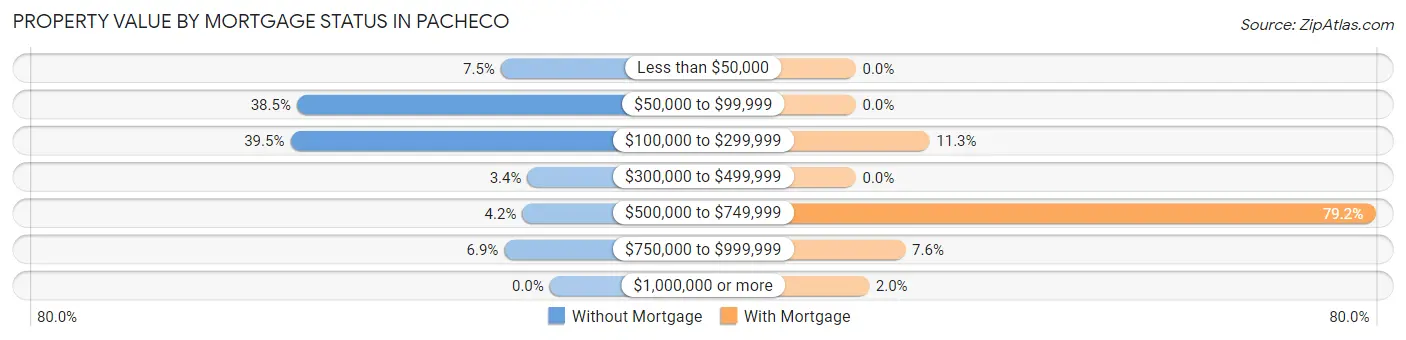
| Property Value | Without Mortgage | With Mortgage |
| Less than $50,000 | 68 (7.5%) | 0 (0.0%) |
| $50,000 to $99,999 | 351 (38.5%) | 0 (0.0%) |
| $100,000 to $299,999 | 360 (39.5%) | 61 (11.3%) |
| $300,000 to $499,999 | 31 (3.4%) | 0 (0.0%) |
| $500,000 to $749,999 | 38 (4.2%) | 429 (79.1%) |
| $750,000 to $999,999 | 63 (6.9%) | 41 (7.6%) |
| $1,000,000 or more | 0 (0.0%) | 11 (2.0%) |
| Total | 911 (100.0%) | 542 (100.0%) |
Household Income by Mortgage Status in Pacheco
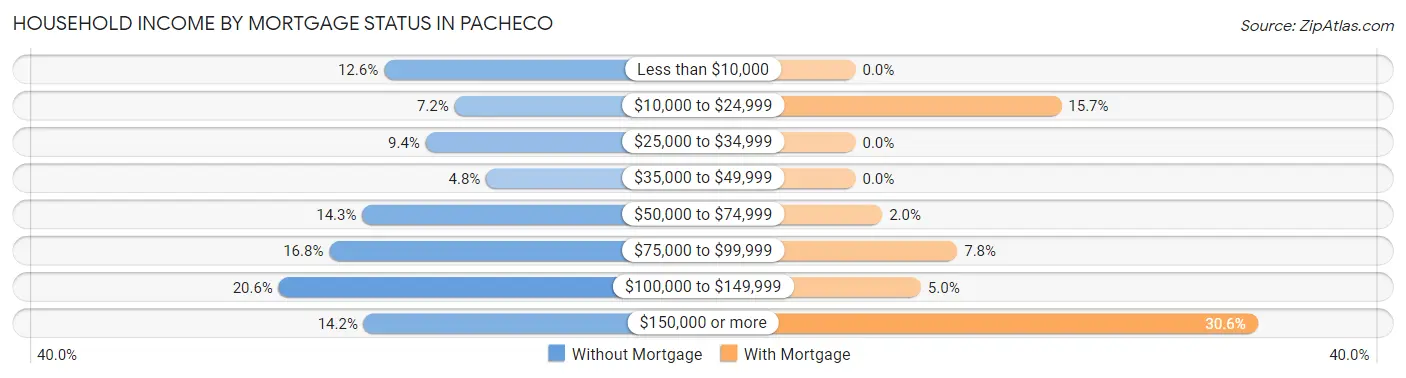
| Household Income | Without Mortgage | With Mortgage |
| Less than $10,000 | 115 (12.6%) | 0 (0.0%) |
| $10,000 to $24,999 | 66 (7.2%) | 85 (15.7%) |
| $25,000 to $34,999 | 86 (9.4%) | 0 (0.0%) |
| $35,000 to $49,999 | 44 (4.8%) | 0 (0.0%) |
| $50,000 to $74,999 | 130 (14.3%) | 11 (2.0%) |
| $75,000 to $99,999 | 153 (16.8%) | 42 (7.7%) |
| $100,000 to $149,999 | 188 (20.6%) | 27 (5.0%) |
| $150,000 or more | 129 (14.2%) | 166 (30.6%) |
| Total | 911 (100.0%) | 542 (100.0%) |
Property Value to Household Income Ratio in Pacheco
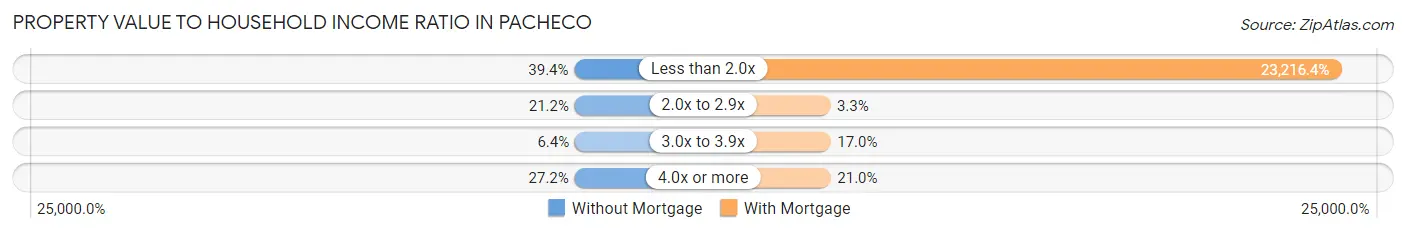
| Value-to-Income Ratio | Without Mortgage | With Mortgage |
| Less than 2.0x | 359 (39.4%) | 125,833 (23,216.4%) |
| 2.0x to 2.9x | 193 (21.2%) | 18 (3.3%) |
| 3.0x to 3.9x | 58 (6.4%) | 92 (17.0%) |
| 4.0x or more | 248 (27.2%) | 114 (21.0%) |
| Total | 911 (100.0%) | 542 (100.0%) |
Real Estate Taxes by Mortgage Status in Pacheco
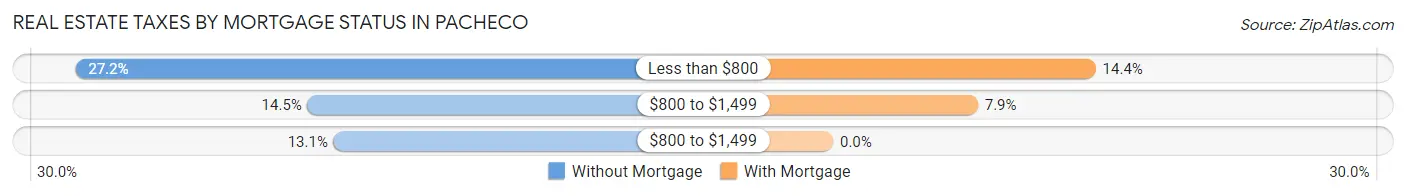
| Property Taxes | Without Mortgage | With Mortgage |
| Less than $800 | 248 (27.2%) | 78 (14.4%) |
| $800 to $1,499 | 132 (14.5%) | 43 (7.9%) |
| $800 to $1,499 | 119 (13.1%) | 0 (0.0%) |
| Total | 911 (100.0%) | 542 (100.0%) |
Health & Disability in Pacheco
Health Insurance Coverage by Age in Pacheco
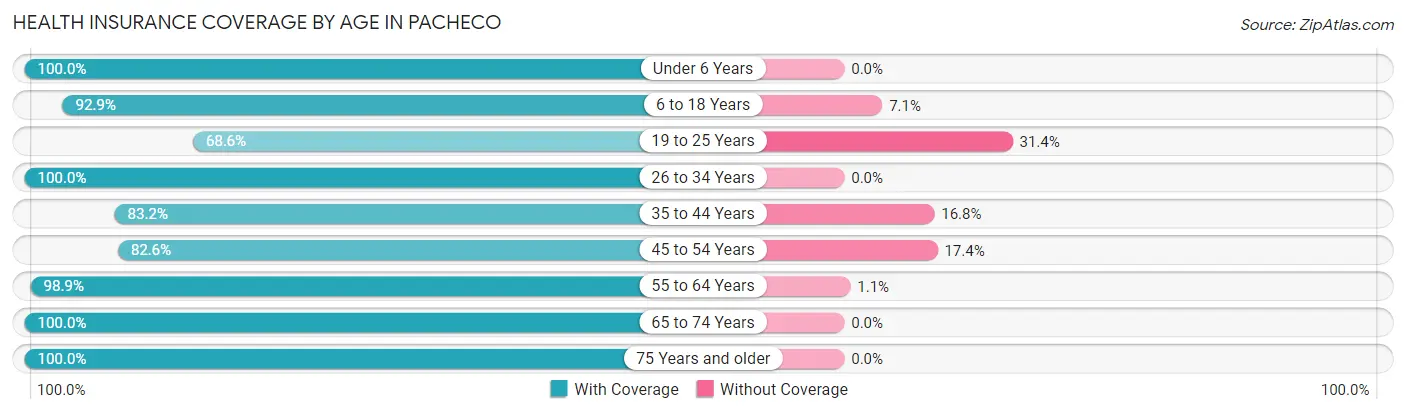
| Age Bracket | With Coverage | Without Coverage |
| Under 6 Years | 244 (100.0%) | 0 (0.0%) |
| 6 to 18 Years | 551 (92.9%) | 42 (7.1%) |
| 19 to 25 Years | 293 (68.6%) | 134 (31.4%) |
| 26 to 34 Years | 544 (100.0%) | 0 (0.0%) |
| 35 to 44 Years | 689 (83.2%) | 139 (16.8%) |
| 45 to 54 Years | 732 (82.6%) | 154 (17.4%) |
| 55 to 64 Years | 611 (98.9%) | 7 (1.1%) |
| 65 to 74 Years | 514 (100.0%) | 0 (0.0%) |
| 75 Years and older | 387 (100.0%) | 0 (0.0%) |
| Total | 4,565 (90.6%) | 476 (9.4%) |
Health Insurance Coverage by Citizenship Status in Pacheco
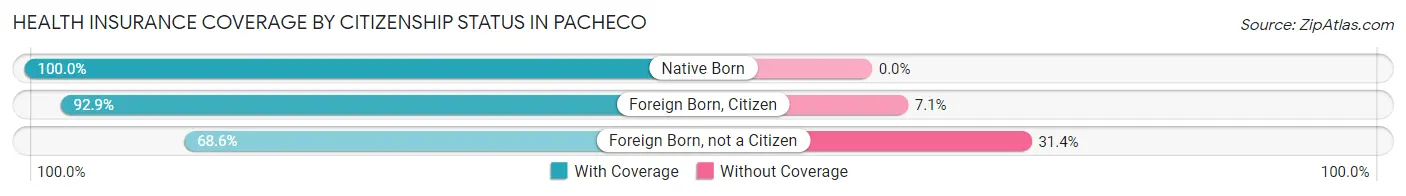
| Citizenship Status | With Coverage | Without Coverage |
| Native Born | 244 (100.0%) | 0 (0.0%) |
| Foreign Born, Citizen | 551 (92.9%) | 42 (7.1%) |
| Foreign Born, not a Citizen | 293 (68.6%) | 134 (31.4%) |
Health Insurance Coverage by Household Income in Pacheco
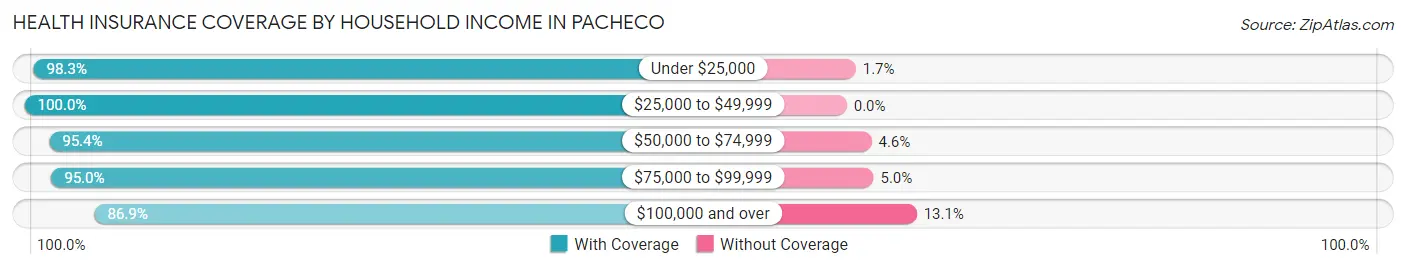
| Household Income | With Coverage | Without Coverage |
| Under $25,000 | 410 (98.3%) | 7 (1.7%) |
| $25,000 to $49,999 | 305 (100.0%) | 0 (0.0%) |
| $50,000 to $74,999 | 618 (95.4%) | 30 (4.6%) |
| $75,000 to $99,999 | 493 (95.0%) | 26 (5.0%) |
| $100,000 and over | 2,739 (86.9%) | 413 (13.1%) |
Public vs Private Health Insurance Coverage by Age in Pacheco
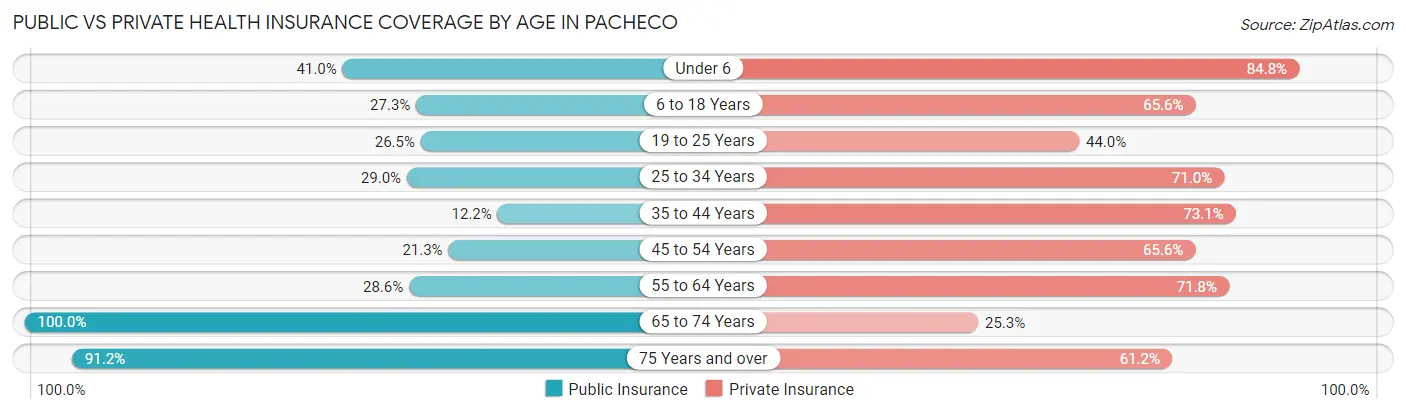
| Age Bracket | Public Insurance | Private Insurance |
| Under 6 | 100 (41.0%) | 207 (84.8%) |
| 6 to 18 Years | 162 (27.3%) | 389 (65.6%) |
| 19 to 25 Years | 113 (26.5%) | 188 (44.0%) |
| 25 to 34 Years | 158 (29.0%) | 386 (71.0%) |
| 35 to 44 Years | 101 (12.2%) | 605 (73.1%) |
| 45 to 54 Years | 189 (21.3%) | 581 (65.6%) |
| 55 to 64 Years | 177 (28.6%) | 444 (71.8%) |
| 65 to 74 Years | 514 (100.0%) | 130 (25.3%) |
| 75 Years and over | 353 (91.2%) | 237 (61.2%) |
| Total | 1,867 (37.0%) | 3,167 (62.8%) |
Disability Status by Sex by Age in Pacheco
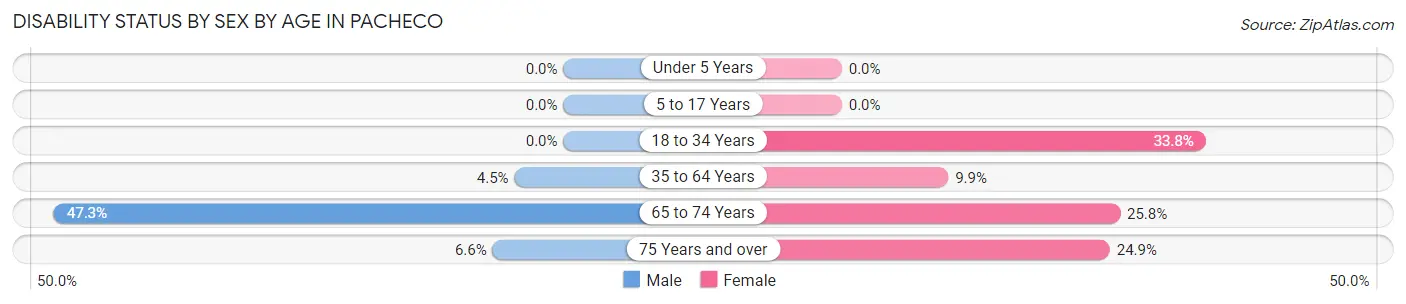
| Age Bracket | Male | Female |
| Under 5 Years | 0 (0.0%) | 0 (0.0%) |
| 5 to 17 Years | 0 (0.0%) | 0 (0.0%) |
| 18 to 34 Years | 0 (0.0%) | 182 (33.8%) |
| 35 to 64 Years | 53 (4.5%) | 115 (9.9%) |
| 65 to 74 Years | 113 (47.3%) | 71 (25.8%) |
| 75 Years and over | 13 (6.6%) | 47 (24.9%) |
Disability Class by Sex by Age in Pacheco
Disability Class: Hearing Difficulty
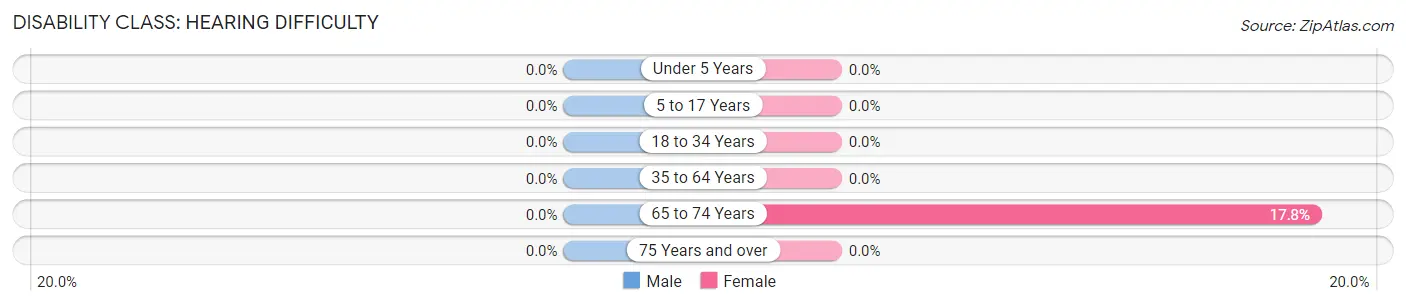
| Age Bracket | Male | Female |
| Under 5 Years | 0 (0.0%) | 0 (0.0%) |
| 5 to 17 Years | 0 (0.0%) | 0 (0.0%) |
| 18 to 34 Years | 0 (0.0%) | 0 (0.0%) |
| 35 to 64 Years | 0 (0.0%) | 0 (0.0%) |
| 65 to 74 Years | 0 (0.0%) | 49 (17.8%) |
| 75 Years and over | 0 (0.0%) | 0 (0.0%) |
Disability Class: Vision Difficulty
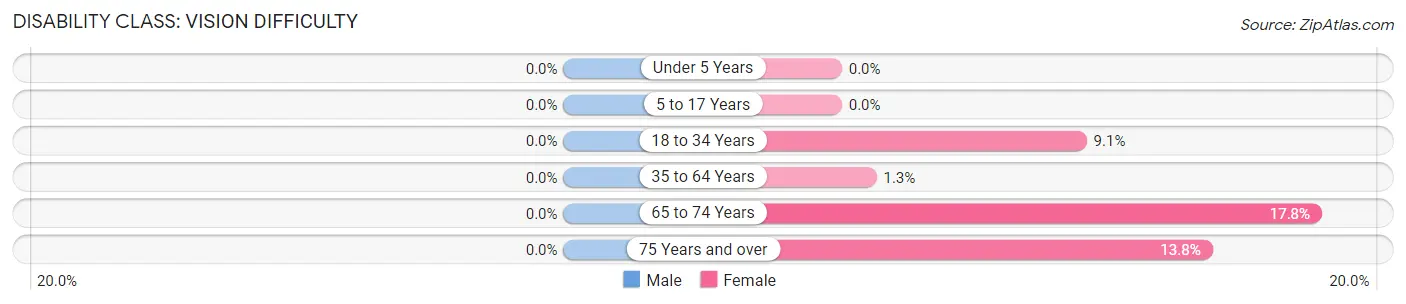
| Age Bracket | Male | Female |
| Under 5 Years | 0 (0.0%) | 0 (0.0%) |
| 5 to 17 Years | 0 (0.0%) | 0 (0.0%) |
| 18 to 34 Years | 0 (0.0%) | 49 (9.1%) |
| 35 to 64 Years | 0 (0.0%) | 15 (1.3%) |
| 65 to 74 Years | 0 (0.0%) | 49 (17.8%) |
| 75 Years and over | 0 (0.0%) | 26 (13.8%) |
Disability Class: Cognitive Difficulty
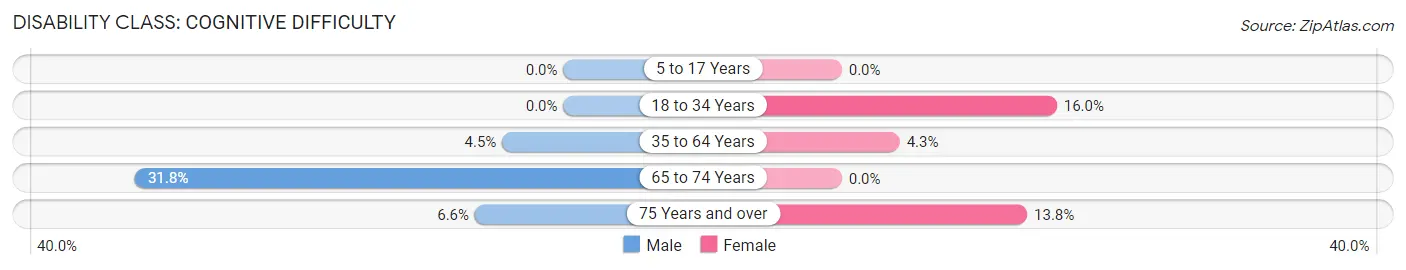
| Age Bracket | Male | Female |
| 5 to 17 Years | 0 (0.0%) | 0 (0.0%) |
| 18 to 34 Years | 0 (0.0%) | 86 (16.0%) |
| 35 to 64 Years | 53 (4.5%) | 50 (4.3%) |
| 65 to 74 Years | 76 (31.8%) | 0 (0.0%) |
| 75 Years and over | 13 (6.6%) | 26 (13.8%) |
Disability Class: Ambulatory Difficulty
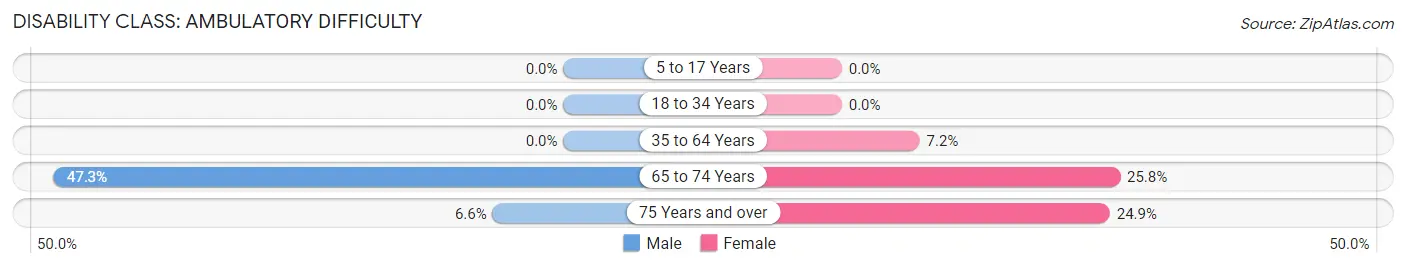
| Age Bracket | Male | Female |
| 5 to 17 Years | 0 (0.0%) | 0 (0.0%) |
| 18 to 34 Years | 0 (0.0%) | 0 (0.0%) |
| 35 to 64 Years | 0 (0.0%) | 84 (7.2%) |
| 65 to 74 Years | 113 (47.3%) | 71 (25.8%) |
| 75 Years and over | 13 (6.6%) | 47 (24.9%) |
Disability Class: Self-Care Difficulty
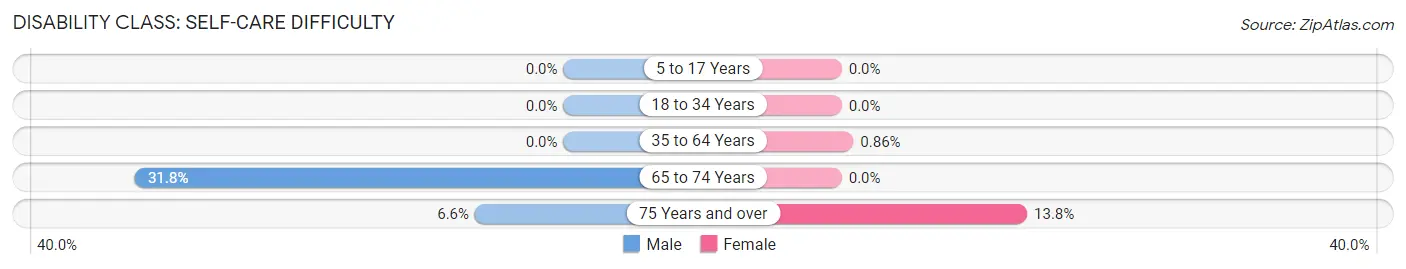
| Age Bracket | Male | Female |
| 5 to 17 Years | 0 (0.0%) | 0 (0.0%) |
| 18 to 34 Years | 0 (0.0%) | 0 (0.0%) |
| 35 to 64 Years | 0 (0.0%) | 10 (0.9%) |
| 65 to 74 Years | 76 (31.8%) | 0 (0.0%) |
| 75 Years and over | 13 (6.6%) | 26 (13.8%) |
Technology Access in Pacheco
Computing Device Access in Pacheco
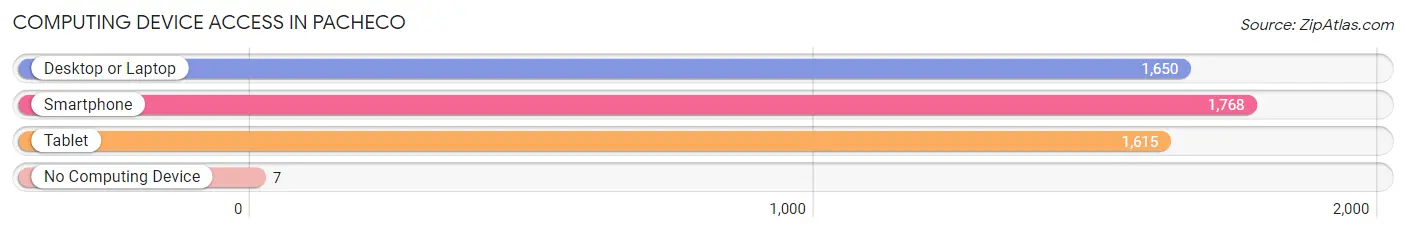
| Device Type | # Households | % Households |
| Desktop or Laptop | 1,650 | 84.6% |
| Smartphone | 1,768 | 90.7% |
| Tablet | 1,615 | 82.8% |
| No Computing Device | 7 | 0.4% |
| Total | 1,950 | 100.0% |
Internet Access in Pacheco
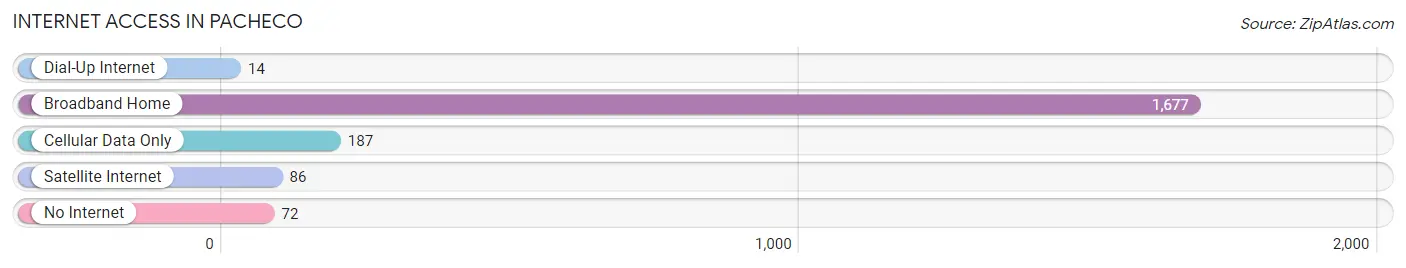
| Internet Type | # Households | % Households |
| Dial-Up Internet | 14 | 0.7% |
| Broadband Home | 1,677 | 86.0% |
| Cellular Data Only | 187 | 9.6% |
| Satellite Internet | 86 | 4.4% |
| No Internet | 72 | 3.7% |
| Total | 1,950 | 100.0% |
Pacheco Summary
Pacheco, California is a small unincorporated community located in Contra Costa County, California. It is situated in the San Francisco Bay Area, approximately 25 miles east of San Francisco. The population of Pacheco was estimated to be 4,845 in 2019.
History
Pacheco was originally inhabited by the Ohlone people, who were the first inhabitants of the San Francisco Bay Area. The Ohlone people lived in the area for thousands of years before the arrival of Europeans.
In 1772, the Spanish explorer Don Gaspar de Portolà and his expedition passed through the area. The expedition was the first European exploration of the San Francisco Bay Area.
In 1823, the Mexican government granted the land that is now Pacheco to Don Ygnacio Martinez. Martinez named the area Pacheco after his father, Don Francisco Pacheco.
In 1848, the Treaty of Guadalupe Hidalgo was signed, ending the Mexican-American War and ceding California to the United States.
In 1849 the California Gold Rush began bringing thousands of people to the area in search of gold
In 1868, the Central Pacific Railroad was completed, connecting the San Francisco Bay Area to the rest of the country.
In 1876 the town of Pacheco was officially established
In the early 1900s, Pacheco was a small farming community. The town was known for its orchards and vineyards, and the local economy was largely based on agriculture.
In the 1950s, the population of Pacheco began to grow as people moved to the area from other parts of the country.
Geography
Pacheco is located in Contra Costa County, California. It is situated in the San Francisco Bay Area, approximately 25 miles east of San Francisco.
The town is located on the eastern side of the San Francisco Bay, near the Carquinez Strait. The town is bordered by the cities of Martinez to the north, Concord to the east, and Walnut Creek to the south.
The town has a total area of 2 2 square miles all of which is land
Economy
The economy of Pacheco is largely based on agriculture. The town is known for its orchards and vineyards, and the local economy is largely based on agriculture.
The town also has a number of small businesses, including restaurants, retail stores, and auto repair shops.
Demographics
As of 2019, the population of Pacheco was estimated to be 4,845. The population is largely Hispanic, with approximately 75% of the population identifying as Hispanic or Latino.
The median household income in Pacheco is $68,857, and the median home value is $637,400. The town has a poverty rate of 8.3%.
Conclusion
Pacheco, California is a small unincorporated community located in Contra Costa County, California. It is situated in the San Francisco Bay Area, approximately 25 miles east of San Francisco. The population of Pacheco was estimated to be 4,845 in 2019. The town has a largely Hispanic population, and the local economy is largely based on agriculture. The town also has a number of small businesses, including restaurants, retail stores, and auto repair shops.
Common Questions
What is Per Capita Income in Pacheco?
Per Capita income in Pacheco is $43,539.
What is the Median Family Income in Pacheco?
Median Family Income in Pacheco is $105,064.
What is the Median Household income in Pacheco?
Median Household Income in Pacheco is $100,904.
What is Income or Wage Gap in Pacheco?
Income or Wage Gap in Pacheco is 24.8%.
Women in Pacheco earn 75.2 cents for every dollar earned by a man.
What is Inequality or Gini Index in Pacheco?
Inequality or Gini Index in Pacheco is 0.44.
What is the Total Population of Pacheco?
Total Population of Pacheco is 5,041.
What is the Total Male Population of Pacheco?
Total Male Population of Pacheco is 2,556.
What is the Total Female Population of Pacheco?
Total Female Population of Pacheco is 2,485.
What is the Ratio of Males per 100 Females in Pacheco?
There are 102.86 Males per 100 Females in Pacheco.
What is the Ratio of Females per 100 Males in Pacheco?
There are 97.22 Females per 100 Males in Pacheco.
What is the Median Population Age in Pacheco?
Median Population Age in Pacheco is 44.1 Years.
What is the Average Family Size in Pacheco
Average Family Size in Pacheco is 3.0 People.
What is the Average Household Size in Pacheco
Average Household Size in Pacheco is 2.6 People.
How Large is the Labor Force in Pacheco?
There are 2,895 People in the Labor Forcein in Pacheco.
What is the Percentage of People in the Labor Force in Pacheco?
66.4% of People are in the Labor Force in Pacheco.
What is the Unemployment Rate in Pacheco?
Unemployment Rate in Pacheco is 6.2%.