Mead Valley, CA Map & Demographics
Mead Valley Map
Mead Valley Overview
$23,700
PER CAPITA INCOME
$85,898
AVG FAMILY INCOME
$85,600
AVG HOUSEHOLD INCOME
33.6%
WAGE / INCOME GAP [ % ]
66.4¢/ $1
WAGE / INCOME GAP [ $ ]
$17,018
FAMILY INCOME DEFICIT
0.38
INEQUALITY / GINI INDEX
20,581
TOTAL POPULATION
10,274
MALE POPULATION
10,307
FEMALE POPULATION
99.68
MALES / 100 FEMALES
100.32
FEMALES / 100 MALES
32.8
MEDIAN AGE
4.7
AVG FAMILY SIZE
4.4
AVG HOUSEHOLD SIZE
9,810
LABOR FORCE [ PEOPLE ]
61.8%
PERCENT IN LABOR FORCE
6.3%
UNEMPLOYMENT RATE
Income in Mead Valley
Income Overview in Mead Valley
Per Capita Income in Mead Valley is $23,700, while median incomes of families and households are $85,898 and $85,600 respectively.
| Characteristic | Number | Measure |
| Per Capita Income | 20,581 | $23,700 |
| Median Family Income | 3,920 | $85,898 |
| Mean Family Income | 3,920 | $100,009 |
| Median Household Income | 4,580 | $85,600 |
| Mean Household Income | 4,580 | $97,248 |
| Income Deficit | 3,920 | $17,018 |
| Wage / Income Gap (%) | 20,581 | 33.60% |
| Wage / Income Gap ($) | 20,581 | 66.40¢ per $1 |
| Gini / Inequality Index | 20,581 | 0.38 |
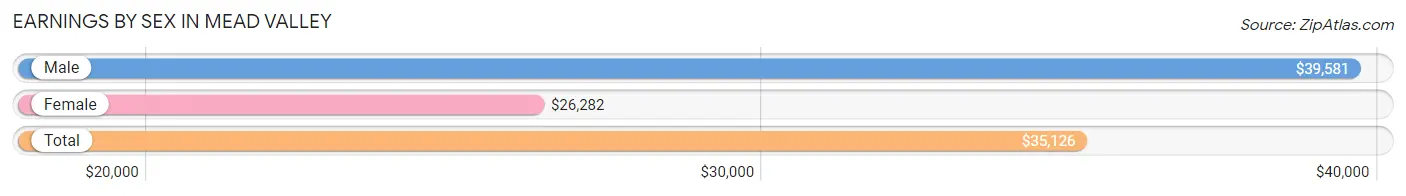
Earnings by Sex in Mead Valley
Average Earnings in Mead Valley are $35,126, $39,581 for men and $26,282 for women, a difference of 33.6%.
| Sex | Number | Average Earnings |
| Male | 5,769 (58.3%) | $39,581 |
| Female | 4,123 (41.7%) | $26,282 |
| Total | 9,892 (100.0%) | $35,126 |
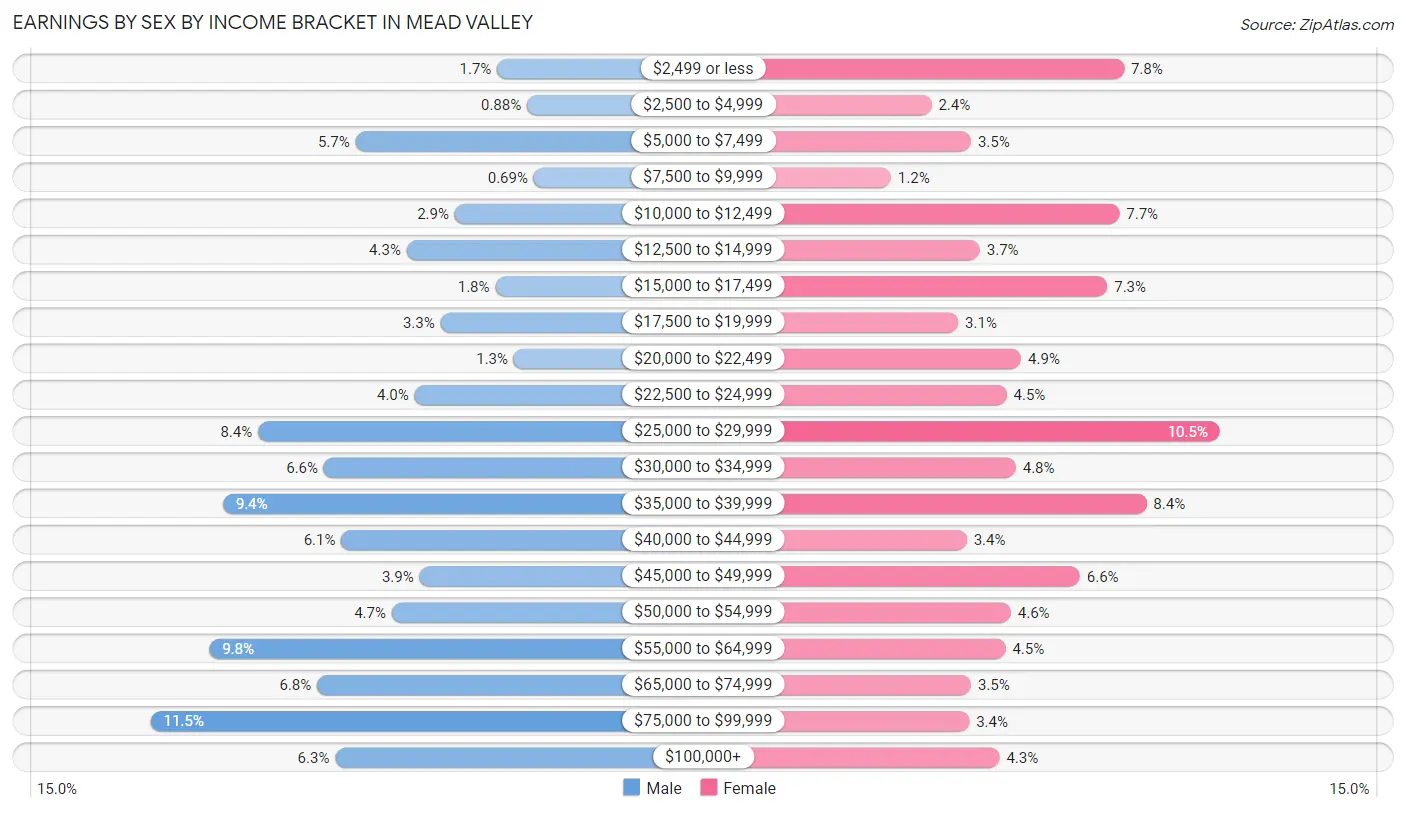
Earnings by Sex by Income Bracket in Mead Valley
The most common earnings brackets in Mead Valley are $75,000 to $99,999 for men (661 | 11.5%) and $25,000 to $29,999 for women (432 | 10.5%).
| Income | Male | Female |
| $2,499 or less | 99 (1.7%) | 321 (7.8%) |
| $2,500 to $4,999 | 51 (0.9%) | 98 (2.4%) |
| $5,000 to $7,499 | 329 (5.7%) | 144 (3.5%) |
| $7,500 to $9,999 | 40 (0.7%) | 51 (1.2%) |
| $10,000 to $12,499 | 168 (2.9%) | 316 (7.7%) |
| $12,500 to $14,999 | 246 (4.3%) | 154 (3.7%) |
| $15,000 to $17,499 | 102 (1.8%) | 302 (7.3%) |
| $17,500 to $19,999 | 191 (3.3%) | 129 (3.1%) |
| $20,000 to $22,499 | 72 (1.3%) | 202 (4.9%) |
| $22,500 to $24,999 | 233 (4.0%) | 185 (4.5%) |
| $25,000 to $29,999 | 487 (8.4%) | 432 (10.5%) |
| $30,000 to $34,999 | 380 (6.6%) | 196 (4.8%) |
| $35,000 to $39,999 | 544 (9.4%) | 347 (8.4%) |
| $40,000 to $44,999 | 352 (6.1%) | 139 (3.4%) |
| $45,000 to $49,999 | 225 (3.9%) | 270 (6.6%) |
| $50,000 to $54,999 | 270 (4.7%) | 190 (4.6%) |
| $55,000 to $64,999 | 566 (9.8%) | 184 (4.5%) |
| $65,000 to $74,999 | 391 (6.8%) | 144 (3.5%) |
| $75,000 to $99,999 | 661 (11.5%) | 142 (3.4%) |
| $100,000+ | 362 (6.3%) | 177 (4.3%) |
| Total | 5,769 (100.0%) | 4,123 (100.0%) |
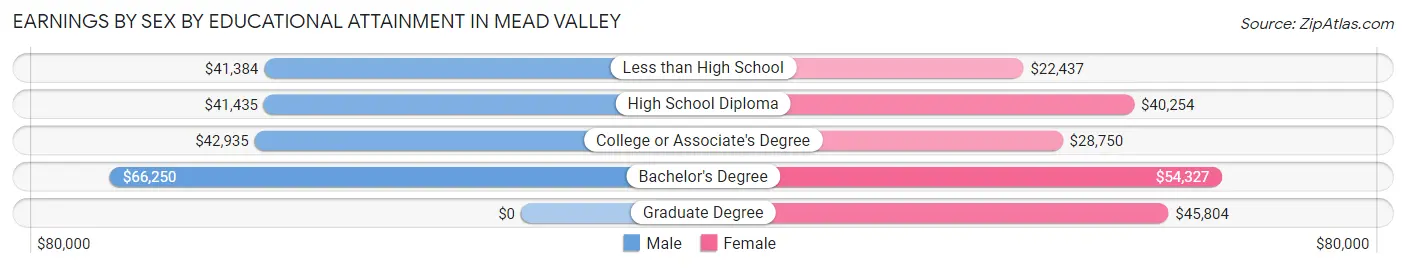
Earnings by Sex by Educational Attainment in Mead Valley
Average earnings in Mead Valley are $45,143 for men and $35,310 for women, a difference of 21.8%. Men with an educational attainment of bachelor's degree enjoy the highest average annual earnings of $66,250, while those with less than high school education earn the least with $41,384. Women with an educational attainment of bachelor's degree earn the most with the average annual earnings of $54,327, while those with less than high school education have the smallest earnings of $22,437.
| Educational Attainment | Male Income | Female Income |
| Less than High School | $41,384 | $22,437 |
| High School Diploma | $41,435 | $40,254 |
| College or Associate's Degree | $42,935 | $28,750 |
| Bachelor's Degree | $66,250 | $54,327 |
| Graduate Degree | - | - |
| Total | $45,143 | $35,310 |
Family Income in Mead Valley
Family Income Brackets in Mead Valley
According to the Mead Valley family income data, there are 851 families falling into the $75,000 to $99,999 income range, which is the most common income bracket and makes up 21.7% of all families. Conversely, the $10,000 to $14,999 income bracket is the least frequent group with only 74 families (1.9%) belonging to this category.
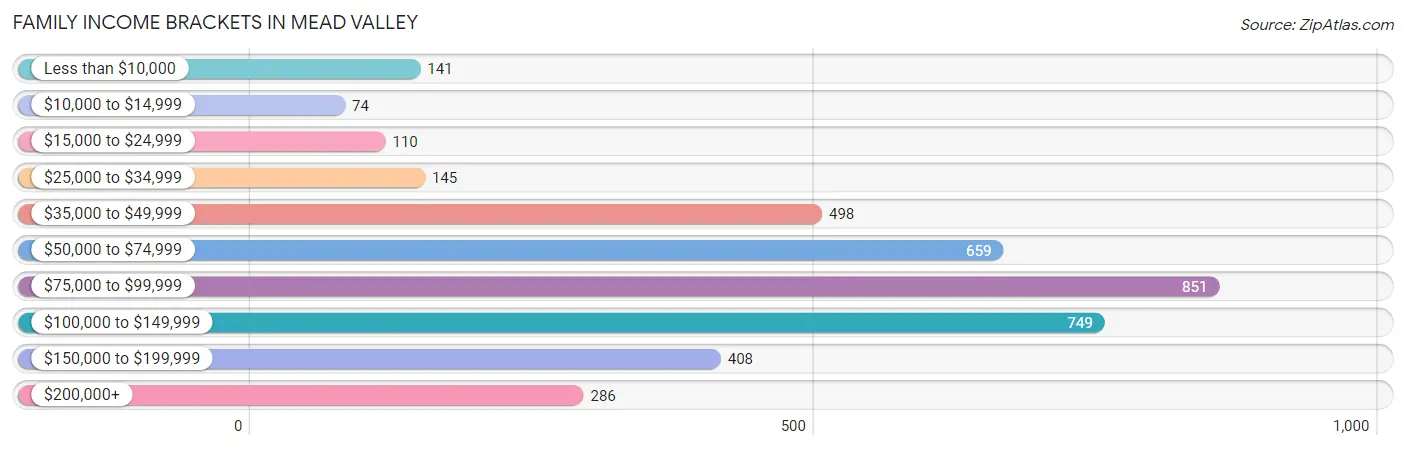
| Income Bracket | # Families | % Families |
| Less than $10,000 | 141 | 3.6% |
| $10,000 to $14,999 | 74 | 1.9% |
| $15,000 to $24,999 | 110 | 2.8% |
| $25,000 to $34,999 | 145 | 3.7% |
| $35,000 to $49,999 | 498 | 12.7% |
| $50,000 to $74,999 | 659 | 16.8% |
| $75,000 to $99,999 | 851 | 21.7% |
| $100,000 to $149,999 | 749 | 19.1% |
| $150,000 to $199,999 | 408 | 10.4% |
| $200,000+ | 286 | 7.3% |
Family Income by Famaliy Size in Mead Valley
4-person families (782 | 20.0%) account for the highest median family income in Mead Valley with $95,074 per family, while 2-person families (702 | 17.9%) have the highest median income of $27,486 per family member.
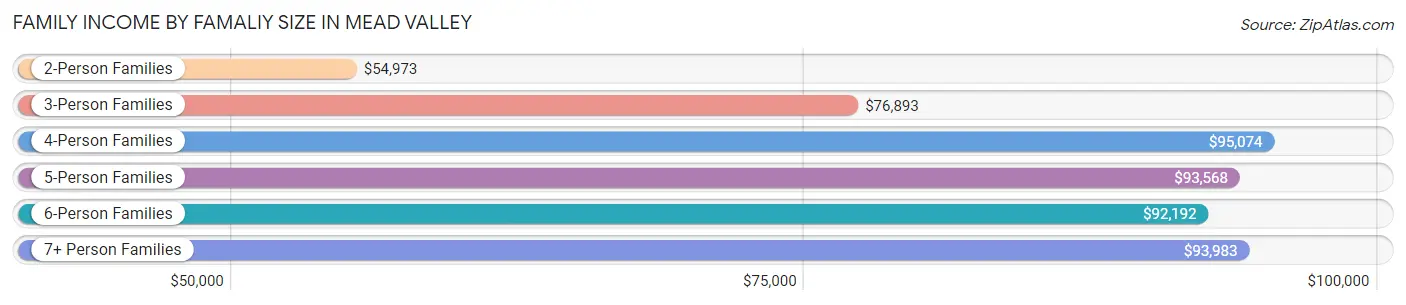
| Income Bracket | # Families | Median Income |
| 2-Person Families | 702 (17.9%) | $54,973 |
| 3-Person Families | 783 (20.0%) | $76,893 |
| 4-Person Families | 782 (20.0%) | $95,074 |
| 5-Person Families | 799 (20.4%) | $93,568 |
| 6-Person Families | 399 (10.2%) | $92,192 |
| 7+ Person Families | 455 (11.6%) | $93,983 |
| Total | 3,920 (100.0%) | $85,898 |
Family Income by Number of Earners in Mead Valley
The median family income in Mead Valley is $85,898, with families comprising 3+ earners (1,056) having the highest median family income of $133,750, while families with no earners (380) have the lowest median family income of $41,806, accounting for 26.9% and 9.7% of families, respectively.
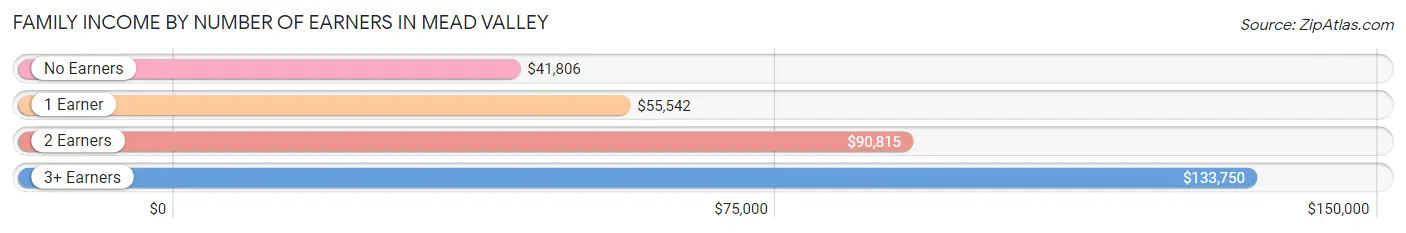
| Number of Earners | # Families | Median Income |
| No Earners | 380 (9.7%) | $41,806 |
| 1 Earner | 1,093 (27.9%) | $55,542 |
| 2 Earners | 1,391 (35.5%) | $90,815 |
| 3+ Earners | 1,056 (26.9%) | $133,750 |
| Total | 3,920 (100.0%) | $85,898 |
Household Income in Mead Valley
Household Income Brackets in Mead Valley
With 989 households falling in the category, the $100,000 to $149,999 income range is the most frequent in Mead Valley, accounting for 21.6% of all households. In contrast, only 124 households (2.7%) fall into the $10,000 to $14,999 income bracket, making it the least populous group.
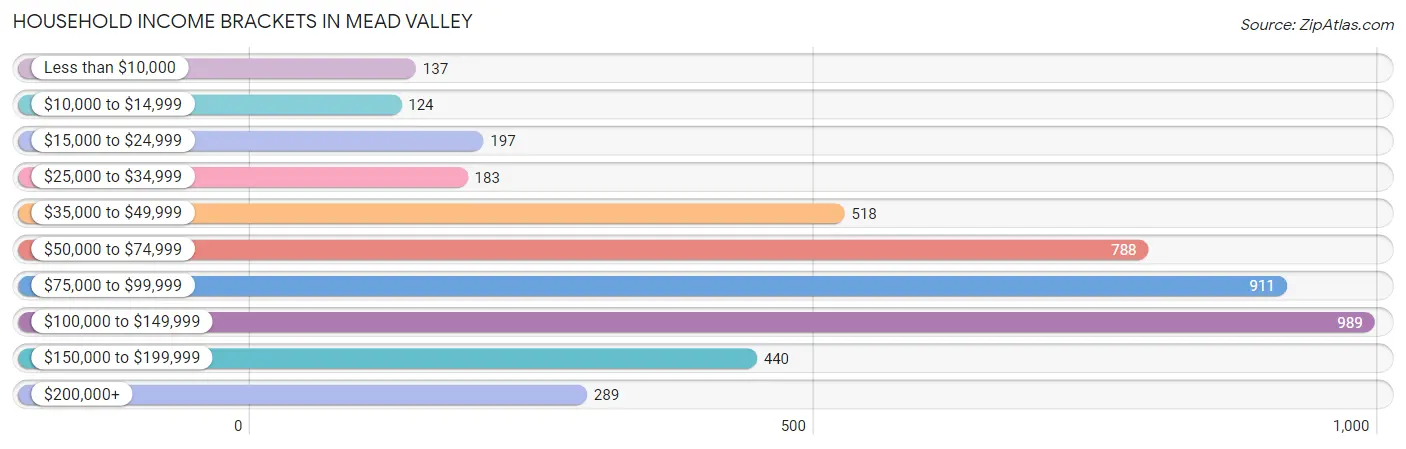
| Income Bracket | # Households | % Households |
| Less than $10,000 | 137 | 3.0% |
| $10,000 to $14,999 | 124 | 2.7% |
| $15,000 to $24,999 | 197 | 4.3% |
| $25,000 to $34,999 | 183 | 4.0% |
| $35,000 to $49,999 | 518 | 11.3% |
| $50,000 to $74,999 | 788 | 17.2% |
| $75,000 to $99,999 | 911 | 19.9% |
| $100,000 to $149,999 | 989 | 21.6% |
| $150,000 to $199,999 | 440 | 9.6% |
| $200,000+ | 289 | 6.3% |
Household Income by Householder Age in Mead Valley
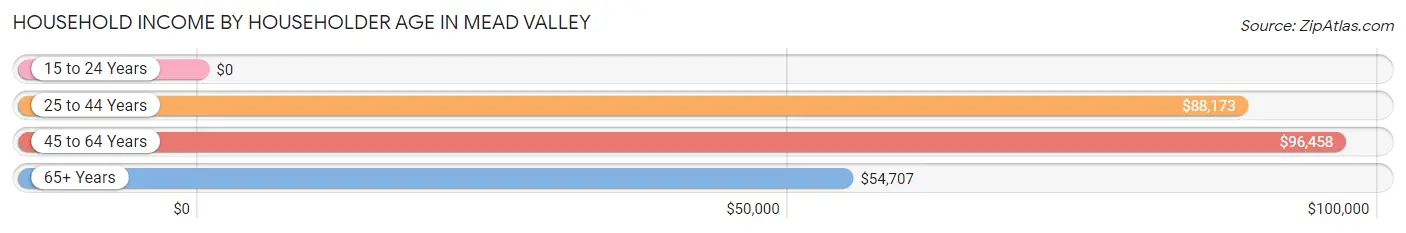
The median household income in Mead Valley is $85,600, with the highest median household income of $96,458 found in the 45 to 64 years age bracket for the primary householder. A total of 2,219 households (48.4%) fall into this category. Meanwhile, the 15 to 24 years age bracket for the primary householder has the lowest median household income of $0, with 256 households (5.6%) in this group.
| Income Bracket | # Households | Median Income |
| 15 to 24 Years | 256 (5.6%) | $0 |
| 25 to 44 Years | 1,379 (30.1%) | $88,173 |
| 45 to 64 Years | 2,219 (48.4%) | $96,458 |
| 65+ Years | 726 (15.9%) | $54,707 |
| Total | 4,580 (100.0%) | $85,600 |
Poverty in Mead Valley
Income Below Poverty by Sex and Age in Mead Valley
With 12.2% poverty level for males and 13.7% for females among the residents of Mead Valley, 15 year old males and 6 to 11 year old females are the most vulnerable to poverty, with 40 males (71.4%) and 277 females (29.0%) in their respective age groups living below the poverty level.
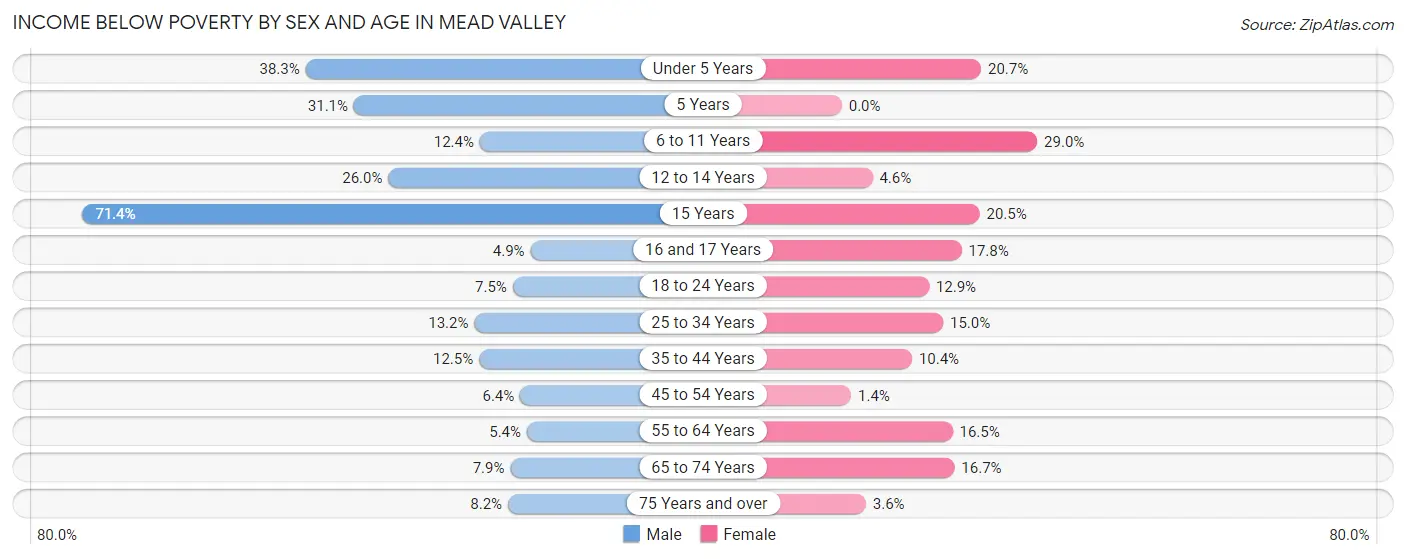
| Age Bracket | Male | Female |
| Under 5 Years | 214 (38.3%) | 128 (20.7%) |
| 5 Years | 28 (31.1%) | 0 (0.0%) |
| 6 to 11 Years | 90 (12.4%) | 277 (29.0%) |
| 12 to 14 Years | 156 (26.0%) | 17 (4.5%) |
| 15 Years | 40 (71.4%) | 53 (20.5%) |
| 16 and 17 Years | 17 (4.9%) | 48 (17.8%) |
| 18 to 24 Years | 95 (7.5%) | 186 (12.9%) |
| 25 to 34 Years | 184 (13.2%) | 218 (15.0%) |
| 35 to 44 Years | 161 (12.5%) | 138 (10.4%) |
| 45 to 54 Years | 103 (6.4%) | 17 (1.4%) |
| 55 to 64 Years | 68 (5.4%) | 179 (16.5%) |
| 65 to 74 Years | 43 (7.9%) | 99 (16.7%) |
| 75 Years and over | 32 (8.2%) | 14 (3.6%) |
| Total | 1,231 (12.2%) | 1,374 (13.7%) |
Income Above Poverty by Sex and Age in Mead Valley
According to the poverty statistics in Mead Valley, males aged 16 and 17 years and females aged 5 years are the age groups that are most secure financially, with 95.1% of males and 100.0% of females in these age groups living above the poverty line.
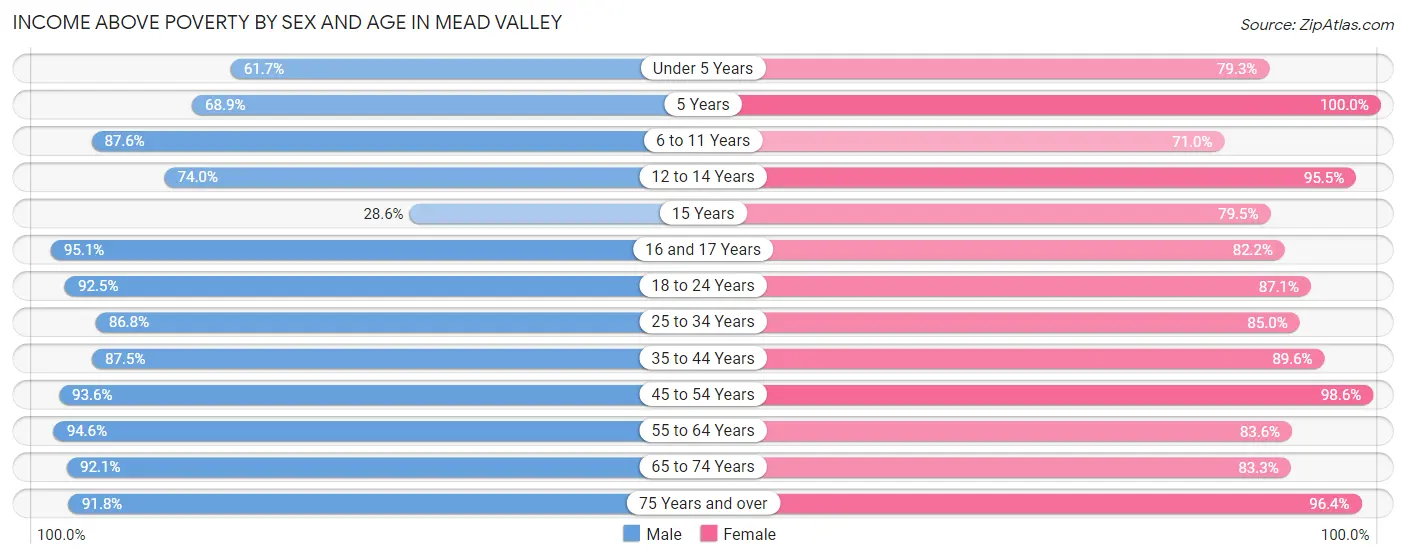
| Age Bracket | Male | Female |
| Under 5 Years | 345 (61.7%) | 491 (79.3%) |
| 5 Years | 62 (68.9%) | 76 (100.0%) |
| 6 to 11 Years | 635 (87.6%) | 678 (71.0%) |
| 12 to 14 Years | 444 (74.0%) | 357 (95.5%) |
| 15 Years | 16 (28.6%) | 206 (79.5%) |
| 16 and 17 Years | 331 (95.1%) | 222 (82.2%) |
| 18 to 24 Years | 1,168 (92.5%) | 1,251 (87.1%) |
| 25 to 34 Years | 1,208 (86.8%) | 1,232 (85.0%) |
| 35 to 44 Years | 1,125 (87.5%) | 1,187 (89.6%) |
| 45 to 54 Years | 1,502 (93.6%) | 1,215 (98.6%) |
| 55 to 64 Years | 1,186 (94.6%) | 909 (83.6%) |
| 65 to 74 Years | 503 (92.1%) | 493 (83.3%) |
| 75 Years and over | 357 (91.8%) | 378 (96.4%) |
| Total | 8,882 (87.8%) | 8,695 (86.4%) |
Income Below Poverty Among Married-Couple Families in Mead Valley
The poverty statistics for married-couple families in Mead Valley show that 4.6% or 139 of the total 3,020 families live below the poverty line. Families with 5 or more children have the highest poverty rate of 100.0%, comprising of 9 families. On the other hand, families with no children have the lowest poverty rate of 0.9%, which includes 11 families.
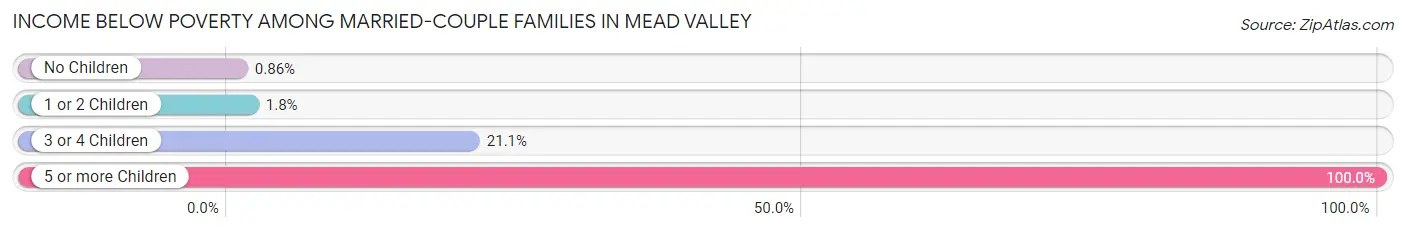
| Children | Above Poverty | Below Poverty |
| No Children | 1,275 (99.1%) | 11 (0.9%) |
| 1 or 2 Children | 1,246 (98.2%) | 23 (1.8%) |
| 3 or 4 Children | 360 (78.9%) | 96 (21.0%) |
| 5 or more Children | 0 (0.0%) | 9 (100.0%) |
| Total | 2,881 (95.4%) | 139 (4.6%) |
Income Below Poverty Among Single-Parent Households in Mead Valley
According to the poverty data in Mead Valley, 34.4% or 130 single-father households and 19.5% or 102 single-mother households are living below the poverty line. Among single-father households, those with 3 or 4 children have the highest poverty rate, with 66 households (100.0%) experiencing poverty. Likewise, among single-mother households, those with 1 or 2 children have the highest poverty rate, with 76 households (34.9%) falling below the poverty line.
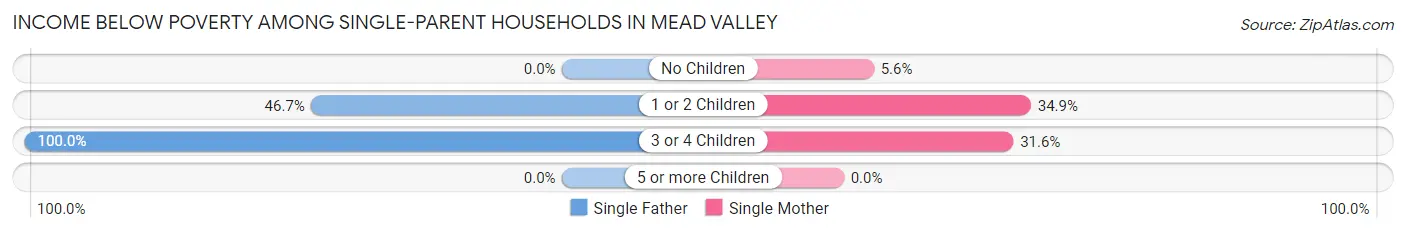
| Children | Single Father | Single Mother |
| No Children | 0 (0.0%) | 14 (5.6%) |
| 1 or 2 Children | 64 (46.7%) | 76 (34.9%) |
| 3 or 4 Children | 66 (100.0%) | 12 (31.6%) |
| 5 or more Children | 0 (0.0%) | 0 (0.0%) |
| Total | 130 (34.4%) | 102 (19.5%) |
Income Below Poverty Among Married-Couple vs Single-Parent Households in Mead Valley
The poverty data for Mead Valley shows that 139 of the married-couple family households (4.6%) and 232 of the single-parent households (25.8%) are living below the poverty level. Within the married-couple family households, those with 5 or more children have the highest poverty rate, with 9 households (100.0%) falling below the poverty line. Among the single-parent households, those with 3 or 4 children have the highest poverty rate, with 78 household (75.0%) living below poverty.
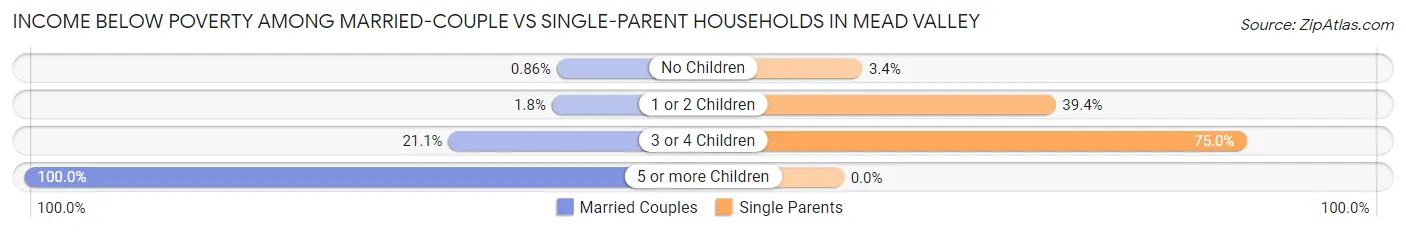
| Children | Married-Couple Families | Single-Parent Households |
| No Children | 11 (0.9%) | 14 (3.4%) |
| 1 or 2 Children | 23 (1.8%) | 140 (39.4%) |
| 3 or 4 Children | 96 (21.0%) | 78 (75.0%) |
| 5 or more Children | 9 (100.0%) | 0 (0.0%) |
| Total | 139 (4.6%) | 232 (25.8%) |
Race in Mead Valley
The most populous races in Mead Valley are Hispanic or Latino (17,229 | 83.7%), Some other Race (12,968 | 63.0%), and White / Caucasian (4,261 | 20.7%).
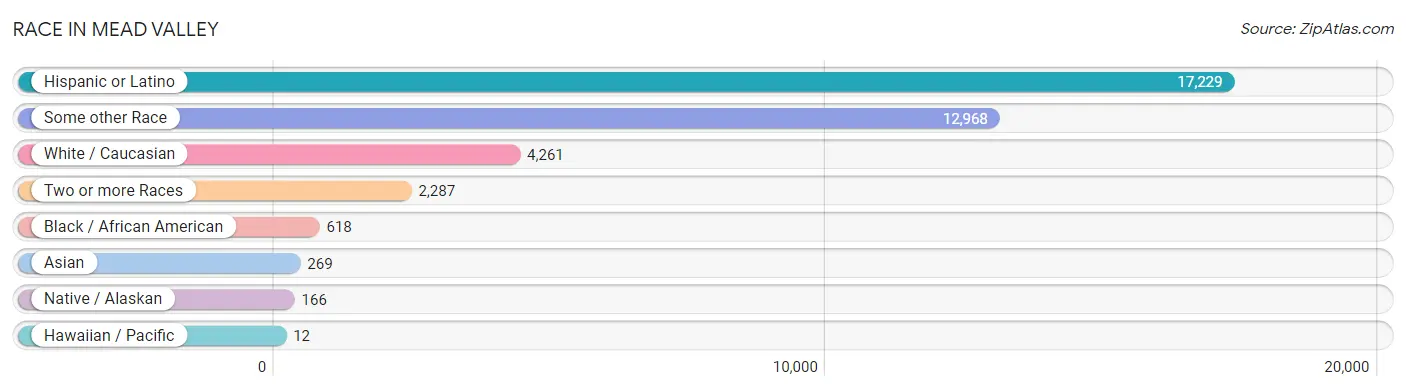
| Race | # Population | % Population |
| Asian | 269 | 1.3% |
| Black / African American | 618 | 3.0% |
| Hawaiian / Pacific | 12 | 0.1% |
| Hispanic or Latino | 17,229 | 83.7% |
| Native / Alaskan | 166 | 0.8% |
| White / Caucasian | 4,261 | 20.7% |
| Two or more Races | 2,287 | 11.1% |
| Some other Race | 12,968 | 63.0% |
| Total | 20,581 | 100.0% |
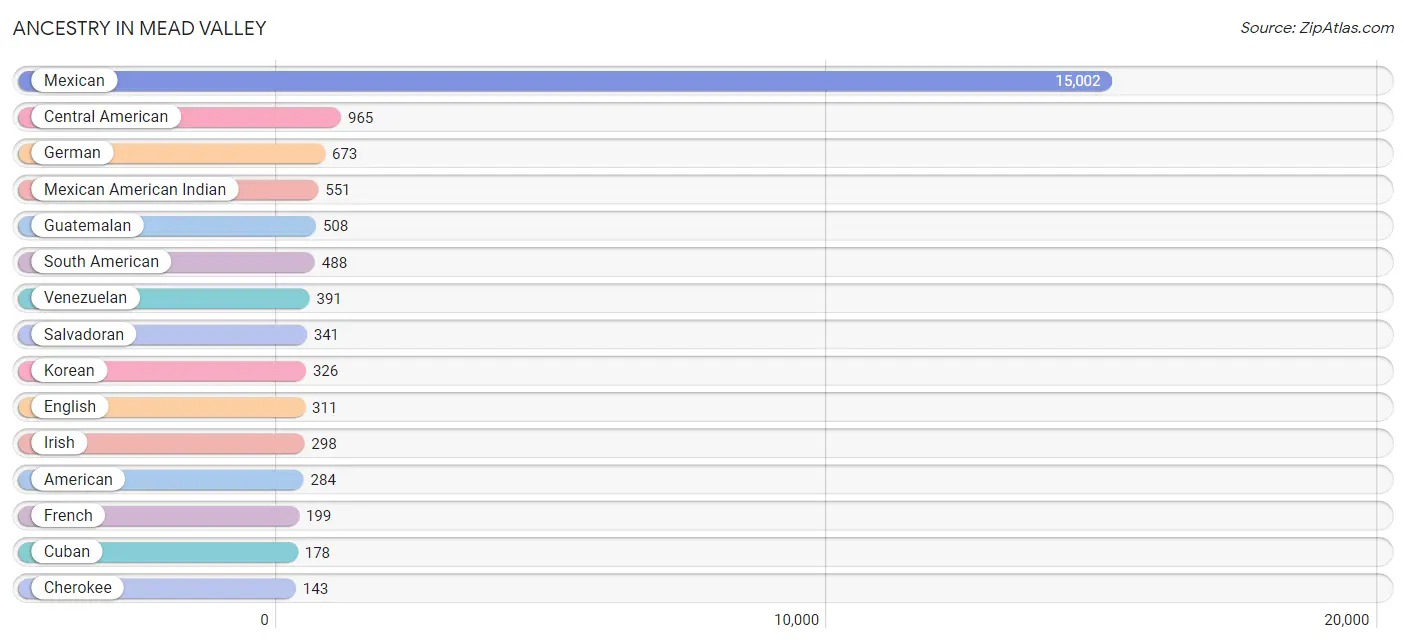
Ancestry in Mead Valley
The most populous ancestries reported in Mead Valley are Mexican (15,002 | 72.9%), Central American (965 | 4.7%), German (673 | 3.3%), Mexican American Indian (551 | 2.7%), and Guatemalan (508 | 2.5%), together accounting for 86.0% of all Mead Valley residents.
| Ancestry | # Population | % Population |
| American | 284 | 1.4% |
| Argentinean | 18 | 0.1% |
| Austrian | 7 | 0.0% |
| British | 20 | 0.1% |
| Central American | 965 | 4.7% |
| Cherokee | 143 | 0.7% |
| Colombian | 39 | 0.2% |
| Cuban | 178 | 0.9% |
| Dominican | 25 | 0.1% |
| Dutch | 46 | 0.2% |
| Eastern European | 81 | 0.4% |
| English | 311 | 1.5% |
| European | 141 | 0.7% |
| French | 199 | 1.0% |
| French Canadian | 16 | 0.1% |
| German | 673 | 3.3% |
| Guatemalan | 508 | 2.5% |
| Honduran | 115 | 0.6% |
| Indian (Asian) | 7 | 0.0% |
| Irish | 298 | 1.5% |
| Iroquois | 57 | 0.3% |
| Italian | 68 | 0.3% |
| Japanese | 13 | 0.1% |
| Korean | 326 | 1.6% |
| Malaysian | 13 | 0.1% |
| Maltese | 29 | 0.1% |
| Mexican | 15,002 | 72.9% |
| Mexican American Indian | 551 | 2.7% |
| Nicaraguan | 1 | 0.0% |
| Norwegian | 15 | 0.1% |
| Peruvian | 40 | 0.2% |
| Polish | 36 | 0.2% |
| Portuguese | 7 | 0.0% |
| Puerto Rican | 35 | 0.2% |
| Romanian | 38 | 0.2% |
| Russian | 19 | 0.1% |
| Salvadoran | 341 | 1.7% |
| Samoan | 25 | 0.1% |
| Scottish | 18 | 0.1% |
| Sioux | 17 | 0.1% |
| South American | 488 | 2.4% |
| Spaniard | 32 | 0.2% |
| Spanish | 15 | 0.1% |
| Thai | 12 | 0.1% |
| Venezuelan | 391 | 1.9% | View All 45 Rows |
Immigrants in Mead Valley
The most numerous immigrant groups reported in Mead Valley came from Latin America (7,865 | 38.2%), Central America (7,635 | 37.1%), Mexico (7,043 | 34.2%), Guatemala (265 | 1.3%), and Asia (212 | 1.0%), together accounting for 111.8% of all Mead Valley residents.
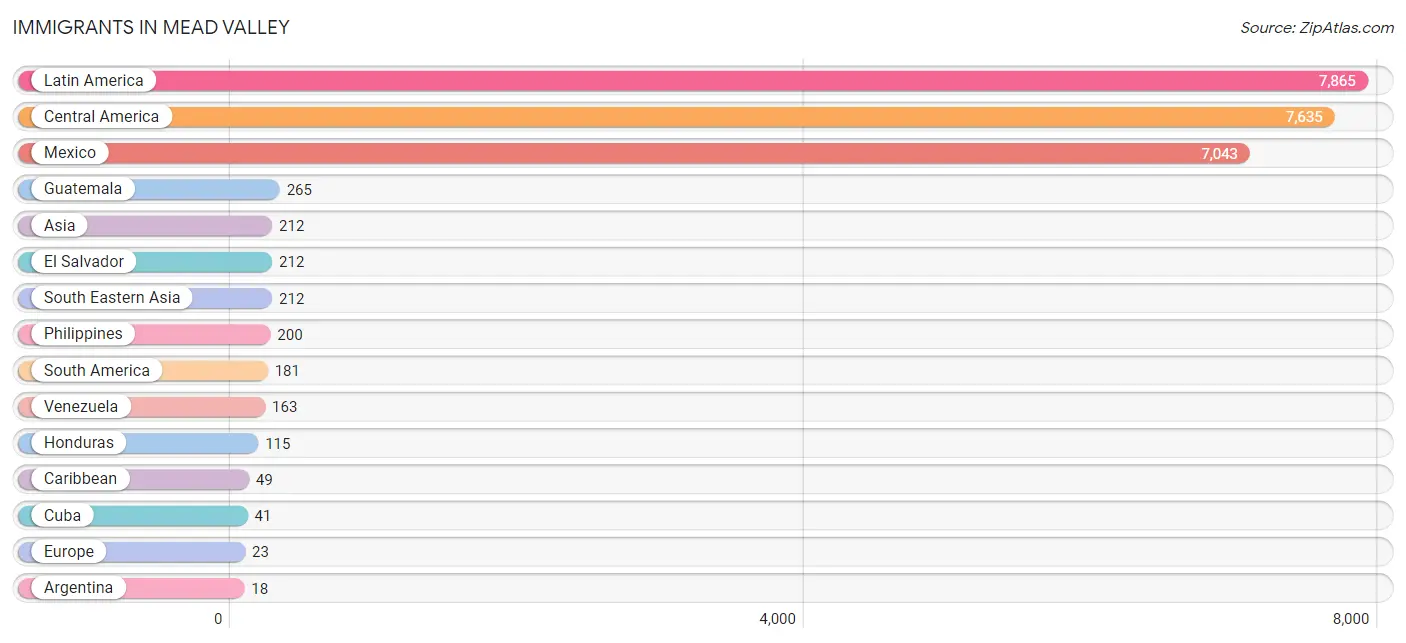
| Immigration Origin | # Population | % Population |
| Argentina | 18 | 0.1% |
| Asia | 212 | 1.0% |
| Canada | 16 | 0.1% |
| Caribbean | 49 | 0.2% |
| Central America | 7,635 | 37.1% |
| Cuba | 41 | 0.2% |
| Dominican Republic | 8 | 0.0% |
| El Salvador | 212 | 1.0% |
| England | 13 | 0.1% |
| Europe | 23 | 0.1% |
| Guatemala | 265 | 1.3% |
| Honduras | 115 | 0.6% |
| Italy | 5 | 0.0% |
| Latin America | 7,865 | 38.2% |
| Mexico | 7,043 | 34.2% |
| Netherlands | 5 | 0.0% |
| Northern Europe | 13 | 0.1% |
| Philippines | 200 | 1.0% |
| South America | 181 | 0.9% |
| South Eastern Asia | 212 | 1.0% |
| Southern Europe | 5 | 0.0% |
| Venezuela | 163 | 0.8% |
| Vietnam | 12 | 0.1% |
| Western Europe | 5 | 0.0% | View All 24 Rows |
Sex and Age in Mead Valley
Sex and Age in Mead Valley
The most populous age groups in Mead Valley are 45 to 49 Years (1,055 | 10.3%) for men and 20 to 24 Years (1,091 | 10.6%) for women.
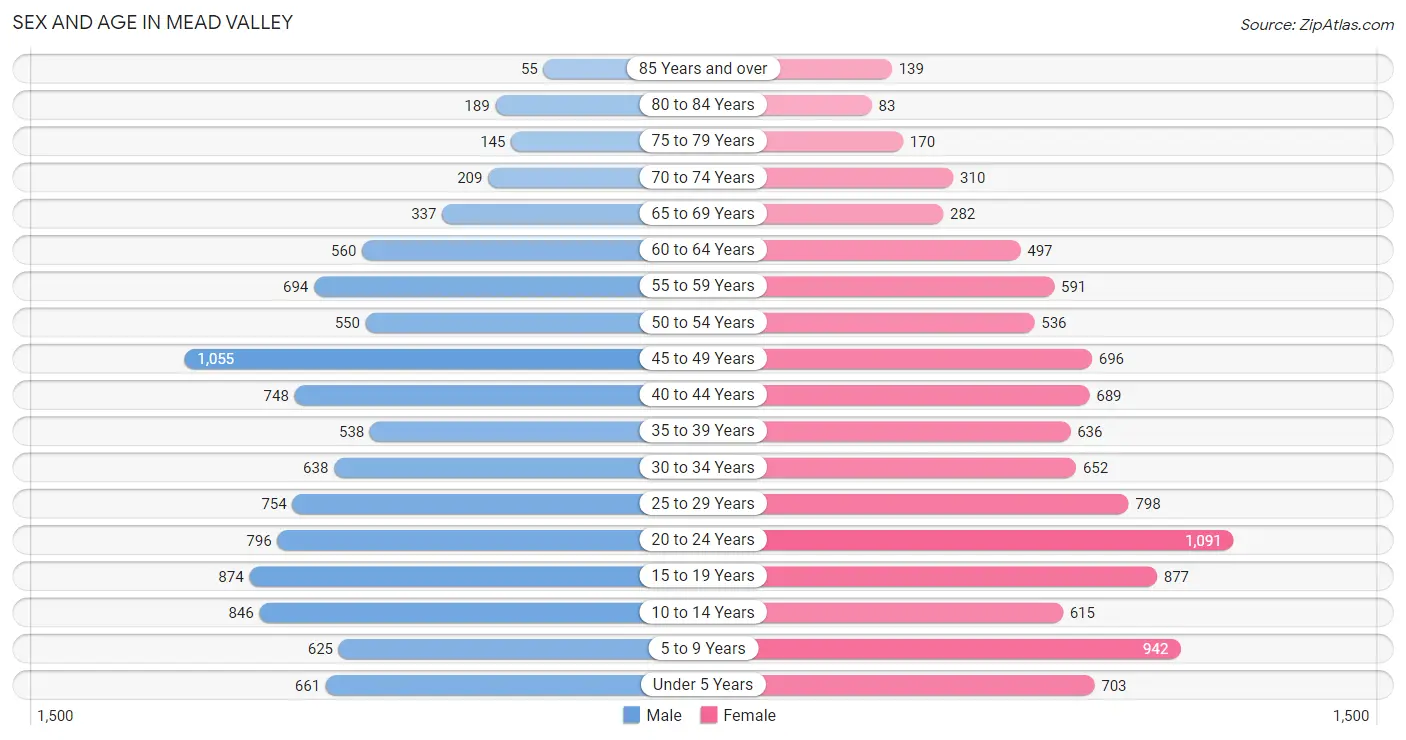
| Age Bracket | Male | Female |
| Under 5 Years | 661 (6.4%) | 703 (6.8%) |
| 5 to 9 Years | 625 (6.1%) | 942 (9.1%) |
| 10 to 14 Years | 846 (8.2%) | 615 (6.0%) |
| 15 to 19 Years | 874 (8.5%) | 877 (8.5%) |
| 20 to 24 Years | 796 (7.7%) | 1,091 (10.6%) |
| 25 to 29 Years | 754 (7.3%) | 798 (7.7%) |
| 30 to 34 Years | 638 (6.2%) | 652 (6.3%) |
| 35 to 39 Years | 538 (5.2%) | 636 (6.2%) |
| 40 to 44 Years | 748 (7.3%) | 689 (6.7%) |
| 45 to 49 Years | 1,055 (10.3%) | 696 (6.8%) |
| 50 to 54 Years | 550 (5.3%) | 536 (5.2%) |
| 55 to 59 Years | 694 (6.8%) | 591 (5.7%) |
| 60 to 64 Years | 560 (5.4%) | 497 (4.8%) |
| 65 to 69 Years | 337 (3.3%) | 282 (2.7%) |
| 70 to 74 Years | 209 (2.0%) | 310 (3.0%) |
| 75 to 79 Years | 145 (1.4%) | 170 (1.7%) |
| 80 to 84 Years | 189 (1.8%) | 83 (0.8%) |
| 85 Years and over | 55 (0.5%) | 139 (1.3%) |
| Total | 10,274 (100.0%) | 10,307 (100.0%) |
Families and Households in Mead Valley
Median Family Size in Mead Valley
The median family size in Mead Valley is 4.67 persons per family, with single male/father families (378 | 9.6%) accounting for the largest median family size of 4.99 persons per family. On the other hand, single female/mother families (522 | 13.3%) represent the smallest median family size with 4.40 persons per family.
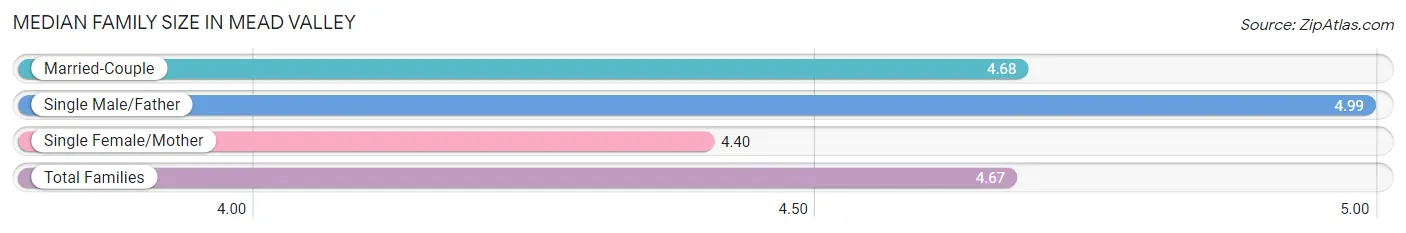
| Family Type | # Families | Family Size |
| Married-Couple | 3,020 (77.0%) | 4.68 |
| Single Male/Father | 378 (9.6%) | 4.99 |
| Single Female/Mother | 522 (13.3%) | 4.40 |
| Total Families | 3,920 (100.0%) | 4.67 |
Median Household Size in Mead Valley
The median household size in Mead Valley is 4.43 persons per household, with single male/father households (378 | 8.3%) accounting for the largest median household size of 5.49 persons per household. non-family households (660 | 14.4%) represent the smallest median household size with 1.97 persons per household.
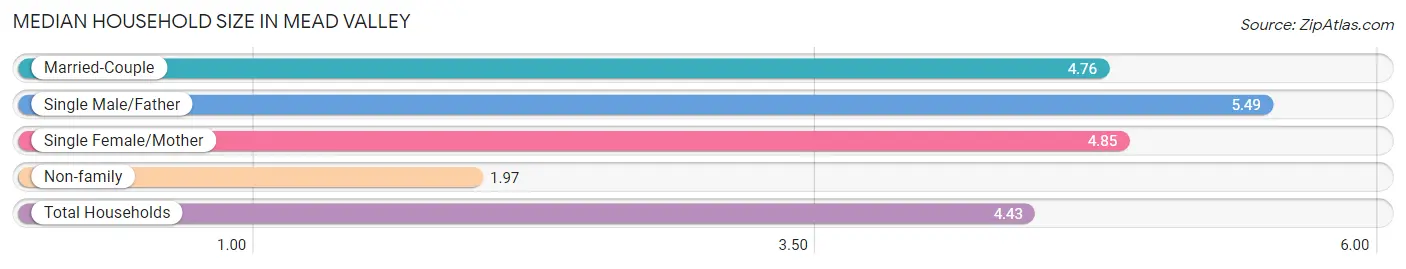
| Household Type | # Households | Household Size |
| Married-Couple | 3,020 (65.9%) | 4.76 |
| Single Male/Father | 378 (8.3%) | 5.49 |
| Single Female/Mother | 522 (11.4%) | 4.85 |
| Non-family | 660 (14.4%) | 1.97 |
| Total Households | 4,580 (100.0%) | 4.43 |
Household Size by Marriage Status in Mead Valley
Out of a total of 4,580 households in Mead Valley, 3,920 (85.6%) are family households, while 660 (14.4%) are nonfamily households. The most numerous type of family households are 5-person households, comprising 830, and the most common type of nonfamily households are 1-person households, comprising 464.
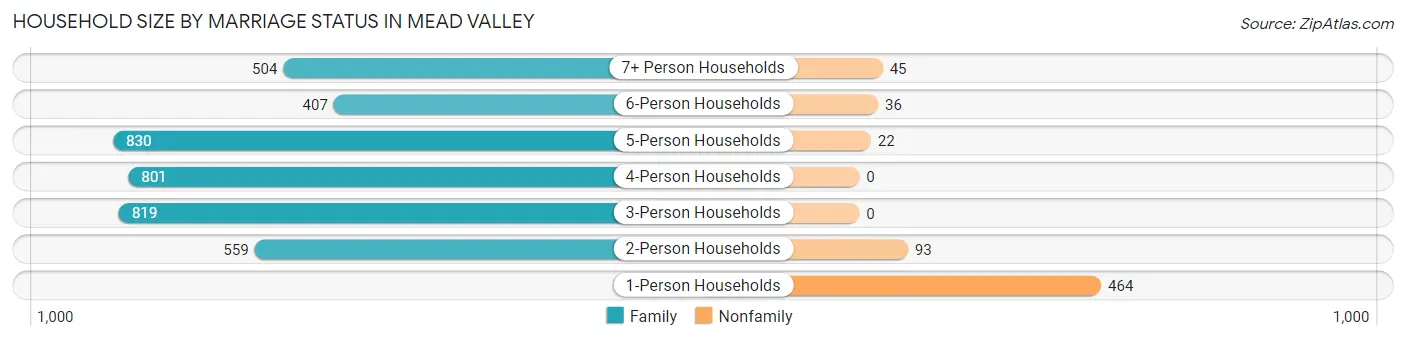
| Household Size | Family Households | Nonfamily Households |
| 1-Person Households | - | 464 (10.1%) |
| 2-Person Households | 559 (12.2%) | 93 (2.0%) |
| 3-Person Households | 819 (17.9%) | 0 (0.0%) |
| 4-Person Households | 801 (17.5%) | 0 (0.0%) |
| 5-Person Households | 830 (18.1%) | 22 (0.5%) |
| 6-Person Households | 407 (8.9%) | 36 (0.8%) |
| 7+ Person Households | 504 (11.0%) | 45 (1.0%) |
| Total | 3,920 (85.6%) | 660 (14.4%) |
Female Fertility in Mead Valley
Fertility by Age in Mead Valley
Average fertility rate in Mead Valley is 105.0 births per 1,000 women. Women in the age bracket of 20 to 34 years have the highest fertility rate with 182.0 births per 1,000 women. Women in the age bracket of 20 to 34 years acount for 78.3% of all women with births.
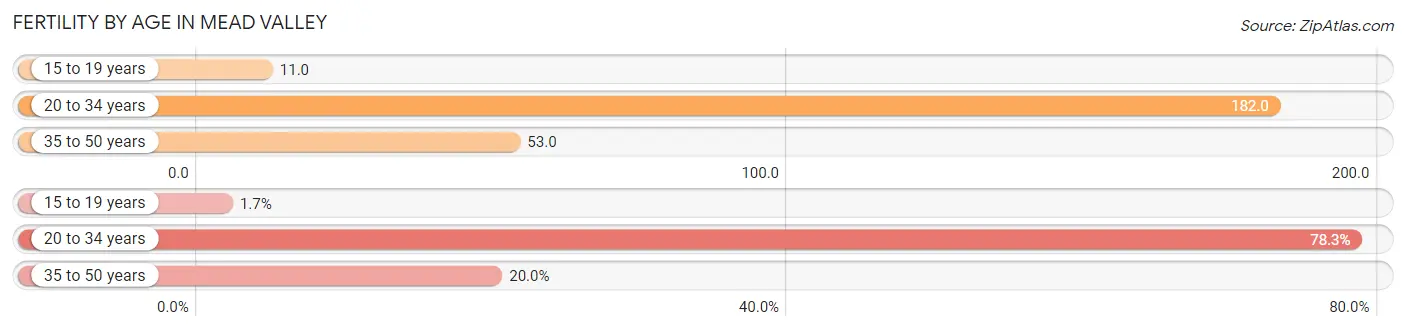
| Age Bracket | Women with Births | Births / 1,000 Women |
| 15 to 19 years | 10 (1.7%) | 11.0 |
| 20 to 34 years | 463 (78.3%) | 182.0 |
| 35 to 50 years | 118 (20.0%) | 53.0 |
| Total | 591 (100.0%) | 105.0 |
Fertility by Age by Marriage Status in Mead Valley
43.1% of women with births (591) in Mead Valley are married. The highest percentage of unmarried women with births falls into 20 to 34 years age bracket with 72.6% of them unmarried at the time of birth, while the lowest percentage of unmarried women with births belong to 15 to 19 years age bracket with 0.0% of them unmarried.
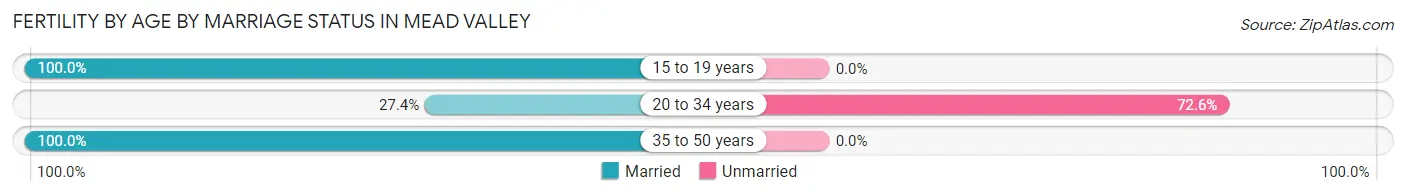
| Age Bracket | Married | Unmarried |
| 15 to 19 years | 10 (100.0%) | 0 (0.0%) |
| 20 to 34 years | 127 (27.4%) | 336 (72.6%) |
| 35 to 50 years | 118 (100.0%) | 0 (0.0%) |
| Total | 255 (43.1%) | 336 (56.9%) |
Fertility by Education in Mead Valley
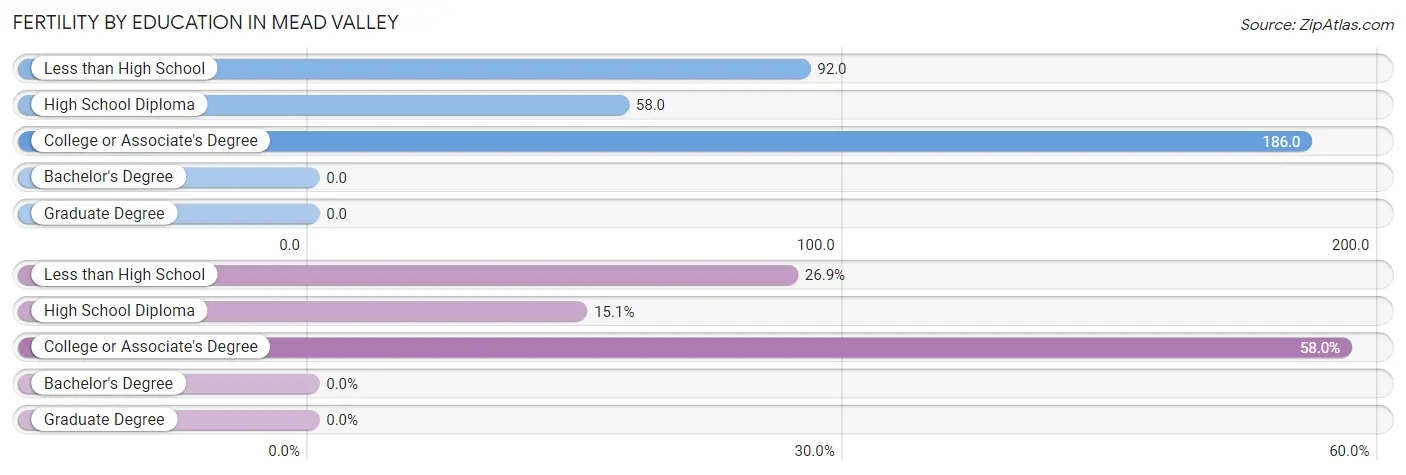
| Educational Attainment | Women with Births | Births / 1,000 Women |
| Less than High School | 159 (26.9%) | 92.0 |
| High School Diploma | 89 (15.1%) | 58.0 |
| College or Associate's Degree | 343 (58.0%) | 186.0 |
| Bachelor's Degree | 0 (0.0%) | 0.0 |
| Graduate Degree | 0 (0.0%) | 0.0 |
| Total | 591 (100.0%) | 105.0 |
Fertility by Education by Marriage Status in Mead Valley
56.9% of women with births in Mead Valley are unmarried. Women with the educational attainment of high school diploma are most likely to be married with 85.4% of them married at childbirth, while women with the educational attainment of college or associate's degree are least likely to be married with 82.2% of them unmarried at childbirth.
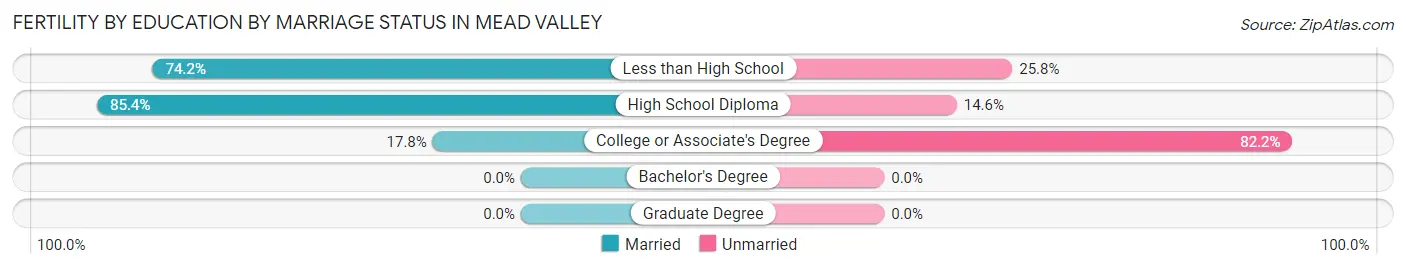
| Educational Attainment | Married | Unmarried |
| Less than High School | 118 (74.2%) | 41 (25.8%) |
| High School Diploma | 76 (85.4%) | 13 (14.6%) |
| College or Associate's Degree | 61 (17.8%) | 282 (82.2%) |
| Bachelor's Degree | 0 (0.0%) | 0 (0.0%) |
| Graduate Degree | 0 (0.0%) | 0 (0.0%) |
| Total | 255 (43.1%) | 336 (56.9%) |
Employment Characteristics in Mead Valley
Employment by Class of Employer in Mead Valley
Among the 9,001 employed individuals in Mead Valley, private company employees (7,051 | 78.3%), local government employees (625 | 6.9%), and self-employed (not incorporated) (510 | 5.7%) make up the most common classes of employment.
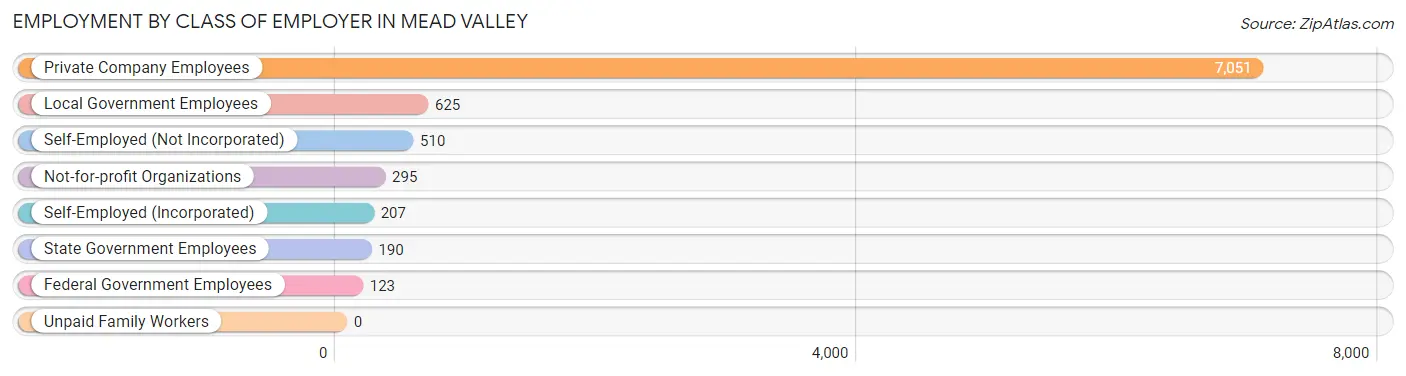
| Employer Class | # Employees | % Employees |
| Private Company Employees | 7,051 | 78.3% |
| Self-Employed (Incorporated) | 207 | 2.3% |
| Self-Employed (Not Incorporated) | 510 | 5.7% |
| Not-for-profit Organizations | 295 | 3.3% |
| Local Government Employees | 625 | 6.9% |
| State Government Employees | 190 | 2.1% |
| Federal Government Employees | 123 | 1.4% |
| Unpaid Family Workers | 0 | 0.0% |
| Total | 9,001 | 100.0% |
Employment Status by Age in Mead Valley
According to the labor force statistics for Mead Valley, out of the total population over 16 years of age (15,874), 61.8% or 9,810 individuals are in the labor force, with 6.3% or 618 of them unemployed. The age group with the highest labor force participation rate is 20 to 24 years, with 80.6% or 1,521 individuals in the labor force. Within the labor force, the 60 to 64 years age range has the highest percentage of unemployed individuals, with 21.9% or 112 of them being unemployed.
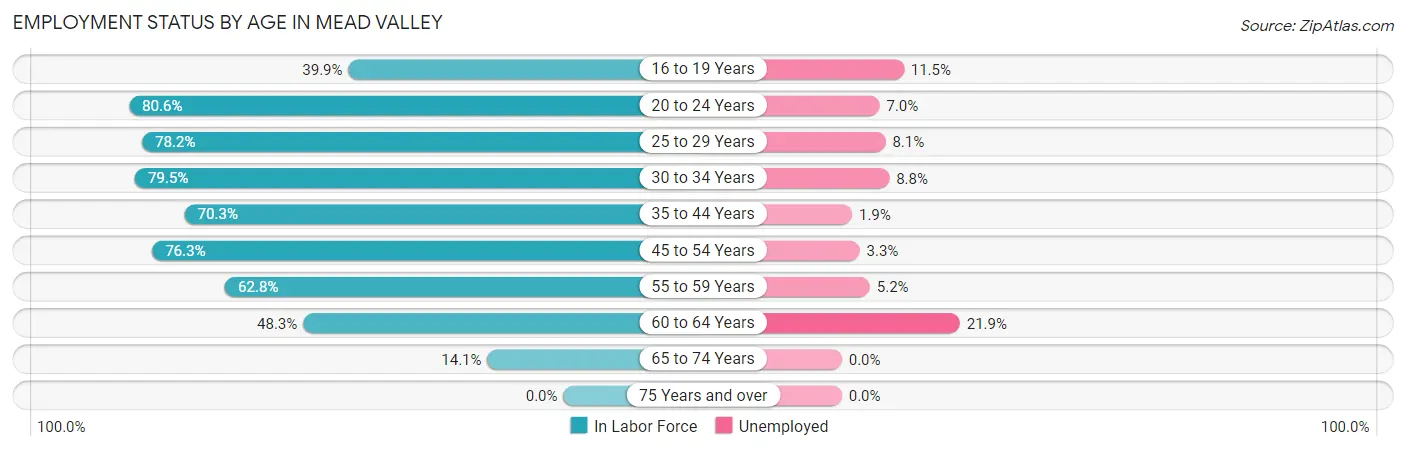
| Age Bracket | In Labor Force | Unemployed |
| 16 to 19 Years | 573 (39.9%) | 66 (11.5%) |
| 20 to 24 Years | 1,521 (80.6%) | 106 (7.0%) |
| 25 to 29 Years | 1,214 (78.2%) | 98 (8.1%) |
| 30 to 34 Years | 1,026 (79.5%) | 90 (8.8%) |
| 35 to 44 Years | 1,836 (70.3%) | 35 (1.9%) |
| 45 to 54 Years | 2,165 (76.3%) | 71 (3.3%) |
| 55 to 59 Years | 807 (62.8%) | 42 (5.2%) |
| 60 to 64 Years | 511 (48.3%) | 112 (21.9%) |
| 65 to 74 Years | 160 (14.1%) | 0 (0.0%) |
| 75 Years and over | 0 (0.0%) | 0 (0.0%) |
| Total | 9,810 (61.8%) | 618 (6.3%) |
Employment Status by Educational Attainment in Mead Valley
According to labor force statistics for Mead Valley, 71.1% of individuals (7,559) out of the total population between 25 and 64 years of age (10,632) are in the labor force, with 5.9% or 446 of them being unemployed. The group with the highest labor force participation rate are those with the educational attainment of bachelor's degree or higher, with 86.0% or 787 individuals in the labor force. Within the labor force, individuals with high school diploma education have the highest percentage of unemployment, with 7.2% or 164 of them being unemployed.
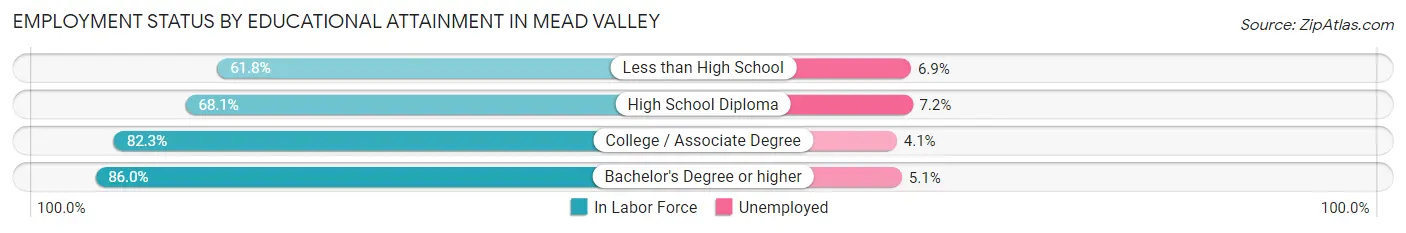
| Educational Attainment | In Labor Force | Unemployed |
| Less than High School | 2,259 (61.8%) | 252 (6.9%) |
| High School Diploma | 2,272 (68.1%) | 240 (7.2%) |
| College / Associate Degree | 2,242 (82.3%) | 112 (4.1%) |
| Bachelor's Degree or higher | 787 (86.0%) | 47 (5.1%) |
| Total | 7,559 (71.1%) | 627 (5.9%) |
Employment Occupations by Sex in Mead Valley
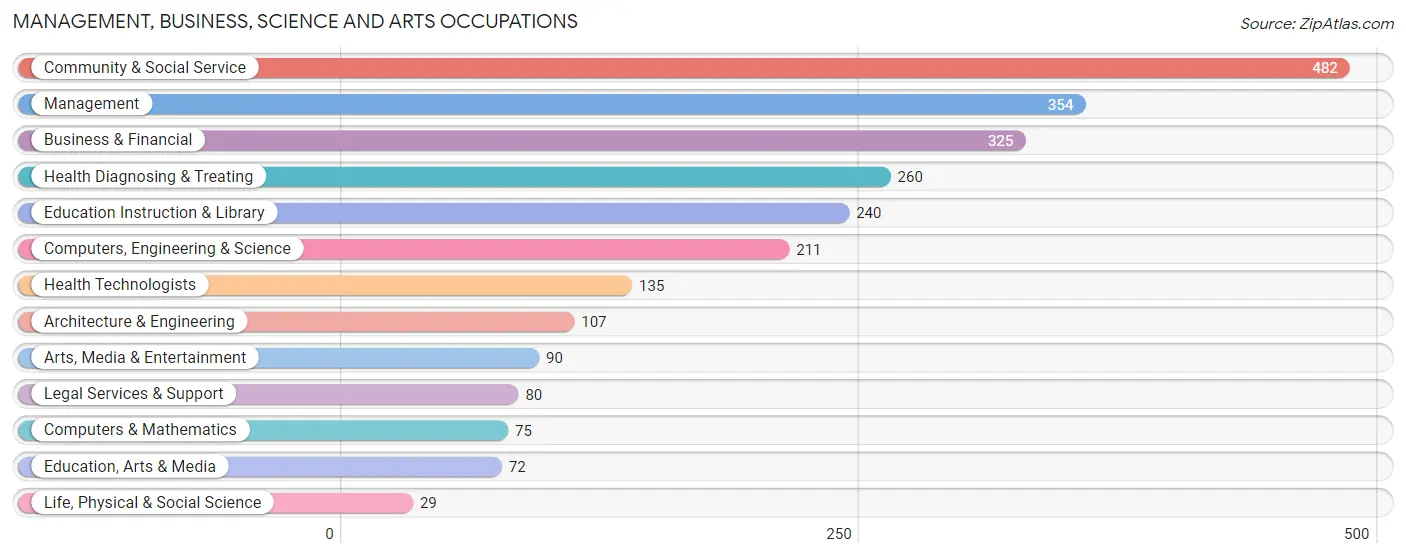
Management, Business, Science and Arts Occupations
The most common Management, Business, Science and Arts occupations in Mead Valley are Community & Social Service (482 | 5.3%), Management (354 | 3.9%), Business & Financial (325 | 3.5%), Health Diagnosing & Treating (260 | 2.8%), and Education Instruction & Library (240 | 2.6%).
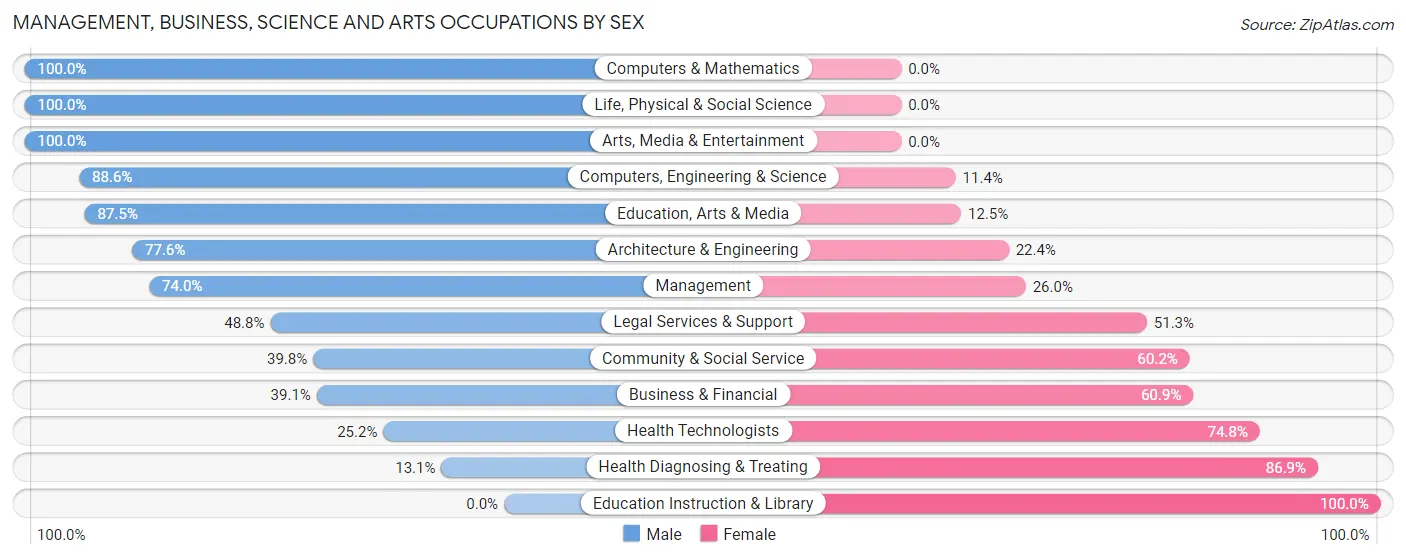
Management, Business, Science and Arts Occupations by Sex
Within the Management, Business, Science and Arts occupations in Mead Valley, the most male-oriented occupations are Computers & Mathematics (100.0%), Life, Physical & Social Science (100.0%), and Arts, Media & Entertainment (100.0%), while the most female-oriented occupations are Education Instruction & Library (100.0%), Health Diagnosing & Treating (86.9%), and Health Technologists (74.8%).
| Occupation | Male | Female |
| Management | 262 (74.0%) | 92 (26.0%) |
| Business & Financial | 127 (39.1%) | 198 (60.9%) |
| Computers, Engineering & Science | 187 (88.6%) | 24 (11.4%) |
| Computers & Mathematics | 75 (100.0%) | 0 (0.0%) |
| Architecture & Engineering | 83 (77.6%) | 24 (22.4%) |
| Life, Physical & Social Science | 29 (100.0%) | 0 (0.0%) |
| Community & Social Service | 192 (39.8%) | 290 (60.2%) |
| Education, Arts & Media | 63 (87.5%) | 9 (12.5%) |
| Legal Services & Support | 39 (48.7%) | 41 (51.2%) |
| Education Instruction & Library | 0 (0.0%) | 240 (100.0%) |
| Arts, Media & Entertainment | 90 (100.0%) | 0 (0.0%) |
| Health Diagnosing & Treating | 34 (13.1%) | 226 (86.9%) |
| Health Technologists | 34 (25.2%) | 101 (74.8%) |
| Total (Category) | 802 (49.1%) | 830 (50.9%) |
| Total (Overall) | 5,398 (58.9%) | 3,770 (41.1%) |
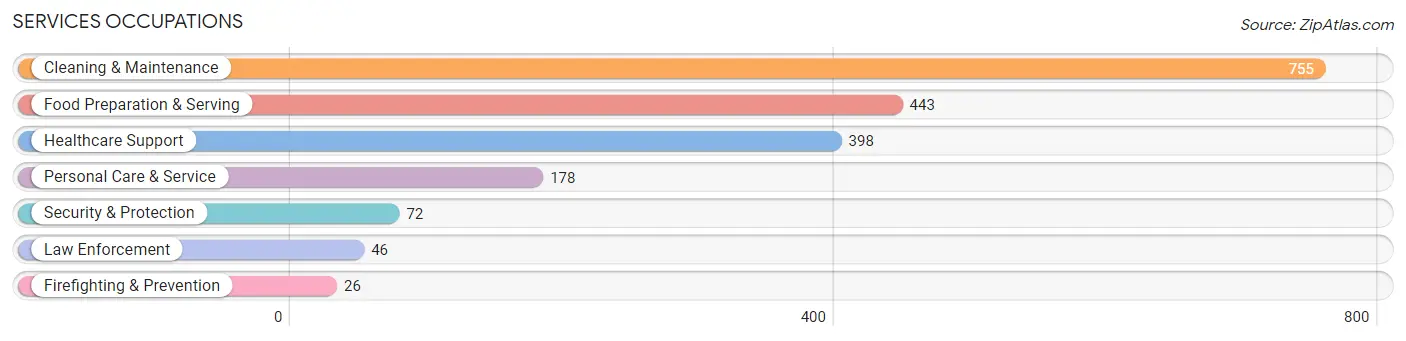
Services Occupations
The most common Services occupations in Mead Valley are Cleaning & Maintenance (755 | 8.2%), Food Preparation & Serving (443 | 4.8%), Healthcare Support (398 | 4.3%), Personal Care & Service (178 | 1.9%), and Security & Protection (72 | 0.8%).
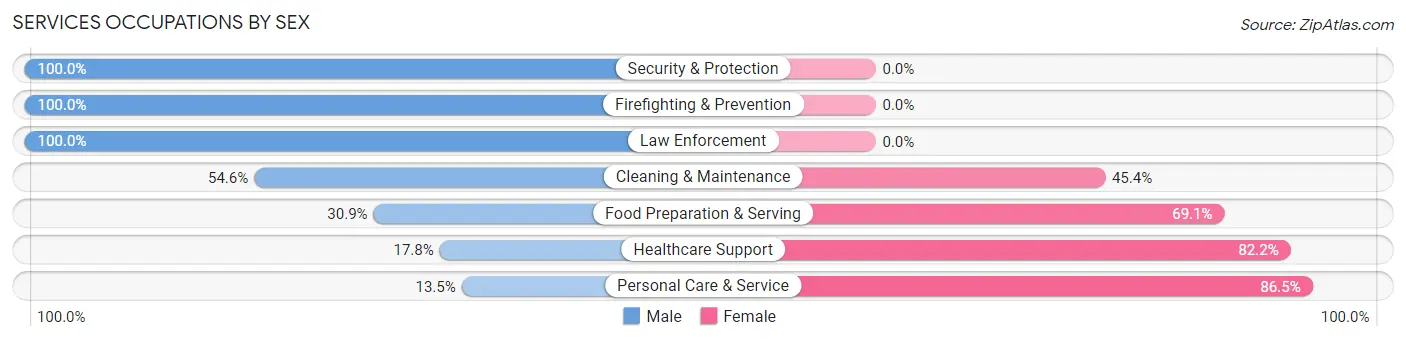
Services Occupations by Sex
Within the Services occupations in Mead Valley, the most male-oriented occupations are Security & Protection (100.0%), Firefighting & Prevention (100.0%), and Law Enforcement (100.0%), while the most female-oriented occupations are Personal Care & Service (86.5%), Healthcare Support (82.2%), and Food Preparation & Serving (69.1%).
| Occupation | Male | Female |
| Healthcare Support | 71 (17.8%) | 327 (82.2%) |
| Security & Protection | 72 (100.0%) | 0 (0.0%) |
| Firefighting & Prevention | 26 (100.0%) | 0 (0.0%) |
| Law Enforcement | 46 (100.0%) | 0 (0.0%) |
| Food Preparation & Serving | 137 (30.9%) | 306 (69.1%) |
| Cleaning & Maintenance | 412 (54.6%) | 343 (45.4%) |
| Personal Care & Service | 24 (13.5%) | 154 (86.5%) |
| Total (Category) | 716 (38.8%) | 1,130 (61.2%) |
| Total (Overall) | 5,398 (58.9%) | 3,770 (41.1%) |
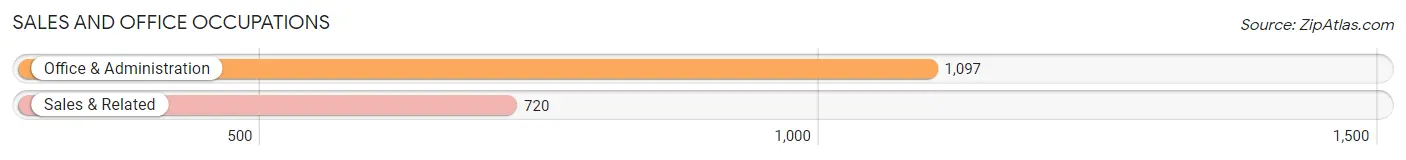
Sales and Office Occupations
The most common Sales and Office occupations in Mead Valley are Office & Administration (1,097 | 12.0%), and Sales & Related (720 | 7.9%).
Sales and Office Occupations by Sex
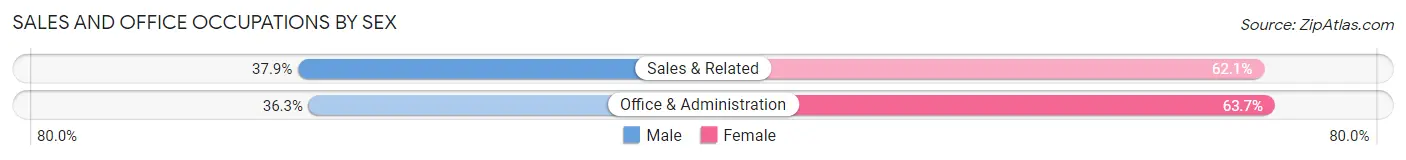
| Occupation | Male | Female |
| Sales & Related | 273 (37.9%) | 447 (62.1%) |
| Office & Administration | 398 (36.3%) | 699 (63.7%) |
| Total (Category) | 671 (36.9%) | 1,146 (63.1%) |
| Total (Overall) | 5,398 (58.9%) | 3,770 (41.1%) |
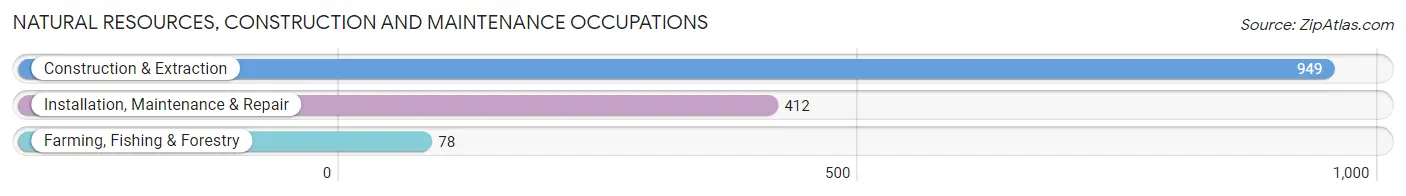
Natural Resources, Construction and Maintenance Occupations
The most common Natural Resources, Construction and Maintenance occupations in Mead Valley are Construction & Extraction (949 | 10.3%), Installation, Maintenance & Repair (412 | 4.5%), and Farming, Fishing & Forestry (78 | 0.9%).
Natural Resources, Construction and Maintenance Occupations by Sex
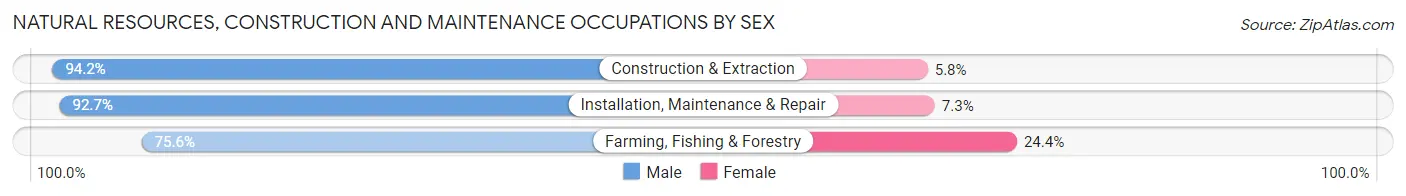
| Occupation | Male | Female |
| Farming, Fishing & Forestry | 59 (75.6%) | 19 (24.4%) |
| Construction & Extraction | 894 (94.2%) | 55 (5.8%) |
| Installation, Maintenance & Repair | 382 (92.7%) | 30 (7.3%) |
| Total (Category) | 1,335 (92.8%) | 104 (7.2%) |
| Total (Overall) | 5,398 (58.9%) | 3,770 (41.1%) |
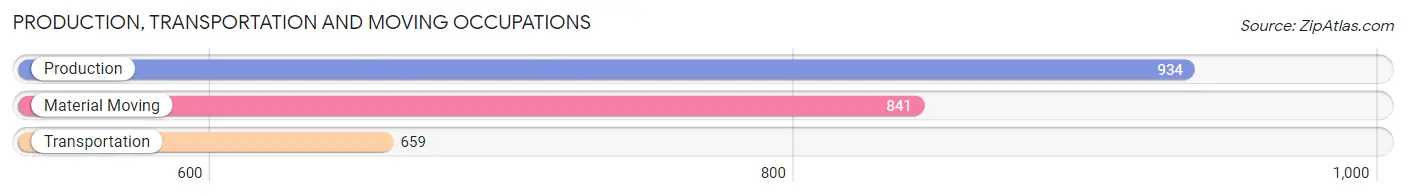
Production, Transportation and Moving Occupations
The most common Production, Transportation and Moving occupations in Mead Valley are Production (934 | 10.2%), Material Moving (841 | 9.2%), and Transportation (659 | 7.2%).
Production, Transportation and Moving Occupations by Sex
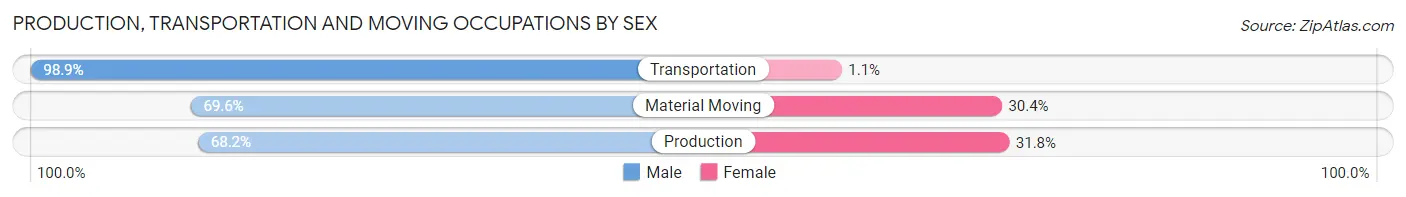
| Occupation | Male | Female |
| Production | 637 (68.2%) | 297 (31.8%) |
| Transportation | 652 (98.9%) | 7 (1.1%) |
| Material Moving | 585 (69.6%) | 256 (30.4%) |
| Total (Category) | 1,874 (77.0%) | 560 (23.0%) |
| Total (Overall) | 5,398 (58.9%) | 3,770 (41.1%) |
Employment Industries by Sex in Mead Valley
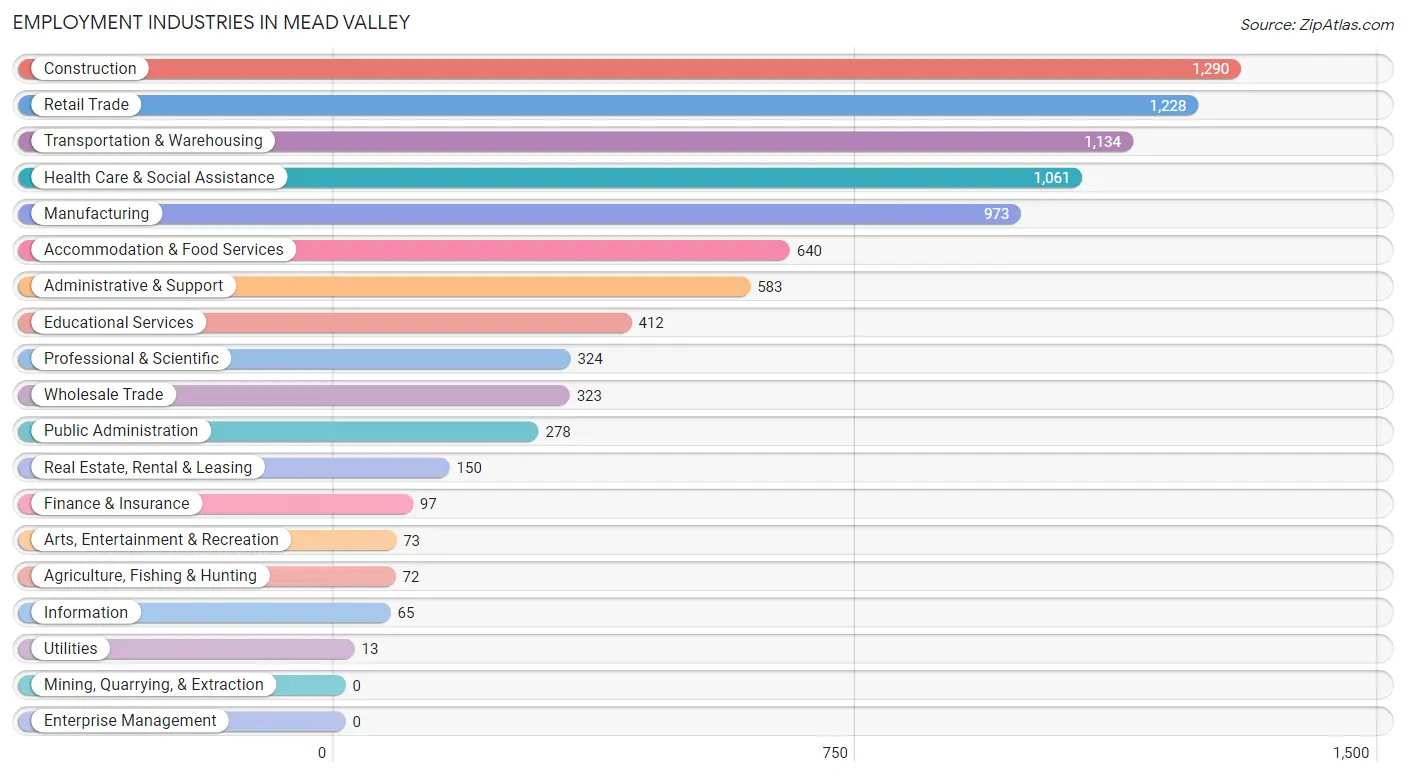
Employment Industries in Mead Valley
The major employment industries in Mead Valley include Construction (1,290 | 14.1%), Retail Trade (1,228 | 13.4%), Transportation & Warehousing (1,134 | 12.4%), Health Care & Social Assistance (1,061 | 11.6%), and Manufacturing (973 | 10.6%).
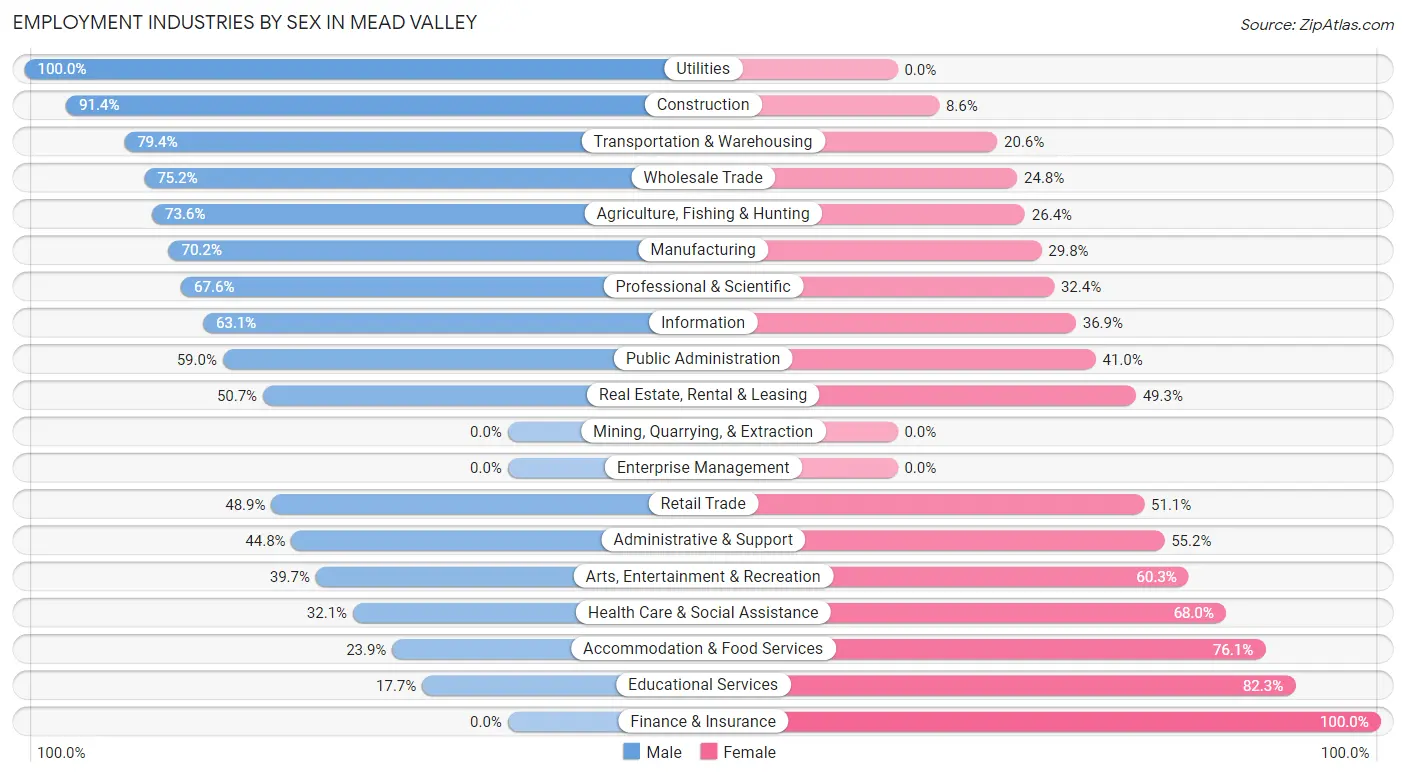
Employment Industries by Sex in Mead Valley
The Mead Valley industries that see more men than women are Utilities (100.0%), Construction (91.4%), and Transportation & Warehousing (79.4%), whereas the industries that tend to have a higher number of women are Finance & Insurance (100.0%), Educational Services (82.3%), and Accommodation & Food Services (76.1%).
| Industry | Male | Female |
| Agriculture, Fishing & Hunting | 53 (73.6%) | 19 (26.4%) |
| Mining, Quarrying, & Extraction | 0 (0.0%) | 0 (0.0%) |
| Construction | 1,179 (91.4%) | 111 (8.6%) |
| Manufacturing | 683 (70.2%) | 290 (29.8%) |
| Wholesale Trade | 243 (75.2%) | 80 (24.8%) |
| Retail Trade | 601 (48.9%) | 627 (51.1%) |
| Transportation & Warehousing | 900 (79.4%) | 234 (20.6%) |
| Utilities | 13 (100.0%) | 0 (0.0%) |
| Information | 41 (63.1%) | 24 (36.9%) |
| Finance & Insurance | 0 (0.0%) | 97 (100.0%) |
| Real Estate, Rental & Leasing | 76 (50.7%) | 74 (49.3%) |
| Professional & Scientific | 219 (67.6%) | 105 (32.4%) |
| Enterprise Management | 0 (0.0%) | 0 (0.0%) |
| Administrative & Support | 261 (44.8%) | 322 (55.2%) |
| Educational Services | 73 (17.7%) | 339 (82.3%) |
| Health Care & Social Assistance | 340 (32.1%) | 721 (67.9%) |
| Arts, Entertainment & Recreation | 29 (39.7%) | 44 (60.3%) |
| Accommodation & Food Services | 153 (23.9%) | 487 (76.1%) |
| Public Administration | 164 (59.0%) | 114 (41.0%) |
| Total | 5,398 (58.9%) | 3,770 (41.1%) |
Education in Mead Valley
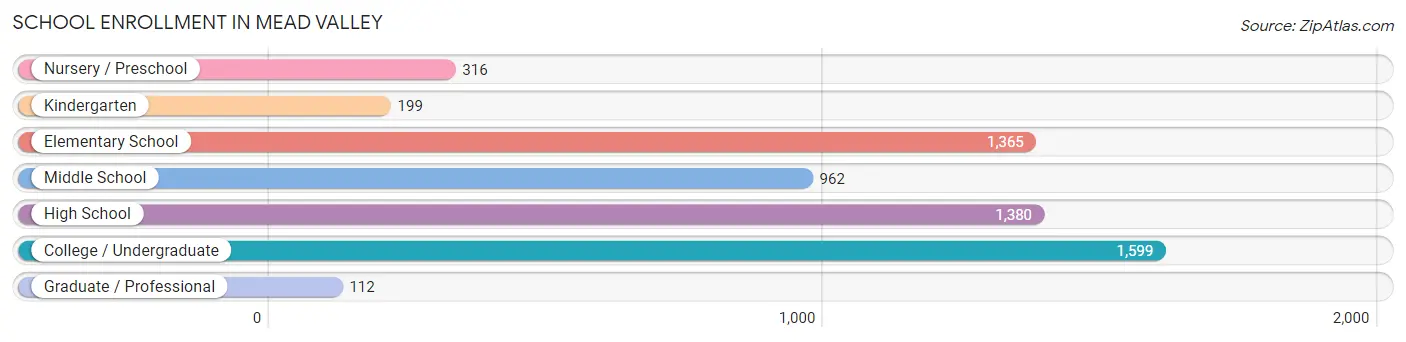
School Enrollment in Mead Valley
The most common levels of schooling among the 5,933 students in Mead Valley are college / undergraduate (1,599 | 27.0%), high school (1,380 | 23.3%), and elementary school (1,365 | 23.0%).
| School Level | # Students | % Students |
| Nursery / Preschool | 316 | 5.3% |
| Kindergarten | 199 | 3.4% |
| Elementary School | 1,365 | 23.0% |
| Middle School | 962 | 16.2% |
| High School | 1,380 | 23.3% |
| College / Undergraduate | 1,599 | 27.0% |
| Graduate / Professional | 112 | 1.9% |
| Total | 5,933 | 100.0% |
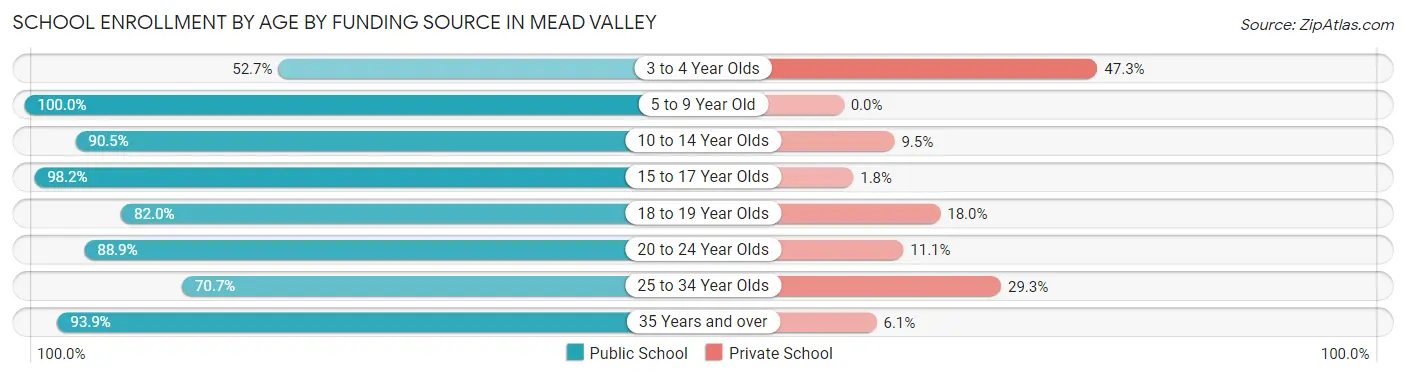
School Enrollment by Age by Funding Source in Mead Valley
Out of a total of 5,933 students who are enrolled in schools in Mead Valley, 564 (9.5%) attend a private institution, while the remaining 5,369 (90.5%) are enrolled in public schools. The age group of 3 to 4 year olds has the highest likelihood of being enrolled in private schools, with 112 (47.3% in the age bracket) enrolled. Conversely, the age group of 5 to 9 year old has the lowest likelihood of being enrolled in a private school, with 1,516 (100.0% in the age bracket) attending a public institution.
| Age Bracket | Public School | Private School |
| 3 to 4 Year Olds | 125 (52.7%) | 112 (47.3%) |
| 5 to 9 Year Old | 1,516 (100.0%) | 0 (0.0%) |
| 10 to 14 Year Olds | 1,292 (90.5%) | 135 (9.5%) |
| 15 to 17 Year Olds | 876 (98.2%) | 16 (1.8%) |
| 18 to 19 Year Olds | 456 (82.0%) | 100 (18.0%) |
| 20 to 24 Year Olds | 735 (88.9%) | 92 (11.1%) |
| 25 to 34 Year Olds | 234 (70.7%) | 97 (29.3%) |
| 35 Years and over | 138 (93.9%) | 9 (6.1%) |
| Total | 5,369 (90.5%) | 564 (9.5%) |
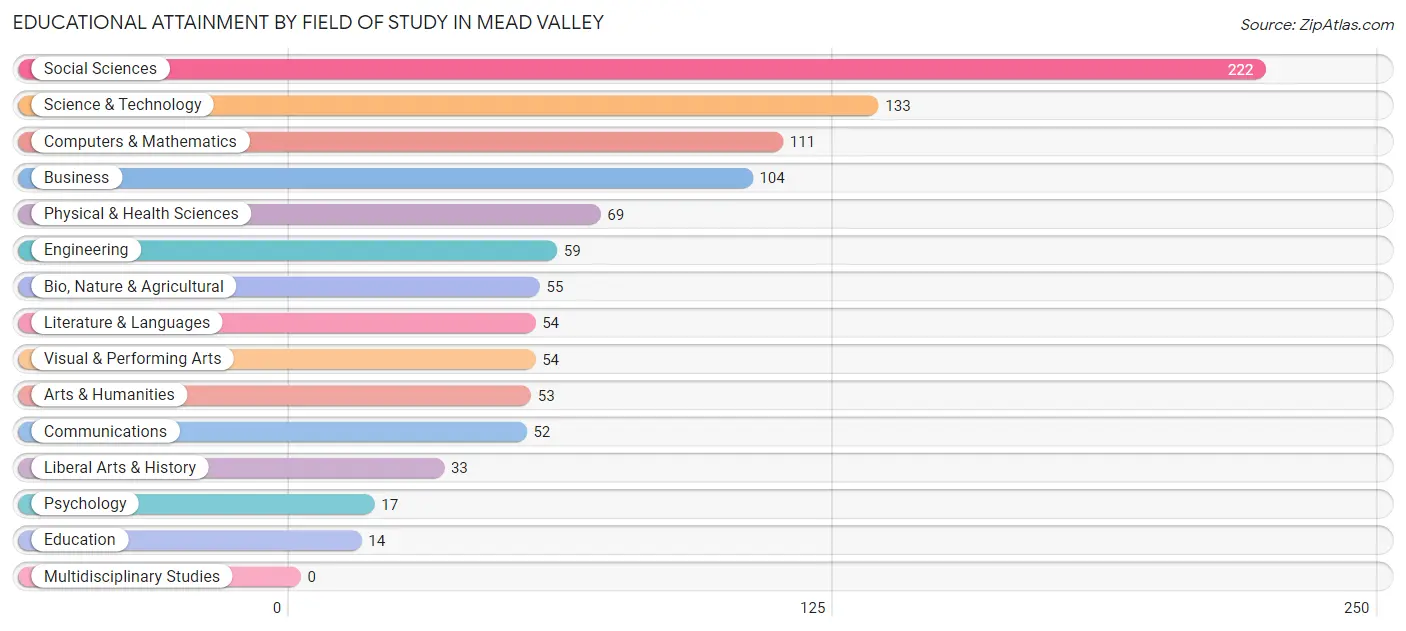
Educational Attainment by Field of Study in Mead Valley
Social sciences (222 | 21.5%), science & technology (133 | 12.9%), computers & mathematics (111 | 10.8%), business (104 | 10.1%), and physical & health sciences (69 | 6.7%) are the most common fields of study among 1,030 individuals in Mead Valley who have obtained a bachelor's degree or higher.
| Field of Study | # Graduates | % Graduates |
| Computers & Mathematics | 111 | 10.8% |
| Bio, Nature & Agricultural | 55 | 5.3% |
| Physical & Health Sciences | 69 | 6.7% |
| Psychology | 17 | 1.7% |
| Social Sciences | 222 | 21.5% |
| Engineering | 59 | 5.7% |
| Multidisciplinary Studies | 0 | 0.0% |
| Science & Technology | 133 | 12.9% |
| Business | 104 | 10.1% |
| Education | 14 | 1.4% |
| Literature & Languages | 54 | 5.2% |
| Liberal Arts & History | 33 | 3.2% |
| Visual & Performing Arts | 54 | 5.2% |
| Communications | 52 | 5.1% |
| Arts & Humanities | 53 | 5.1% |
| Total | 1,030 | 100.0% |
Transportation & Commute in Mead Valley
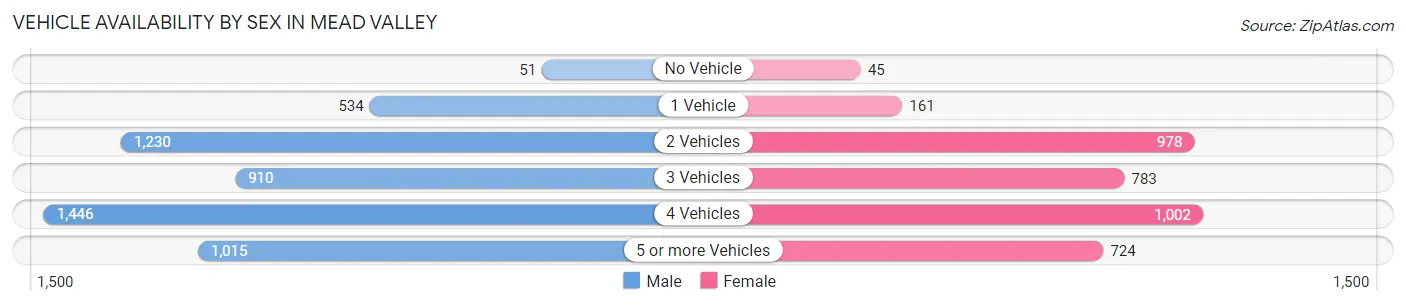
Vehicle Availability by Sex in Mead Valley
The most prevalent vehicle ownership categories in Mead Valley are males with 4 vehicles (1,446, accounting for 27.9%) and females with 4 vehicles (1,002, making up 39.2%).
| Vehicles Available | Male | Female |
| No Vehicle | 51 (1.0%) | 45 (1.2%) |
| 1 Vehicle | 534 (10.3%) | 161 (4.4%) |
| 2 Vehicles | 1,230 (23.7%) | 978 (26.5%) |
| 3 Vehicles | 910 (17.5%) | 783 (21.2%) |
| 4 Vehicles | 1,446 (27.9%) | 1,002 (27.1%) |
| 5 or more Vehicles | 1,015 (19.6%) | 724 (19.6%) |
| Total | 5,186 (100.0%) | 3,693 (100.0%) |
Commute Time in Mead Valley
The most frequently occuring commute durations in Mead Valley are 30 to 34 minutes (1,821 commuters, 22.7%), 15 to 19 minutes (1,341 commuters, 16.7%), and 20 to 24 minutes (1,073 commuters, 13.4%).
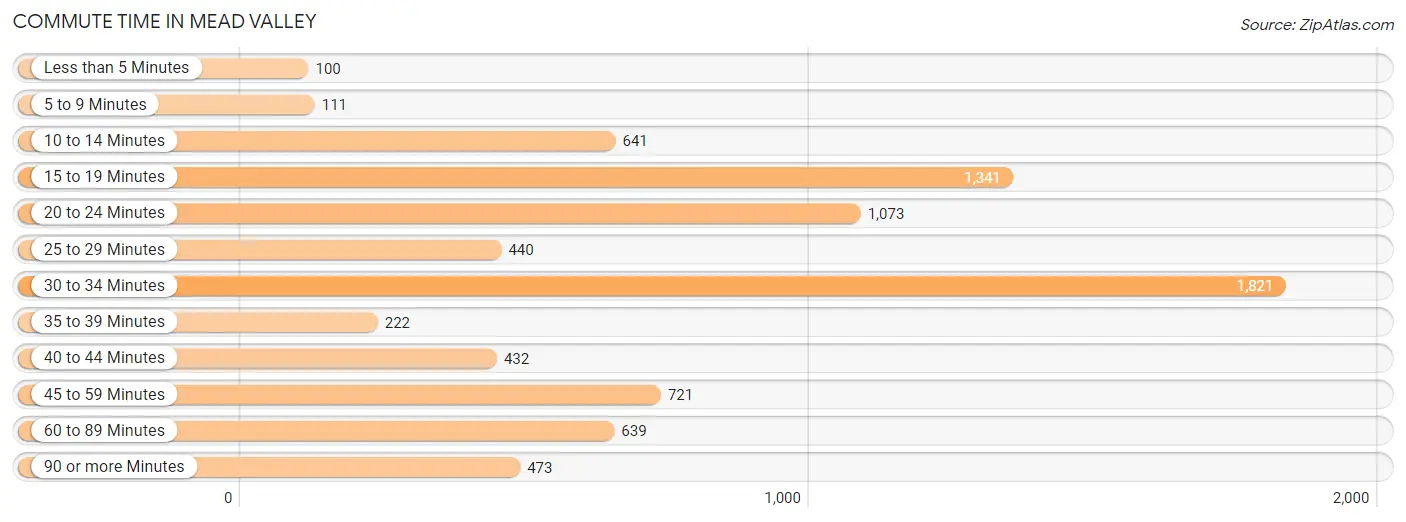
| Commute Time | # Commuters | % Commuters |
| Less than 5 Minutes | 100 | 1.3% |
| 5 to 9 Minutes | 111 | 1.4% |
| 10 to 14 Minutes | 641 | 8.0% |
| 15 to 19 Minutes | 1,341 | 16.7% |
| 20 to 24 Minutes | 1,073 | 13.4% |
| 25 to 29 Minutes | 440 | 5.5% |
| 30 to 34 Minutes | 1,821 | 22.7% |
| 35 to 39 Minutes | 222 | 2.8% |
| 40 to 44 Minutes | 432 | 5.4% |
| 45 to 59 Minutes | 721 | 9.0% |
| 60 to 89 Minutes | 639 | 8.0% |
| 90 or more Minutes | 473 | 5.9% |
Commute Time by Sex in Mead Valley
The most common commute times in Mead Valley are 30 to 34 minutes (1,019 commuters, 20.9%) for males and 30 to 34 minutes (802 commuters, 25.6%) for females.
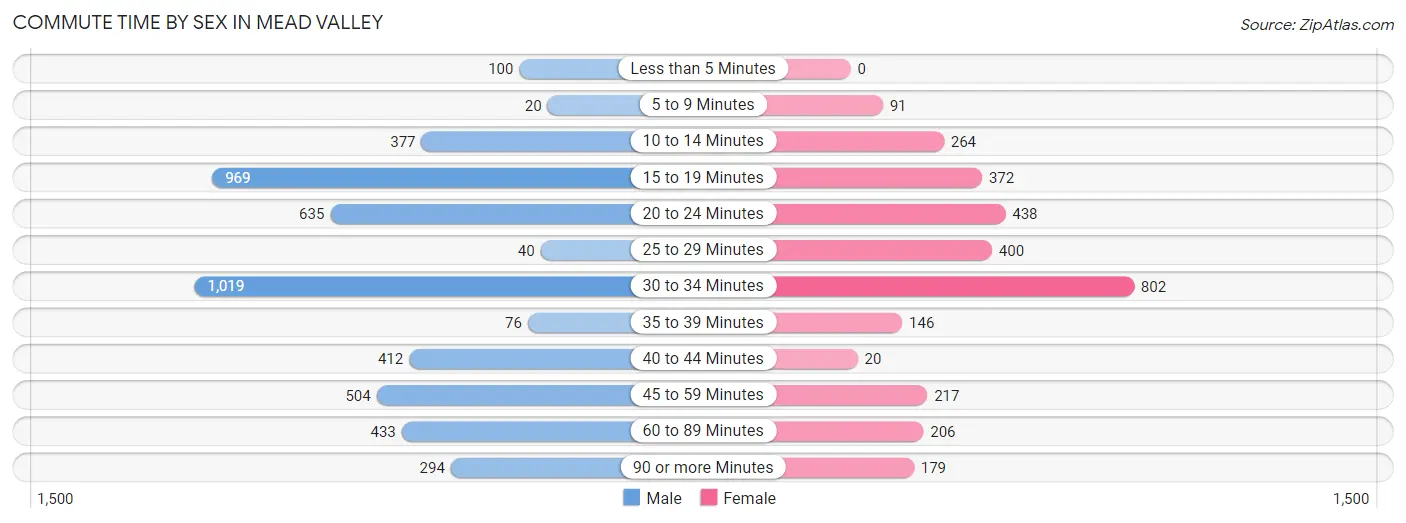
| Commute Time | Male | Female |
| Less than 5 Minutes | 100 (2.1%) | 0 (0.0%) |
| 5 to 9 Minutes | 20 (0.4%) | 91 (2.9%) |
| 10 to 14 Minutes | 377 (7.7%) | 264 (8.4%) |
| 15 to 19 Minutes | 969 (19.9%) | 372 (11.9%) |
| 20 to 24 Minutes | 635 (13.0%) | 438 (14.0%) |
| 25 to 29 Minutes | 40 (0.8%) | 400 (12.8%) |
| 30 to 34 Minutes | 1,019 (20.9%) | 802 (25.6%) |
| 35 to 39 Minutes | 76 (1.6%) | 146 (4.7%) |
| 40 to 44 Minutes | 412 (8.4%) | 20 (0.6%) |
| 45 to 59 Minutes | 504 (10.3%) | 217 (6.9%) |
| 60 to 89 Minutes | 433 (8.9%) | 206 (6.6%) |
| 90 or more Minutes | 294 (6.0%) | 179 (5.7%) |
Time of Departure to Work by Sex in Mead Valley
The most frequent times of departure to work in Mead Valley are 12:00 AM to 4:59 AM (1,053, 21.6%) for males and 5:30 AM to 5:59 AM (445, 14.2%) for females.
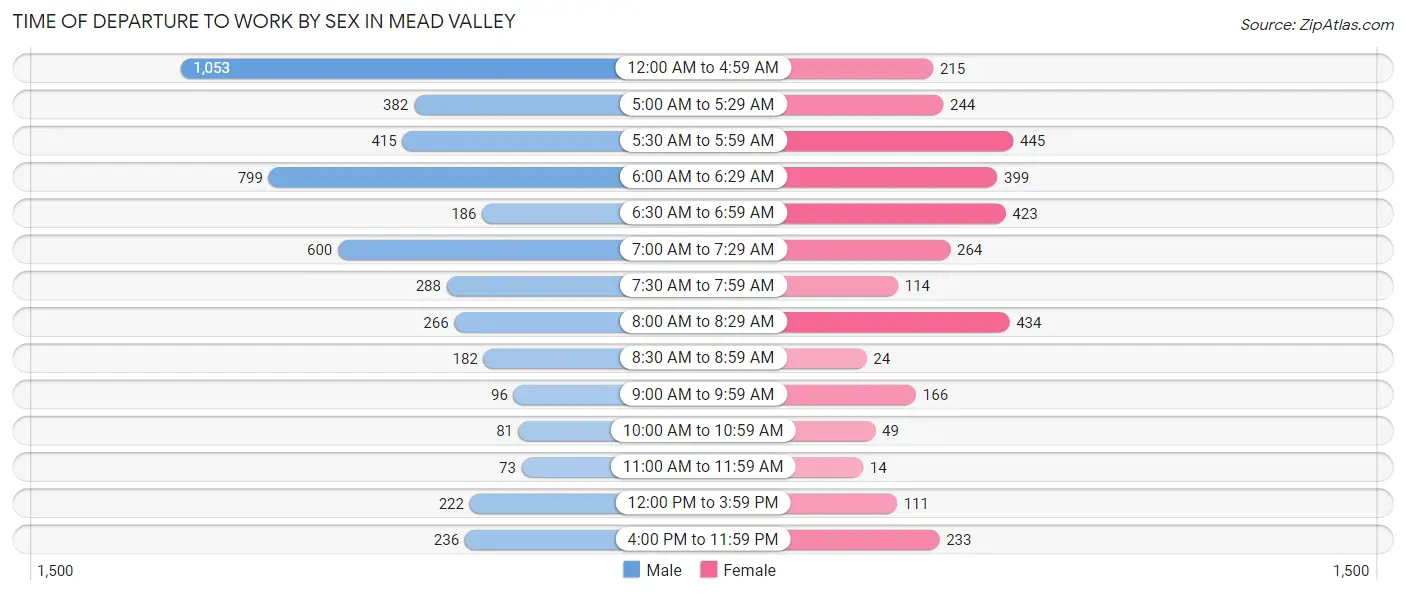
| Time of Departure | Male | Female |
| 12:00 AM to 4:59 AM | 1,053 (21.6%) | 215 (6.9%) |
| 5:00 AM to 5:29 AM | 382 (7.8%) | 244 (7.8%) |
| 5:30 AM to 5:59 AM | 415 (8.5%) | 445 (14.2%) |
| 6:00 AM to 6:29 AM | 799 (16.4%) | 399 (12.7%) |
| 6:30 AM to 6:59 AM | 186 (3.8%) | 423 (13.5%) |
| 7:00 AM to 7:29 AM | 600 (12.3%) | 264 (8.4%) |
| 7:30 AM to 7:59 AM | 288 (5.9%) | 114 (3.6%) |
| 8:00 AM to 8:29 AM | 266 (5.4%) | 434 (13.8%) |
| 8:30 AM to 8:59 AM | 182 (3.7%) | 24 (0.8%) |
| 9:00 AM to 9:59 AM | 96 (2.0%) | 166 (5.3%) |
| 10:00 AM to 10:59 AM | 81 (1.7%) | 49 (1.6%) |
| 11:00 AM to 11:59 AM | 73 (1.5%) | 14 (0.4%) |
| 12:00 PM to 3:59 PM | 222 (4.5%) | 111 (3.5%) |
| 4:00 PM to 11:59 PM | 236 (4.8%) | 233 (7.4%) |
| Total | 4,879 (100.0%) | 3,135 (100.0%) |
Housing Occupancy in Mead Valley
Occupancy by Ownership in Mead Valley
Of the total 4,580 dwellings in Mead Valley, owner-occupied units account for 3,466 (75.7%), while renter-occupied units make up 1,114 (24.3%).
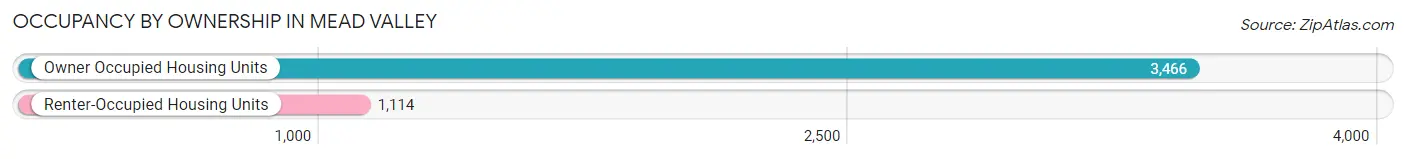
| Occupancy | # Housing Units | % Housing Units |
| Owner Occupied Housing Units | 3,466 | 75.7% |
| Renter-Occupied Housing Units | 1,114 | 24.3% |
| Total Occupied Housing Units | 4,580 | 100.0% |
Occupancy by Household Size in Mead Valley
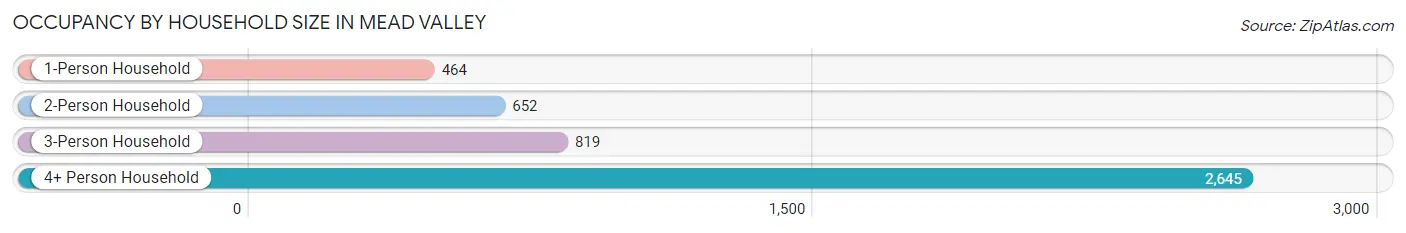
| Household Size | # Housing Units | % Housing Units |
| 1-Person Household | 464 | 10.1% |
| 2-Person Household | 652 | 14.2% |
| 3-Person Household | 819 | 17.9% |
| 4+ Person Household | 2,645 | 57.8% |
| Total Housing Units | 4,580 | 100.0% |
Occupancy by Ownership by Household Size in Mead Valley
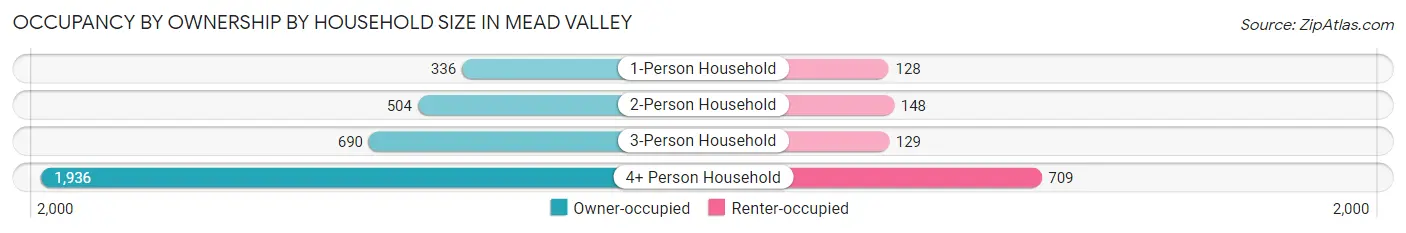
| Household Size | Owner-occupied | Renter-occupied |
| 1-Person Household | 336 (72.4%) | 128 (27.6%) |
| 2-Person Household | 504 (77.3%) | 148 (22.7%) |
| 3-Person Household | 690 (84.3%) | 129 (15.8%) |
| 4+ Person Household | 1,936 (73.2%) | 709 (26.8%) |
| Total Housing Units | 3,466 (75.7%) | 1,114 (24.3%) |
Occupancy by Educational Attainment in Mead Valley
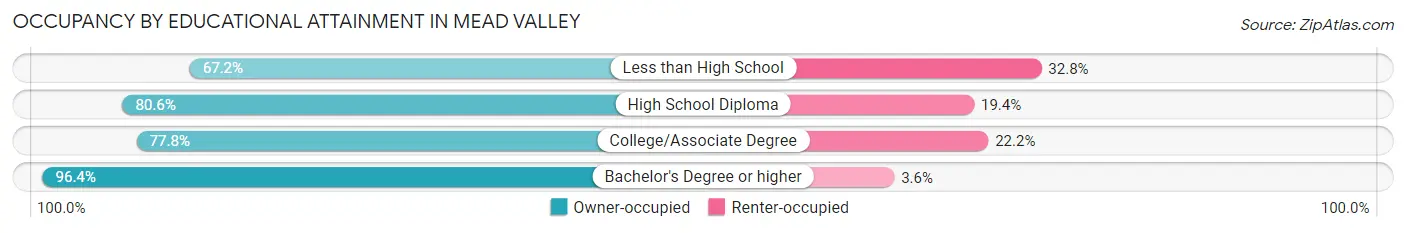
| Household Size | Owner-occupied | Renter-occupied |
| Less than High School | 1,172 (67.2%) | 571 (32.8%) |
| High School Diploma | 1,017 (80.6%) | 245 (19.4%) |
| College/Associate Degree | 1,008 (77.8%) | 288 (22.2%) |
| Bachelor's Degree or higher | 269 (96.4%) | 10 (3.6%) |
Occupancy by Age of Householder in Mead Valley
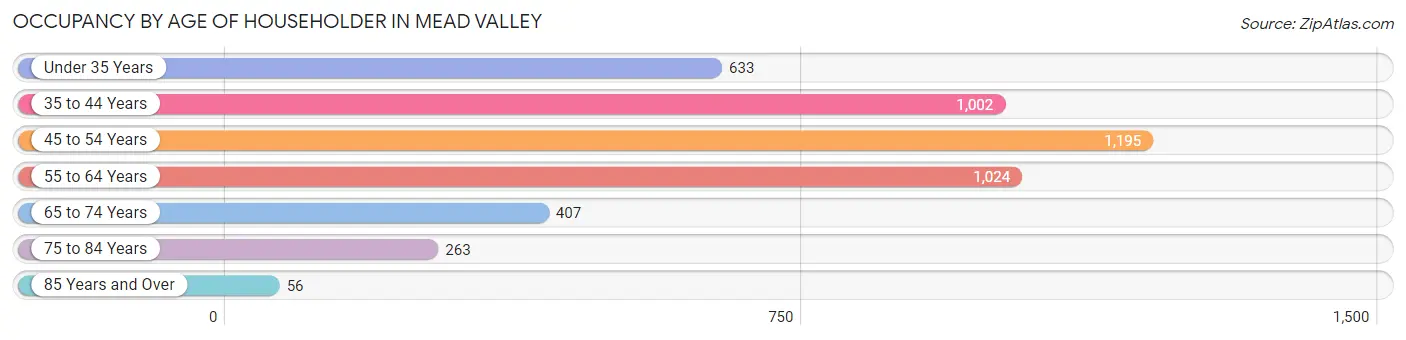
| Age Bracket | # Households | % Households |
| Under 35 Years | 633 | 13.8% |
| 35 to 44 Years | 1,002 | 21.9% |
| 45 to 54 Years | 1,195 | 26.1% |
| 55 to 64 Years | 1,024 | 22.4% |
| 65 to 74 Years | 407 | 8.9% |
| 75 to 84 Years | 263 | 5.7% |
| 85 Years and Over | 56 | 1.2% |
| Total | 4,580 | 100.0% |
Housing Finances in Mead Valley
Median Income by Occupancy in Mead Valley
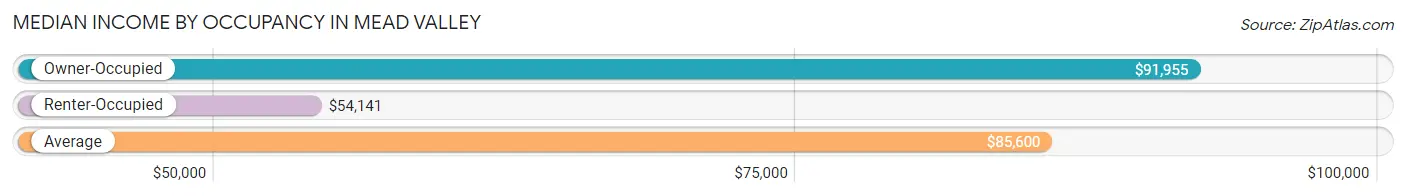
| Occupancy Type | # Households | Median Income |
| Owner-Occupied | 3,466 (75.7%) | $91,955 |
| Renter-Occupied | 1,114 (24.3%) | $54,141 |
| Average | 4,580 (100.0%) | $85,600 |
Occupancy by Householder Income Bracket in Mead Valley
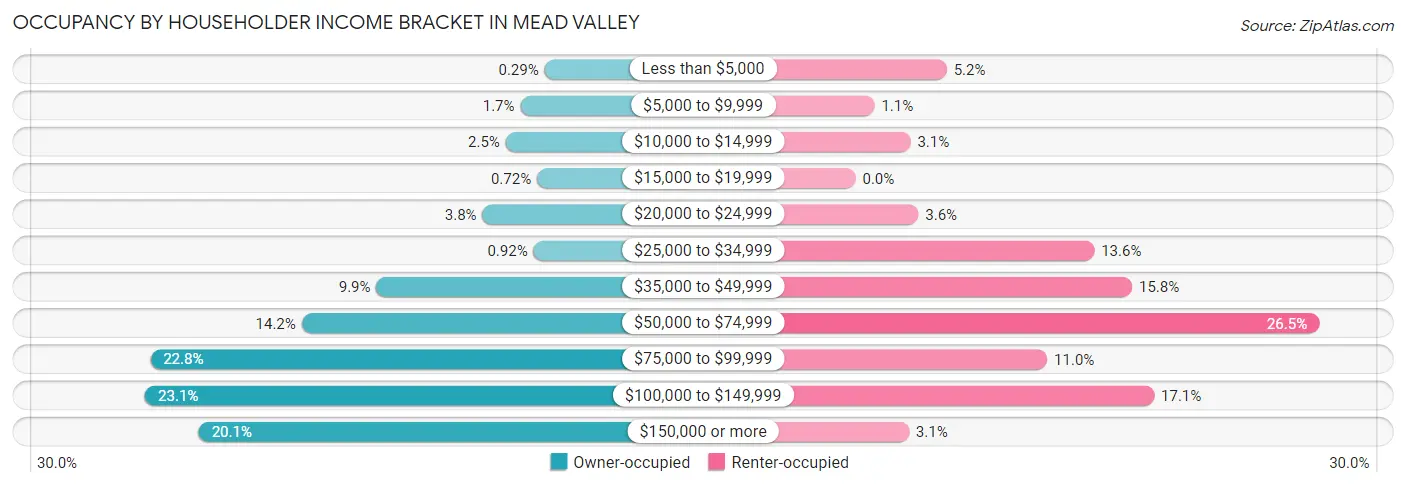
| Income Bracket | Owner-occupied | Renter-occupied |
| Less than $5,000 | 10 (0.3%) | 58 (5.2%) |
| $5,000 to $9,999 | 58 (1.7%) | 12 (1.1%) |
| $10,000 to $14,999 | 87 (2.5%) | 35 (3.1%) |
| $15,000 to $19,999 | 25 (0.7%) | 0 (0.0%) |
| $20,000 to $24,999 | 133 (3.8%) | 40 (3.6%) |
| $25,000 to $34,999 | 32 (0.9%) | 152 (13.6%) |
| $35,000 to $49,999 | 343 (9.9%) | 176 (15.8%) |
| $50,000 to $74,999 | 491 (14.2%) | 295 (26.5%) |
| $75,000 to $99,999 | 791 (22.8%) | 122 (11.0%) |
| $100,000 to $149,999 | 801 (23.1%) | 190 (17.1%) |
| $150,000 or more | 695 (20.1%) | 34 (3.0%) |
| Total | 3,466 (100.0%) | 1,114 (100.0%) |
Monthly Housing Cost Tiers in Mead Valley
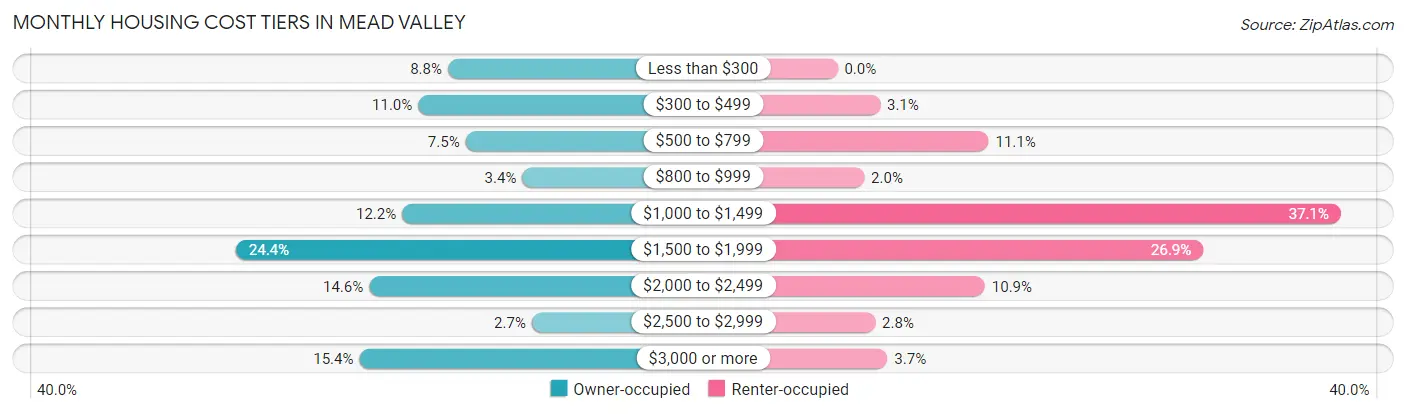
| Monthly Cost | Owner-occupied | Renter-occupied |
| Less than $300 | 306 (8.8%) | 0 (0.0%) |
| $300 to $499 | 382 (11.0%) | 35 (3.1%) |
| $500 to $799 | 261 (7.5%) | 124 (11.1%) |
| $800 to $999 | 116 (3.4%) | 22 (2.0%) |
| $1,000 to $1,499 | 423 (12.2%) | 413 (37.1%) |
| $1,500 to $1,999 | 847 (24.4%) | 300 (26.9%) |
| $2,000 to $2,499 | 507 (14.6%) | 121 (10.9%) |
| $2,500 to $2,999 | 92 (2.6%) | 31 (2.8%) |
| $3,000 or more | 532 (15.3%) | 41 (3.7%) |
| Total | 3,466 (100.0%) | 1,114 (100.0%) |
Physical Housing Characteristics in Mead Valley
Housing Structures in Mead Valley
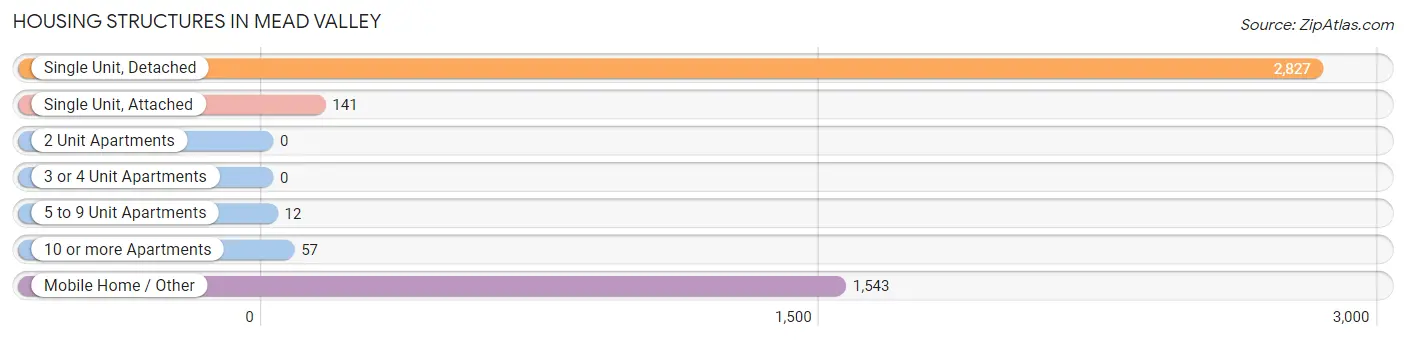
| Structure Type | # Housing Units | % Housing Units |
| Single Unit, Detached | 2,827 | 61.7% |
| Single Unit, Attached | 141 | 3.1% |
| 2 Unit Apartments | 0 | 0.0% |
| 3 or 4 Unit Apartments | 0 | 0.0% |
| 5 to 9 Unit Apartments | 12 | 0.3% |
| 10 or more Apartments | 57 | 1.2% |
| Mobile Home / Other | 1,543 | 33.7% |
| Total | 4,580 | 100.0% |
Housing Structures by Occupancy in Mead Valley
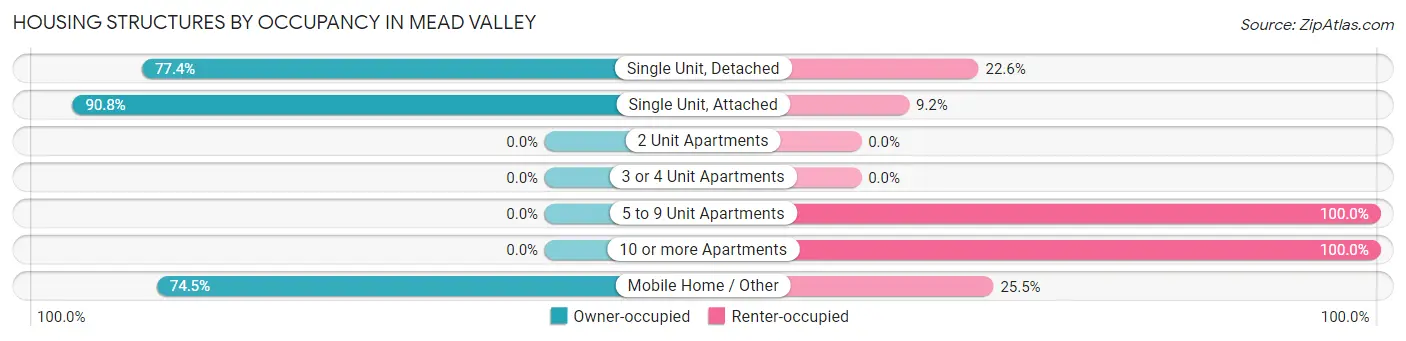
| Structure Type | Owner-occupied | Renter-occupied |
| Single Unit, Detached | 2,188 (77.4%) | 639 (22.6%) |
| Single Unit, Attached | 128 (90.8%) | 13 (9.2%) |
| 2 Unit Apartments | 0 (0.0%) | 0 (0.0%) |
| 3 or 4 Unit Apartments | 0 (0.0%) | 0 (0.0%) |
| 5 to 9 Unit Apartments | 0 (0.0%) | 12 (100.0%) |
| 10 or more Apartments | 0 (0.0%) | 57 (100.0%) |
| Mobile Home / Other | 1,150 (74.5%) | 393 (25.5%) |
| Total | 3,466 (75.7%) | 1,114 (24.3%) |
Housing Structures by Number of Rooms in Mead Valley
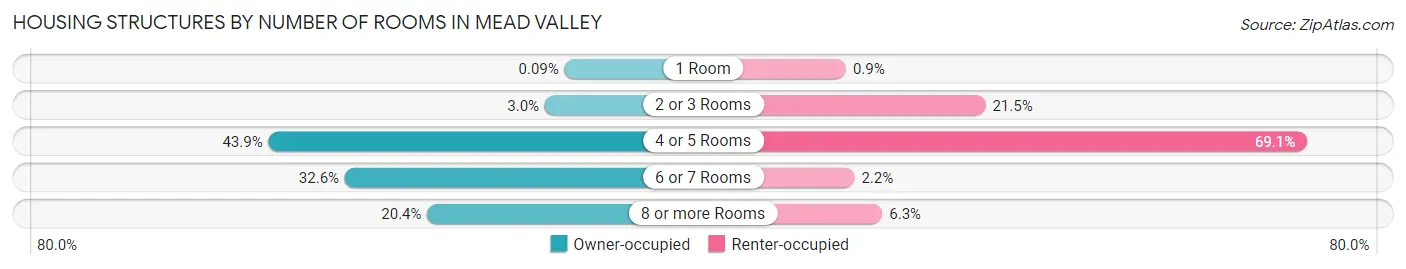
| Number of Rooms | Owner-occupied | Renter-occupied |
| 1 Room | 3 (0.1%) | 10 (0.9%) |
| 2 or 3 Rooms | 104 (3.0%) | 240 (21.5%) |
| 4 or 5 Rooms | 1,522 (43.9%) | 770 (69.1%) |
| 6 or 7 Rooms | 1,130 (32.6%) | 24 (2.1%) |
| 8 or more Rooms | 707 (20.4%) | 70 (6.3%) |
| Total | 3,466 (100.0%) | 1,114 (100.0%) |
Housing Structure by Heating Type in Mead Valley
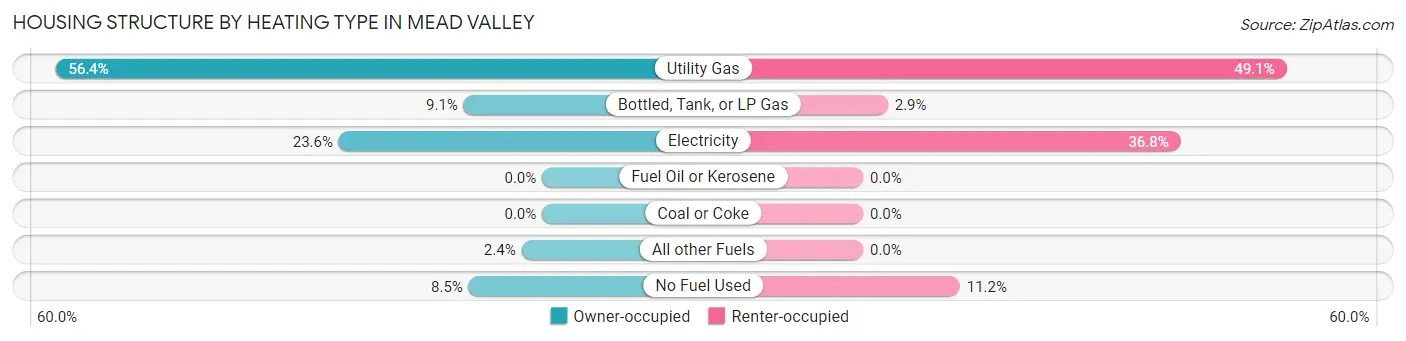
| Heating Type | Owner-occupied | Renter-occupied |
| Utility Gas | 1,956 (56.4%) | 547 (49.1%) |
| Bottled, Tank, or LP Gas | 315 (9.1%) | 32 (2.9%) |
| Electricity | 817 (23.6%) | 410 (36.8%) |
| Fuel Oil or Kerosene | 0 (0.0%) | 0 (0.0%) |
| Coal or Coke | 0 (0.0%) | 0 (0.0%) |
| All other Fuels | 83 (2.4%) | 0 (0.0%) |
| No Fuel Used | 295 (8.5%) | 125 (11.2%) |
| Total | 3,466 (100.0%) | 1,114 (100.0%) |
Household Vehicle Usage in Mead Valley
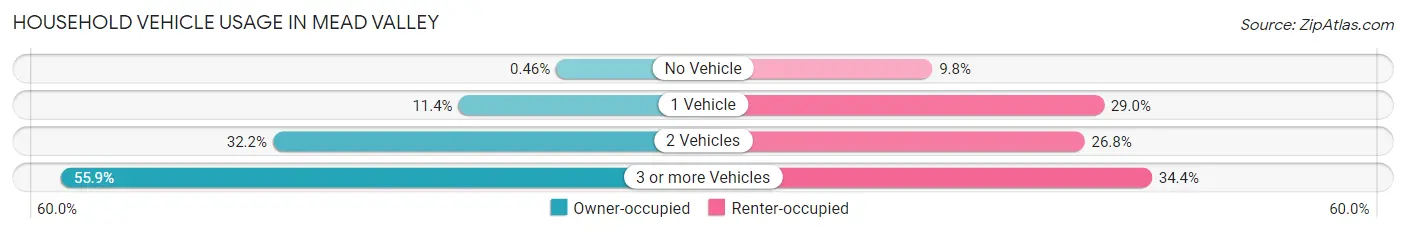
| Vehicles per Household | Owner-occupied | Renter-occupied |
| No Vehicle | 16 (0.5%) | 109 (9.8%) |
| 1 Vehicle | 395 (11.4%) | 323 (29.0%) |
| 2 Vehicles | 1,116 (32.2%) | 299 (26.8%) |
| 3 or more Vehicles | 1,939 (55.9%) | 383 (34.4%) |
| Total | 3,466 (100.0%) | 1,114 (100.0%) |
Real Estate & Mortgages in Mead Valley
Real Estate and Mortgage Overview in Mead Valley
| Characteristic | Without Mortgage | With Mortgage |
| Housing Units | 1,137 | 2,329 |
| Median Property Value | $262,200 | $390,200 |
| Median Household Income | $86,776 | $591 |
| Monthly Housing Costs | $413 | $532 |
| Real Estate Taxes | $1,593 | $69 |
Property Value by Mortgage Status in Mead Valley
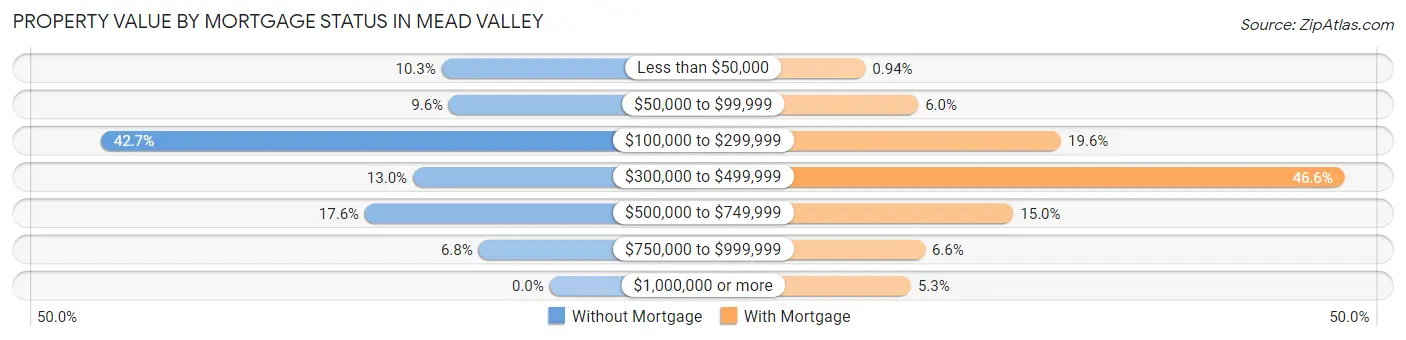
| Property Value | Without Mortgage | With Mortgage |
| Less than $50,000 | 117 (10.3%) | 22 (0.9%) |
| $50,000 to $99,999 | 109 (9.6%) | 139 (6.0%) |
| $100,000 to $299,999 | 486 (42.7%) | 456 (19.6%) |
| $300,000 to $499,999 | 148 (13.0%) | 1,085 (46.6%) |
| $500,000 to $749,999 | 200 (17.6%) | 350 (15.0%) |
| $750,000 to $999,999 | 77 (6.8%) | 154 (6.6%) |
| $1,000,000 or more | 0 (0.0%) | 123 (5.3%) |
| Total | 1,137 (100.0%) | 2,329 (100.0%) |
Household Income by Mortgage Status in Mead Valley
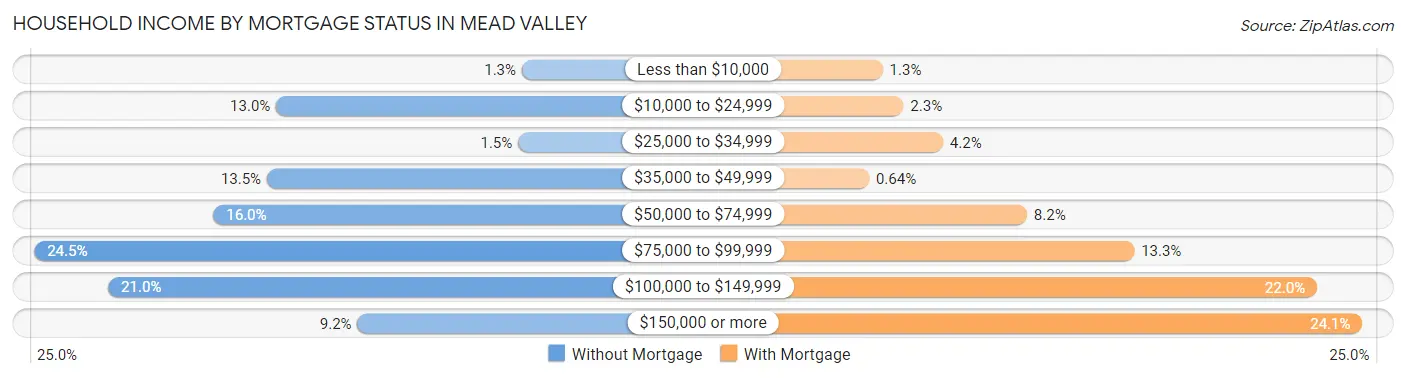
| Household Income | Without Mortgage | With Mortgage |
| Less than $10,000 | 15 (1.3%) | 30 (1.3%) |
| $10,000 to $24,999 | 148 (13.0%) | 53 (2.3%) |
| $25,000 to $34,999 | 17 (1.5%) | 97 (4.2%) |
| $35,000 to $49,999 | 153 (13.5%) | 15 (0.6%) |
| $50,000 to $74,999 | 182 (16.0%) | 190 (8.2%) |
| $75,000 to $99,999 | 279 (24.5%) | 309 (13.3%) |
| $100,000 to $149,999 | 239 (21.0%) | 512 (22.0%) |
| $150,000 or more | 104 (9.1%) | 562 (24.1%) |
| Total | 1,137 (100.0%) | 2,329 (100.0%) |
Property Value to Household Income Ratio in Mead Valley
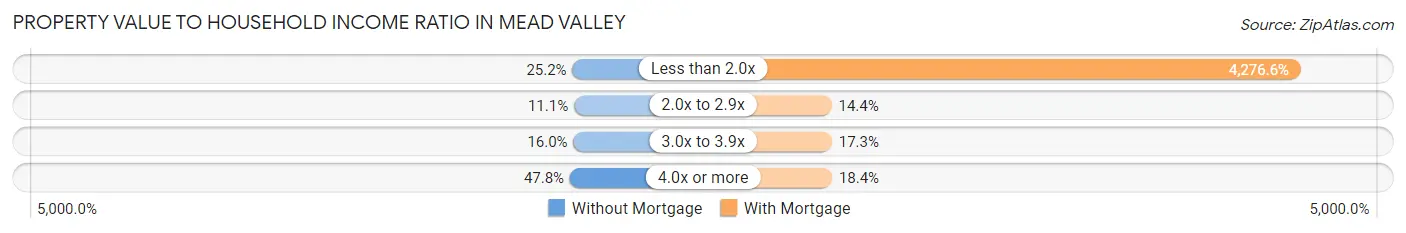
| Value-to-Income Ratio | Without Mortgage | With Mortgage |
| Less than 2.0x | 286 (25.2%) | 99,601 (4,276.6%) |
| 2.0x to 2.9x | 126 (11.1%) | 335 (14.4%) |
| 3.0x to 3.9x | 182 (16.0%) | 402 (17.3%) |
| 4.0x or more | 543 (47.8%) | 428 (18.4%) |
| Total | 1,137 (100.0%) | 2,329 (100.0%) |
Real Estate Taxes by Mortgage Status in Mead Valley
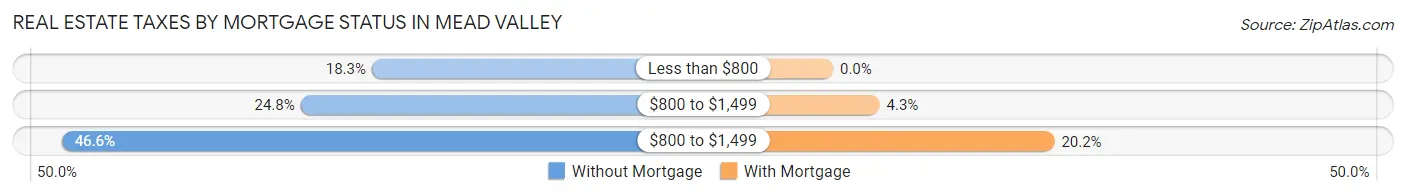
| Property Taxes | Without Mortgage | With Mortgage |
| Less than $800 | 208 (18.3%) | 0 (0.0%) |
| $800 to $1,499 | 282 (24.8%) | 99 (4.3%) |
| $800 to $1,499 | 530 (46.6%) | 471 (20.2%) |
| Total | 1,137 (100.0%) | 2,329 (100.0%) |
Health & Disability in Mead Valley
Health Insurance Coverage by Age in Mead Valley
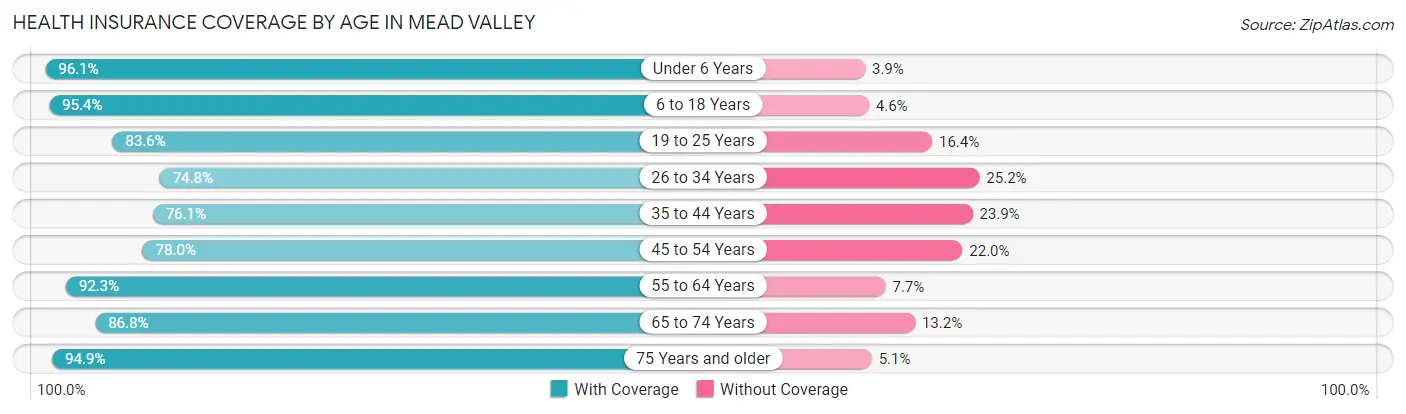
| Age Bracket | With Coverage | Without Coverage |
| Under 6 Years | 1,494 (96.1%) | 60 (3.9%) |
| 6 to 18 Years | 4,067 (95.4%) | 195 (4.6%) |
| 19 to 25 Years | 2,161 (83.6%) | 423 (16.4%) |
| 26 to 34 Years | 1,834 (74.8%) | 618 (25.2%) |
| 35 to 44 Years | 1,987 (76.1%) | 624 (23.9%) |
| 45 to 54 Years | 2,203 (78.0%) | 622 (22.0%) |
| 55 to 64 Years | 2,162 (92.3%) | 180 (7.7%) |
| 65 to 74 Years | 988 (86.8%) | 150 (13.2%) |
| 75 Years and older | 741 (94.9%) | 40 (5.1%) |
| Total | 17,637 (85.8%) | 2,912 (14.2%) |
Health Insurance Coverage by Citizenship Status in Mead Valley
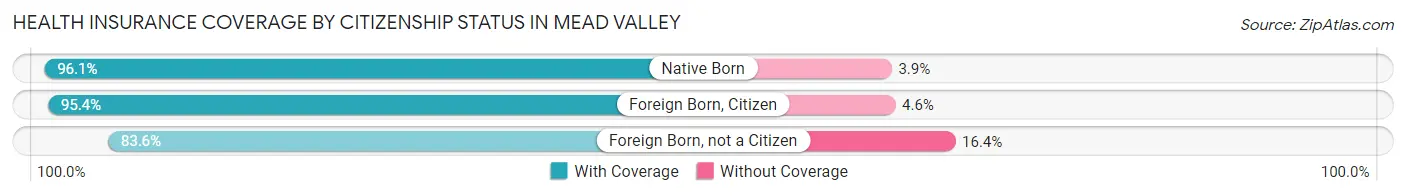
| Citizenship Status | With Coverage | Without Coverage |
| Native Born | 1,494 (96.1%) | 60 (3.9%) |
| Foreign Born, Citizen | 4,067 (95.4%) | 195 (4.6%) |
| Foreign Born, not a Citizen | 2,161 (83.6%) | 423 (16.4%) |
Health Insurance Coverage by Household Income in Mead Valley
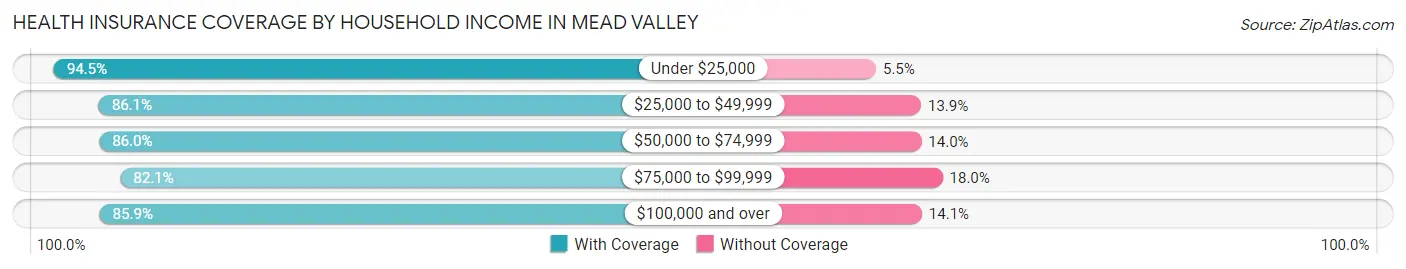
| Household Income | With Coverage | Without Coverage |
| Under $25,000 | 1,449 (94.5%) | 84 (5.5%) |
| $25,000 to $49,999 | 2,550 (86.1%) | 412 (13.9%) |
| $50,000 to $74,999 | 2,670 (86.0%) | 434 (14.0%) |
| $75,000 to $99,999 | 3,387 (82.1%) | 741 (17.9%) |
| $100,000 and over | 7,340 (85.9%) | 1,202 (14.1%) |
Public vs Private Health Insurance Coverage by Age in Mead Valley
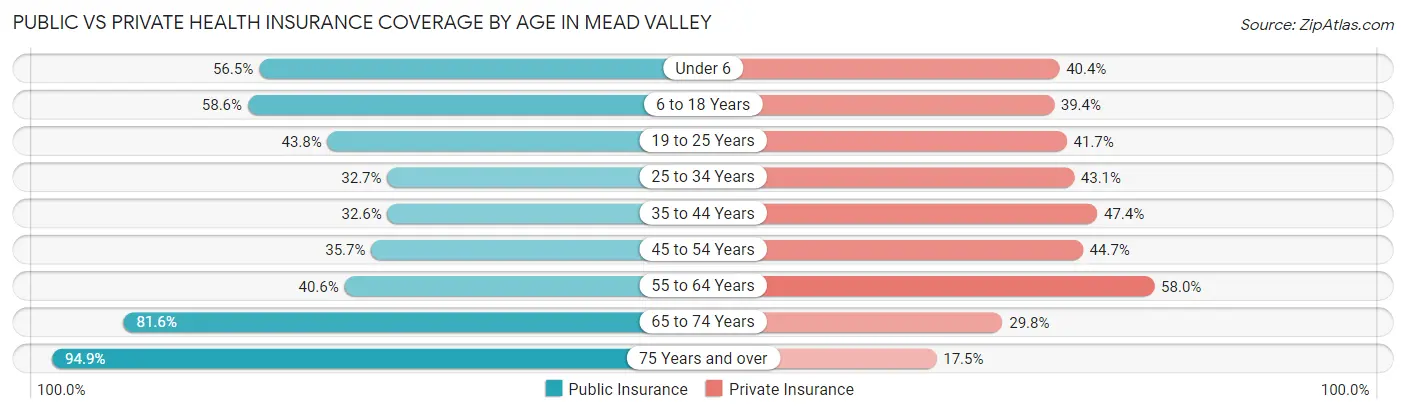
| Age Bracket | Public Insurance | Private Insurance |
| Under 6 | 878 (56.5%) | 627 (40.4%) |
| 6 to 18 Years | 2,496 (58.6%) | 1,677 (39.4%) |
| 19 to 25 Years | 1,131 (43.8%) | 1,078 (41.7%) |
| 25 to 34 Years | 801 (32.7%) | 1,056 (43.1%) |
| 35 to 44 Years | 852 (32.6%) | 1,237 (47.4%) |
| 45 to 54 Years | 1,007 (35.6%) | 1,263 (44.7%) |
| 55 to 64 Years | 951 (40.6%) | 1,358 (58.0%) |
| 65 to 74 Years | 929 (81.6%) | 339 (29.8%) |
| 75 Years and over | 741 (94.9%) | 137 (17.5%) |
| Total | 9,786 (47.6%) | 8,772 (42.7%) |
Disability Status by Sex by Age in Mead Valley
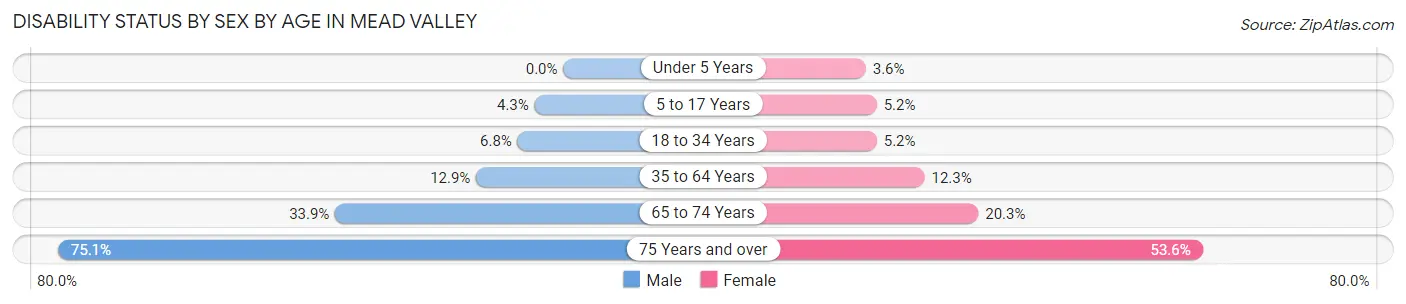
| Age Bracket | Male | Female |
| Under 5 Years | 0 (0.0%) | 25 (3.6%) |
| 5 to 17 Years | 80 (4.3%) | 108 (5.2%) |
| 18 to 34 Years | 179 (6.8%) | 150 (5.2%) |
| 35 to 64 Years | 535 (12.9%) | 448 (12.3%) |
| 65 to 74 Years | 185 (33.9%) | 120 (20.3%) |
| 75 Years and over | 292 (75.1%) | 210 (53.6%) |
Disability Class by Sex by Age in Mead Valley
Disability Class: Hearing Difficulty
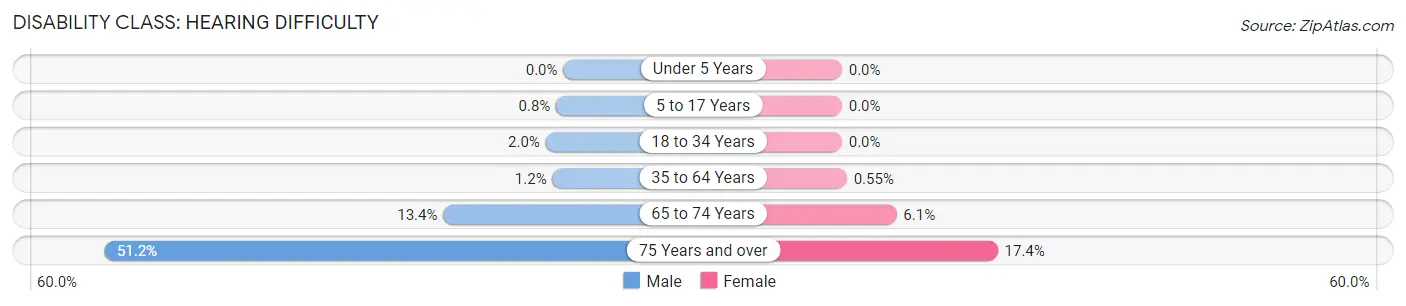
| Age Bracket | Male | Female |
| Under 5 Years | 0 (0.0%) | 0 (0.0%) |
| 5 to 17 Years | 15 (0.8%) | 0 (0.0%) |
| 18 to 34 Years | 52 (2.0%) | 0 (0.0%) |
| 35 to 64 Years | 50 (1.2%) | 20 (0.5%) |
| 65 to 74 Years | 73 (13.4%) | 36 (6.1%) |
| 75 Years and over | 199 (51.2%) | 68 (17.3%) |
Disability Class: Vision Difficulty
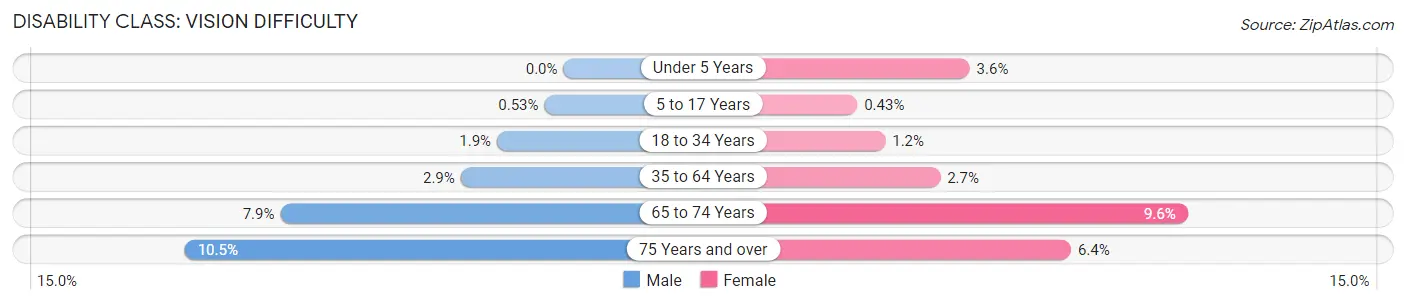
| Age Bracket | Male | Female |
| Under 5 Years | 0 (0.0%) | 25 (3.6%) |
| 5 to 17 Years | 10 (0.5%) | 9 (0.4%) |
| 18 to 34 Years | 49 (1.8%) | 35 (1.2%) |
| 35 to 64 Years | 118 (2.9%) | 100 (2.7%) |
| 65 to 74 Years | 43 (7.9%) | 57 (9.6%) |
| 75 Years and over | 41 (10.5%) | 25 (6.4%) |
Disability Class: Cognitive Difficulty
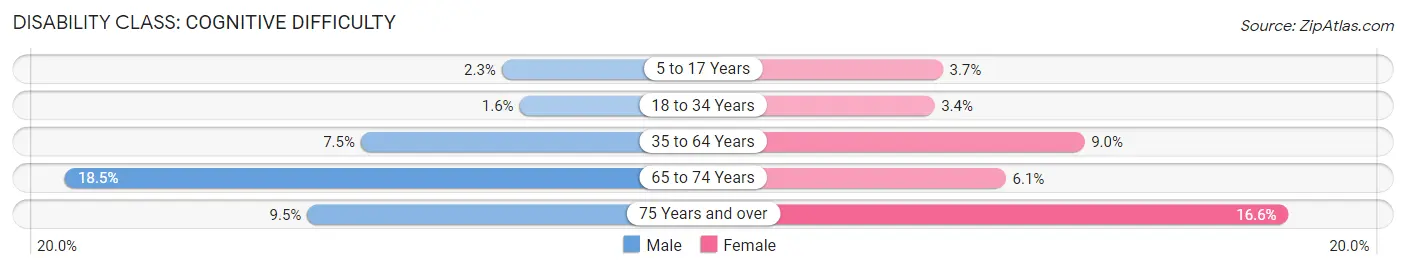
| Age Bracket | Male | Female |
| 5 to 17 Years | 43 (2.3%) | 78 (3.7%) |
| 18 to 34 Years | 43 (1.6%) | 99 (3.4%) |
| 35 to 64 Years | 311 (7.5%) | 328 (9.0%) |
| 65 to 74 Years | 101 (18.5%) | 36 (6.1%) |
| 75 Years and over | 37 (9.5%) | 65 (16.6%) |
Disability Class: Ambulatory Difficulty
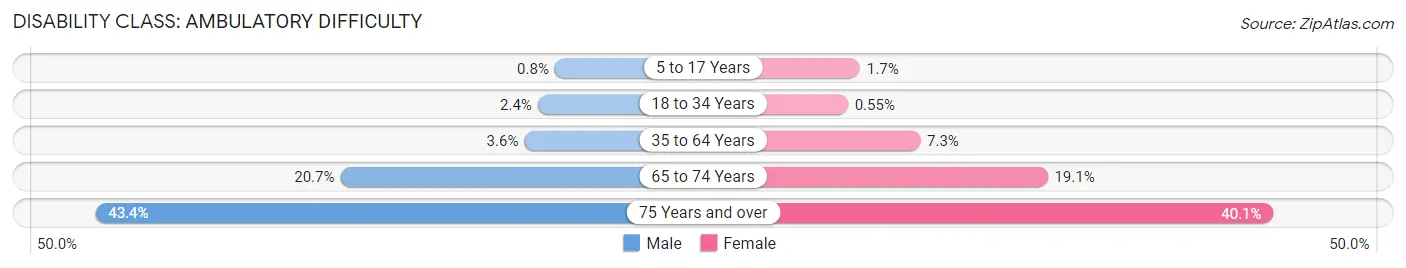
| Age Bracket | Male | Female |
| 5 to 17 Years | 15 (0.8%) | 35 (1.7%) |
| 18 to 34 Years | 63 (2.4%) | 16 (0.5%) |
| 35 to 64 Years | 150 (3.6%) | 265 (7.3%) |
| 65 to 74 Years | 113 (20.7%) | 113 (19.1%) |
| 75 Years and over | 169 (43.4%) | 157 (40.1%) |
Disability Class: Self-Care Difficulty
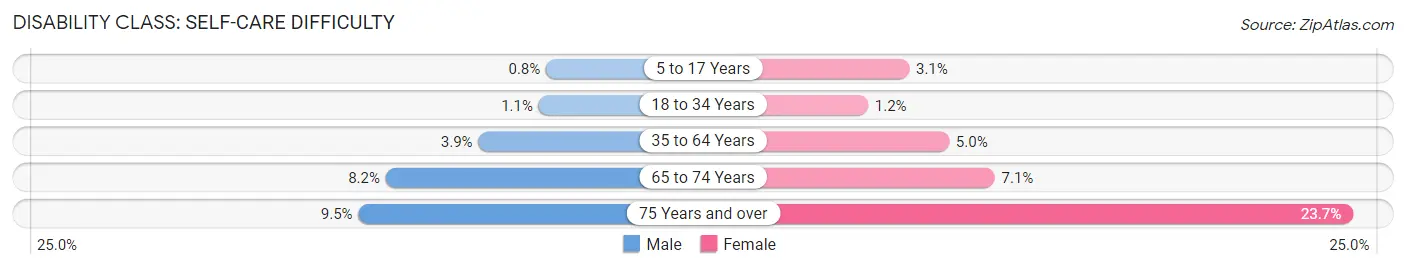
| Age Bracket | Male | Female |
| 5 to 17 Years | 15 (0.8%) | 65 (3.1%) |
| 18 to 34 Years | 30 (1.1%) | 35 (1.2%) |
| 35 to 64 Years | 163 (3.9%) | 181 (5.0%) |
| 65 to 74 Years | 45 (8.2%) | 42 (7.1%) |
| 75 Years and over | 37 (9.5%) | 93 (23.7%) |
Technology Access in Mead Valley
Computing Device Access in Mead Valley
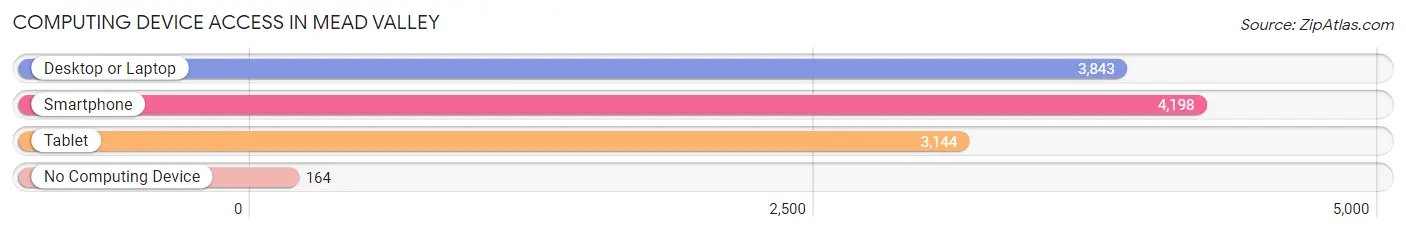
| Device Type | # Households | % Households |
| Desktop or Laptop | 3,843 | 83.9% |
| Smartphone | 4,198 | 91.7% |
| Tablet | 3,144 | 68.6% |
| No Computing Device | 164 | 3.6% |
| Total | 4,580 | 100.0% |
Internet Access in Mead Valley
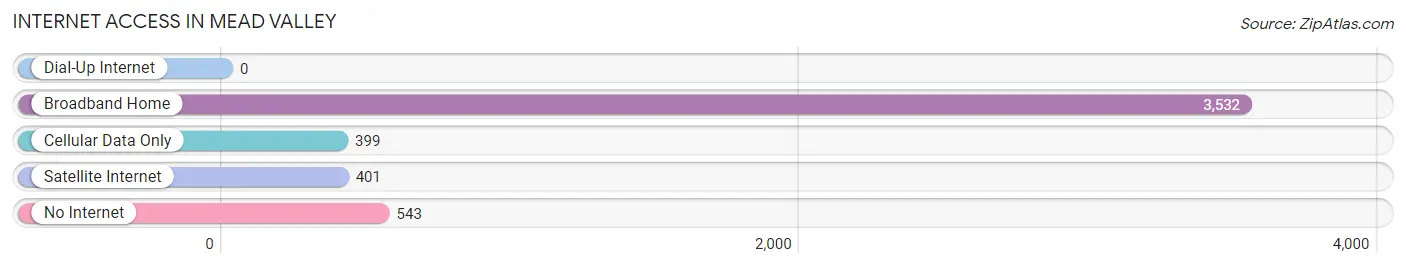
| Internet Type | # Households | % Households |
| Dial-Up Internet | 0 | 0.0% |
| Broadband Home | 3,532 | 77.1% |
| Cellular Data Only | 399 | 8.7% |
| Satellite Internet | 401 | 8.8% |
| No Internet | 543 | 11.9% |
| Total | 4,580 | 100.0% |
Mead Valley Summary
Mead Valley is an unincorporated community located in Riverside County, California. It is situated in the foothills of the San Jacinto Mountains, approximately 25 miles southeast of Riverside. The community is bordered by the cities of Perris, Menifee, and Murrieta. The population of Mead Valley was estimated to be 8,845 in 2019.
History
Mead Valley was originally inhabited by the Cahuilla Indians, who were the first people to settle in the area. The Cahuilla were a peaceful tribe who lived off the land, hunting and gathering food. They were also known for their basket weaving and pottery.
In the late 1800s, settlers began to move into the area and began to farm the land. The area was named after the Mead family, who were among the first settlers. The Mead family owned a large ranch in the area and were instrumental in the development of the community.
In the early 1900s, the area began to grow and develop. The first post office was established in 1910 and the first school was built in 1912. The area continued to grow and by the 1950s, the population had grown to over 1,000 people.
Geography
Mead Valley is located in the foothills of the San Jacinto Mountains in Riverside County, California. It is situated approximately 25 miles southeast of Riverside and is bordered by the cities of Perris, Menifee, and Murrieta. The area is mostly rural, with rolling hills and open spaces. The climate is mild, with temperatures ranging from the mid-50s to the mid-90s.
Economy
Mead Valley is primarily a rural community, with most of the population employed in agriculture and related industries. The area is home to several farms and ranches, as well as a few small businesses. The area is also home to a few wineries and vineyards.
The area is also home to a few manufacturing companies, including a plastics factory and a metal fabrication plant. The area is also home to a few retail stores, including a grocery store and a few restaurants.
Demographics
As of 2019, the population of Mead Valley was estimated to be 8,845. The population is primarily white (77.3%), followed by Hispanic or Latino (14.2%), African American (3.2%), and Asian (2.3%). The median household income is $60,945 and the median age is 37.
Conclusion
Mead Valley is an unincorporated community located in Riverside County, California. It is situated in the foothills of the San Jacinto Mountains, approximately 25 miles southeast of Riverside. The population of Mead Valley was estimated to be 8,845 in 2019. The area is mostly rural, with rolling hills and open spaces. The economy is primarily based on agriculture and related industries, as well as a few manufacturing companies and retail stores. The population is primarily white, followed by Hispanic or Latino, African American, and Asian. The median household income is $60,945 and the median age is 37.
Common Questions
What is Per Capita Income in Mead Valley?
Per Capita income in Mead Valley is $23,700.
What is the Median Family Income in Mead Valley?
Median Family Income in Mead Valley is $85,898.
What is the Median Household income in Mead Valley?
Median Household Income in Mead Valley is $85,600.
What is Income or Wage Gap in Mead Valley?
Income or Wage Gap in Mead Valley is 33.6%.
Women in Mead Valley earn 66.4 cents for every dollar earned by a man.
What is Family Income Deficit in Mead Valley?
Family Income Deficit in Mead Valley is $17,018.
Families that are below poverty line in Mead Valley earn $17,018 less on average than the poverty threshold level.
What is Inequality or Gini Index in Mead Valley?
Inequality or Gini Index in Mead Valley is 0.38.
What is the Total Population of Mead Valley?
Total Population of Mead Valley is 20,581.
What is the Total Male Population of Mead Valley?
Total Male Population of Mead Valley is 10,274.
What is the Total Female Population of Mead Valley?
Total Female Population of Mead Valley is 10,307.
What is the Ratio of Males per 100 Females in Mead Valley?
There are 99.68 Males per 100 Females in Mead Valley.
What is the Ratio of Females per 100 Males in Mead Valley?
There are 100.32 Females per 100 Males in Mead Valley.
What is the Median Population Age in Mead Valley?
Median Population Age in Mead Valley is 32.8 Years.
What is the Average Family Size in Mead Valley
Average Family Size in Mead Valley is 4.7 People.
What is the Average Household Size in Mead Valley
Average Household Size in Mead Valley is 4.4 People.
How Large is the Labor Force in Mead Valley?
There are 9,810 People in the Labor Forcein in Mead Valley.
What is the Percentage of People in the Labor Force in Mead Valley?
61.8% of People are in the Labor Force in Mead Valley.
What is the Unemployment Rate in Mead Valley?
Unemployment Rate in Mead Valley is 6.3%.