Cities with the Highest Percentage of Population with a Degree in Computers and Mathematics in Michigan
RELATED REPORTS & OPTIONS
Computers and Mathematics
Michigan
Compare Cities
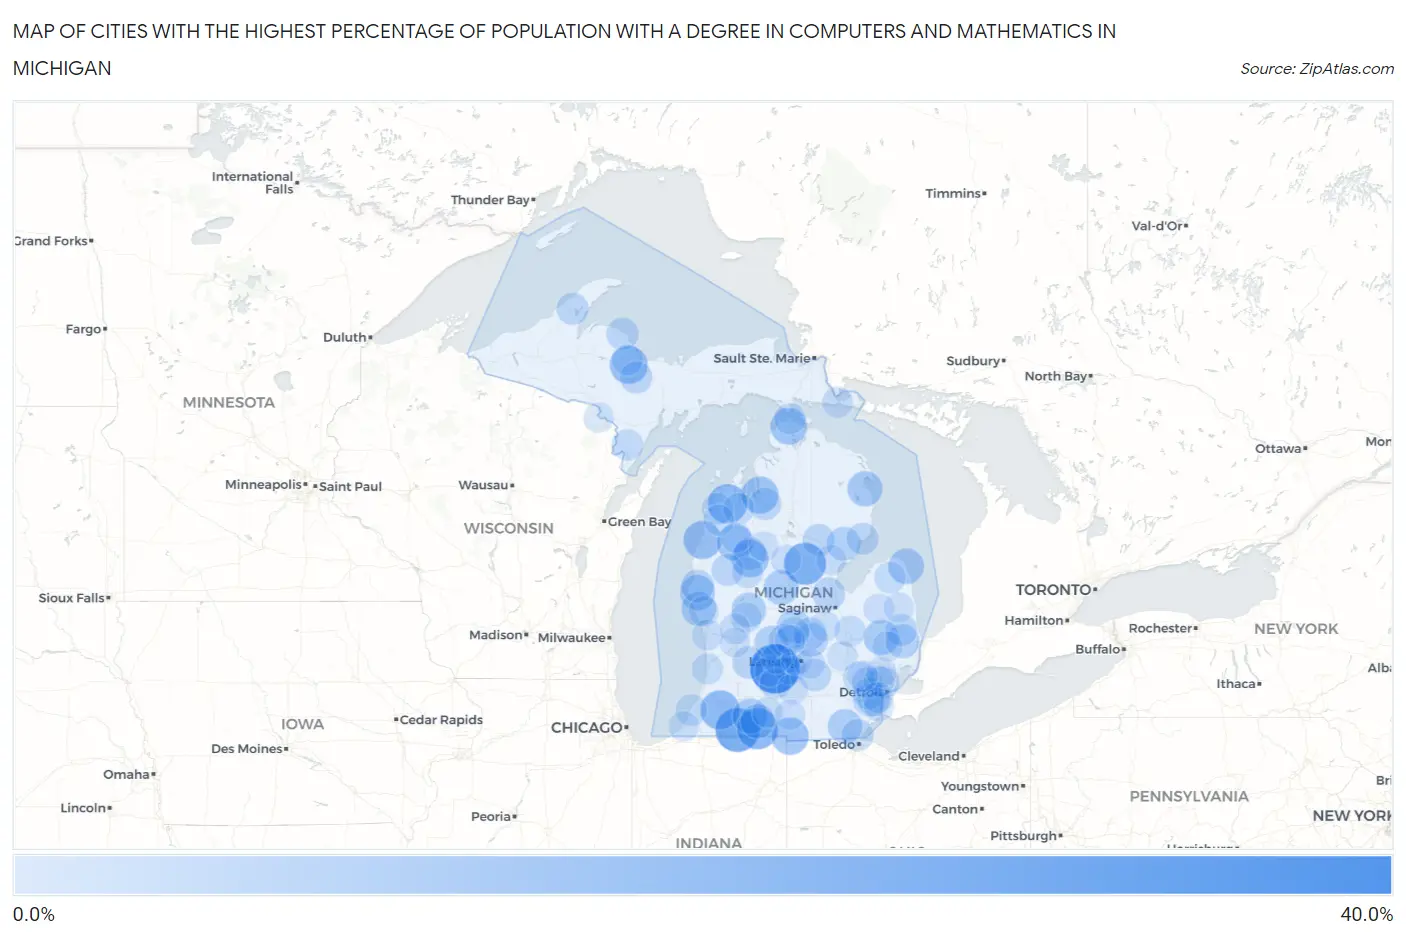
Map of Cities with the Highest Percentage of Population with a Degree in Computers and Mathematics in Michigan
0.0%
40.0%
Cities with the Highest Percentage of Population with a Degree in Computers and Mathematics in Michigan
| City | % Graduates | vs State | vs National | |
| 1. | Vermontville | 34.7% | 4.2%(+30.5)#1 | 4.9%(+29.8)#222 |
| 2. | Eureka | 31.8% | 4.2%(+27.6)#2 | 4.9%(+26.9)#269 |
| 3. | Shaftsburg | 29.7% | 4.2%(+25.5)#3 | 4.9%(+24.8)#293 |
| 4. | Constantine | 26.3% | 4.2%(+22.1)#4 | 4.9%(+21.4)#378 |
| 5. | Gladwin | 23.5% | 4.2%(+19.2)#5 | 4.9%(+18.6)#462 |
| 6. | Trimountain | 23.1% | 4.2%(+18.8)#6 | 4.9%(+18.2)#478 |
| 7. | Burr Oak | 22.2% | 4.2%(+18.0)#7 | 4.9%(+17.3)#503 |
| 8. | Lake Ann | 19.7% | 4.2%(+15.4)#8 | 4.9%(+14.8)#634 |
| 9. | Decatur | 19.5% | 4.2%(+15.3)#9 | 4.9%(+14.6)#642 |
| 10. | Grand Marais | 18.6% | 4.2%(+14.4)#10 | 4.9%(+13.7)#702 |
| 11. | Scotts | 18.5% | 4.2%(+14.3)#11 | 4.9%(+13.6)#713 |
| 12. | Parkdale | 18.0% | 4.2%(+13.8)#12 | 4.9%(+13.1)#746 |
| 13. | Palmer | 17.6% | 4.2%(+13.4)#13 | 4.9%(+12.8)#780 |
| 14. | Camden | 16.7% | 4.2%(+12.4)#14 | 4.9%(+11.8)#855 |
| 15. | Le Roy | 16.7% | 4.2%(+12.4)#15 | 4.9%(+11.8)#862 |
| 16. | Rapid City | 16.4% | 4.2%(+12.2)#16 | 4.9%(+11.6)#885 |
| 17. | Carp Lake | 15.8% | 4.2%(+11.6)#17 | 4.9%(+10.9)#951 |
| 18. | Caberfae | 15.6% | 4.2%(+11.3)#18 | 4.9%(+10.7)#981 |
| 19. | Port Hope | 14.3% | 4.2%(+10.1)#19 | 4.9%(+9.39)#1,125 |
| 20. | Ossineke | 13.9% | 4.2%(+9.63)#20 | 4.9%(+8.97)#1,181 |
| 21. | Mendon | 13.8% | 4.2%(+9.56)#21 | 4.9%(+8.90)#1,188 |
| 22. | Attica | 13.5% | 4.2%(+9.28)#22 | 4.9%(+8.62)#1,235 |
| 23. | Shelby | 13.4% | 4.2%(+9.16)#23 | 4.9%(+8.50)#1,256 |
| 24. | Beal City | 13.3% | 4.2%(+9.10)#24 | 4.9%(+8.44)#1,268 |
| 25. | Whitehall | 13.0% | 4.2%(+8.72)#25 | 4.9%(+8.06)#1,349 |
| 26. | Howard City | 12.7% | 4.2%(+8.50)#26 | 4.9%(+7.83)#1,383 |
| 27. | Colon | 12.6% | 4.2%(+8.41)#27 | 4.9%(+7.74)#1,402 |
| 28. | Deerfield | 12.6% | 4.2%(+8.40)#28 | 4.9%(+7.74)#1,403 |
| 29. | Whittemore | 11.8% | 4.2%(+7.53)#29 | 4.9%(+6.87)#1,574 |
| 30. | Emmett | 11.8% | 4.2%(+7.53)#30 | 4.9%(+6.87)#1,586 |
| 31. | Perrinton | 11.5% | 4.2%(+7.31)#31 | 4.9%(+6.64)#1,637 |
| 32. | Ionia | 11.1% | 4.2%(+6.91)#32 | 4.9%(+6.25)#1,724 |
| 33. | Ovid | 11.0% | 4.2%(+6.76)#33 | 4.9%(+6.10)#1,787 |
| 34. | Paris | 10.6% | 4.2%(+6.36)#34 | 4.9%(+5.69)#1,917 |
| 35. | Hart | 10.5% | 4.2%(+6.26)#35 | 4.9%(+5.60)#1,957 |
| 36. | Elsie | 10.4% | 4.2%(+6.19)#36 | 4.9%(+5.52)#1,973 |
| 37. | Pewamo | 10.3% | 4.2%(+6.11)#37 | 4.9%(+5.45)#2,001 |
| 38. | Tustin | 10.3% | 4.2%(+6.11)#38 | 4.9%(+5.45)#2,008 |
| 39. | Middleville | 10.3% | 4.2%(+6.05)#39 | 4.9%(+5.38)#2,027 |
| 40. | Auburn | 10.2% | 4.2%(+5.94)#40 | 4.9%(+5.28)#2,068 |
| 41. | Kalkaska | 10.1% | 4.2%(+5.84)#41 | 4.9%(+5.18)#2,097 |
| 42. | Big Bay | 10.0% | 4.2%(+5.77)#42 | 4.9%(+5.11)#2,141 |
| 43. | Dansville | 9.7% | 4.2%(+5.45)#43 | 4.9%(+4.78)#2,275 |
| 44. | Romulus | 9.6% | 4.2%(+5.42)#44 | 4.9%(+4.76)#2,295 |
| 45. | Taylor | 9.6% | 4.2%(+5.40)#45 | 4.9%(+4.74)#2,303 |
| 46. | Gwinn | 9.5% | 4.2%(+5.26)#46 | 4.9%(+4.59)#2,380 |
| 47. | Temperance | 9.5% | 4.2%(+5.22)#47 | 4.9%(+4.56)#2,395 |
| 48. | West Branch | 9.4% | 4.2%(+5.19)#48 | 4.9%(+4.53)#2,408 |
| 49. | Baldwin | 9.3% | 4.2%(+5.07)#49 | 4.9%(+4.41)#2,468 |
| 50. | Yale | 9.3% | 4.2%(+5.05)#50 | 4.9%(+4.39)#2,473 |
| 51. | Houghton | 9.3% | 4.2%(+5.04)#51 | 4.9%(+4.37)#2,485 |
| 52. | East Tawas | 9.2% | 4.2%(+4.98)#52 | 4.9%(+4.32)#2,509 |
| 53. | Hazel Park | 8.9% | 4.2%(+4.70)#53 | 4.9%(+4.04)#2,661 |
| 54. | St Joseph | 8.6% | 4.2%(+4.41)#54 | 4.9%(+3.75)#2,823 |
| 55. | Wixom | 8.6% | 4.2%(+4.40)#55 | 4.9%(+3.74)#2,825 |
| 56. | Honor | 8.6% | 4.2%(+4.34)#56 | 4.9%(+3.68)#2,859 |
| 57. | Westland | 8.6% | 4.2%(+4.34)#57 | 4.9%(+3.68)#2,860 |
| 58. | Mackinaw City | 8.5% | 4.2%(+4.25)#58 | 4.9%(+3.59)#2,897 |
| 59. | Maple Rapids | 8.3% | 4.2%(+4.10)#59 | 4.9%(+3.44)#2,979 |
| 60. | Daggett | 8.3% | 4.2%(+4.10)#60 | 4.9%(+3.44)#3,013 |
| 61. | Douglas | 8.1% | 4.2%(+3.91)#61 | 4.9%(+3.25)#3,122 |
| 62. | Chums Corner | 8.1% | 4.2%(+3.91)#62 | 4.9%(+3.25)#3,123 |
| 63. | Reed City | 8.1% | 4.2%(+3.90)#63 | 4.9%(+3.23)#3,130 |
| 64. | Bad Axe | 8.1% | 4.2%(+3.86)#64 | 4.9%(+3.20)#3,155 |
| 65. | Mount Morris | 8.0% | 4.2%(+3.77)#65 | 4.9%(+3.11)#3,202 |
| 66. | Potterville | 7.9% | 4.2%(+3.67)#66 | 4.9%(+3.01)#3,285 |
| 67. | Negaunee | 7.9% | 4.2%(+3.67)#67 | 4.9%(+3.01)#3,286 |
| 68. | Farmington | 7.9% | 4.2%(+3.65)#68 | 4.9%(+2.98)#3,306 |
| 69. | Bellevue | 7.7% | 4.2%(+3.46)#69 | 4.9%(+2.80)#3,439 |
| 70. | De Tour Village | 7.7% | 4.2%(+3.46)#70 | 4.9%(+2.80)#3,465 |
| 71. | Crystal Mountain | 7.7% | 4.2%(+3.46)#71 | 4.9%(+2.80)#3,473 |
| 72. | Sand Lake | 7.5% | 4.2%(+3.27)#72 | 4.9%(+2.61)#3,596 |
| 73. | Union City | 7.5% | 4.2%(+3.26)#73 | 4.9%(+2.59)#3,602 |
| 74. | Nashville | 7.5% | 4.2%(+3.25)#74 | 4.9%(+2.58)#3,609 |
| 75. | Oak Park | 7.5% | 4.2%(+3.24)#75 | 4.9%(+2.58)#3,612 |
| 76. | Allen Park | 7.4% | 4.2%(+3.15)#76 | 4.9%(+2.49)#3,689 |
| 77. | Spring Lake | 7.4% | 4.2%(+3.14)#77 | 4.9%(+2.48)#3,695 |
| 78. | Sparta | 7.3% | 4.2%(+3.03)#78 | 4.9%(+2.37)#3,777 |
| 79. | Troy | 7.2% | 4.2%(+3.00)#79 | 4.9%(+2.34)#3,801 |
| 80. | Walled Lake | 7.2% | 4.2%(+2.97)#80 | 4.9%(+2.31)#3,823 |
| 81. | Springport | 7.1% | 4.2%(+2.91)#81 | 4.9%(+2.25)#3,868 |
| 82. | Kingston | 7.1% | 4.2%(+2.91)#82 | 4.9%(+2.25)#3,892 |
| 83. | Harrietta | 7.1% | 4.2%(+2.91)#83 | 4.9%(+2.25)#3,900 |
| 84. | Waverly | 7.0% | 4.2%(+2.78)#84 | 4.9%(+2.12)#4,018 |
| 85. | Fowler | 7.0% | 4.2%(+2.75)#85 | 4.9%(+2.08)#4,051 |
| 86. | Sterling | 7.0% | 4.2%(+2.75)#86 | 4.9%(+2.08)#4,054 |
| 87. | Shorewood Tower Hills Harbert | 6.9% | 4.2%(+2.68)#87 | 4.9%(+2.02)#4,111 |
| 88. | Okemos | 6.9% | 4.2%(+2.62)#88 | 4.9%(+1.96)#4,174 |
| 89. | Litchfield | 6.8% | 4.2%(+2.62)#89 | 4.9%(+1.96)#4,177 |
| 90. | Harrison | 6.8% | 4.2%(+2.59)#90 | 4.9%(+1.92)#4,194 |
| 91. | Lakewood Club | 6.8% | 4.2%(+2.57)#91 | 4.9%(+1.90)#4,222 |
| 92. | Sandusky | 6.8% | 4.2%(+2.55)#92 | 4.9%(+1.89)#4,235 |
| 93. | Mcbain | 6.8% | 4.2%(+2.55)#93 | 4.9%(+1.89)#4,237 |
| 94. | Almont | 6.8% | 4.2%(+2.52)#94 | 4.9%(+1.86)#4,261 |
| 95. | Trenton | 6.7% | 4.2%(+2.51)#95 | 4.9%(+1.85)#4,277 |
| 96. | Kingsford | 6.7% | 4.2%(+2.49)#96 | 4.9%(+1.82)#4,298 |
| 97. | Argentine | 6.7% | 4.2%(+2.47)#97 | 4.9%(+1.80)#4,315 |
| 98. | Sunfield | 6.7% | 4.2%(+2.44)#98 | 4.9%(+1.77)#4,354 |
| 99. | Chesaning | 6.6% | 4.2%(+2.38)#99 | 4.9%(+1.72)#4,428 |
| 100. | Walker | 6.6% | 4.2%(+2.33)#100 | 4.9%(+1.66)#4,487 |
Common Questions
What are the Top 10 Cities with the Highest Percentage of Population with a Degree in Computers and Mathematics in Michigan?
Top 10 Cities with the Highest Percentage of Population with a Degree in Computers and Mathematics in Michigan are:
#1
34.7%
#2
26.3%
#3
23.5%
#4
22.2%
#5
19.7%
#6
19.5%
#7
18.0%
#8
17.6%
#9
16.7%
#10
16.7%
What city has the Highest Percentage of Population with a Degree in Computers and Mathematics in Michigan?
Vermontville has the Highest Percentage of Population with a Degree in Computers and Mathematics in Michigan with 34.7%.
What is the Percentage of Population with a Degree in Computers and Mathematics in the State of Michigan?
Percentage of Population with a Degree in Computers and Mathematics in Michigan is 4.2%.
What is the Percentage of Population with a Degree in Computers and Mathematics in the United States?
Percentage of Population with a Degree in Computers and Mathematics in the United States is 4.9%.