Cities with the Highest Percentage of Population with a Degree in Computers and Mathematics in North Dakota
RELATED REPORTS & OPTIONS
Computers and Mathematics
North Dakota
Compare Cities
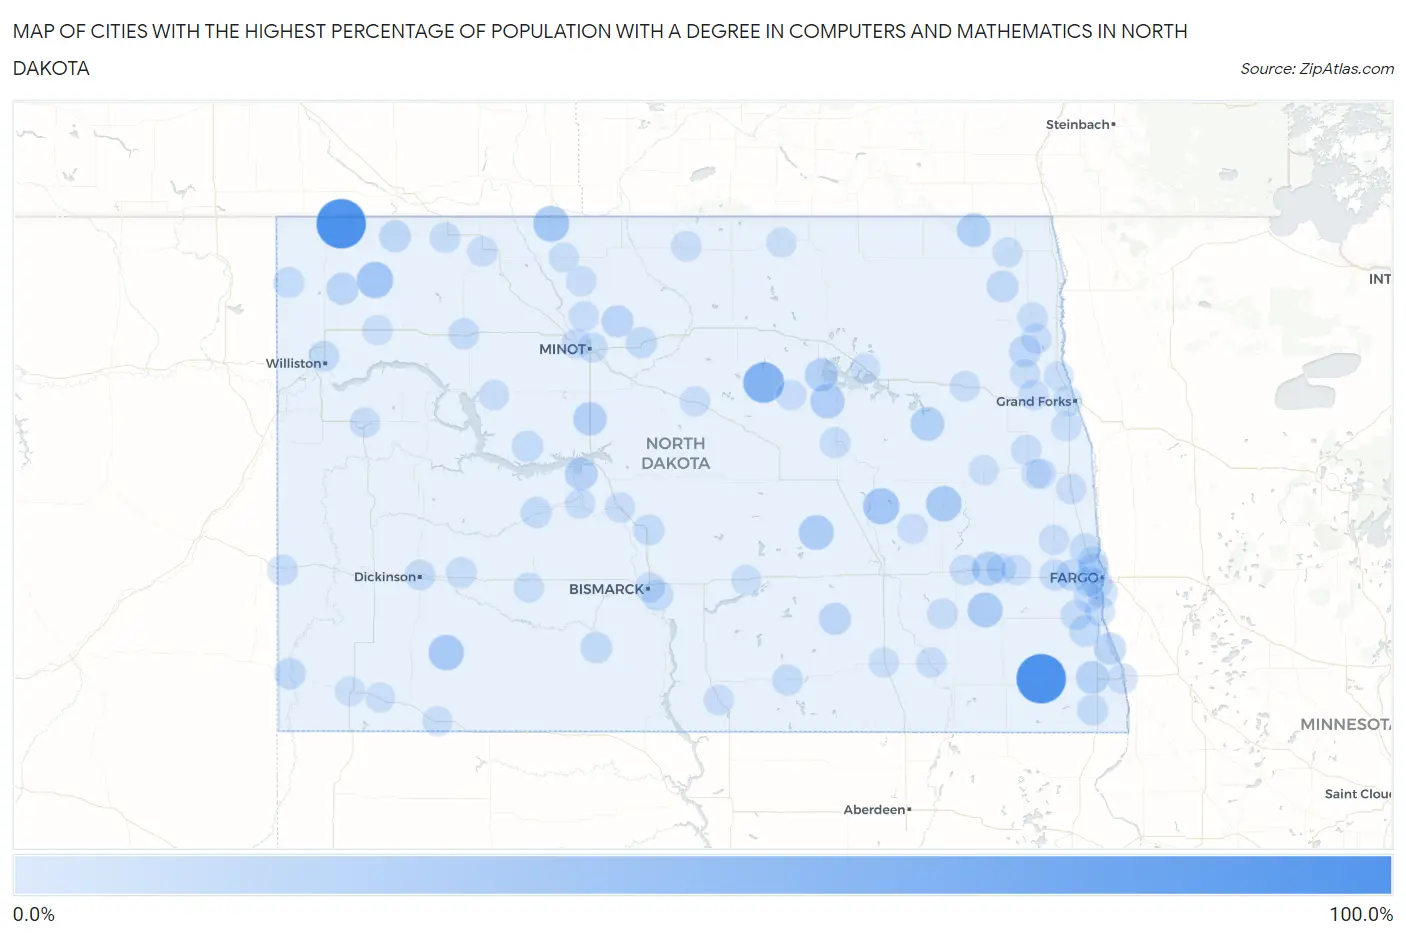
Map of Cities with the Highest Percentage of Population with a Degree in Computers and Mathematics in North Dakota
0.0%
100.0%
Cities with the Highest Percentage of Population with a Degree in Computers and Mathematics in North Dakota
| City | % Graduates | vs State | vs National | |
| 1. | Ambrose | 100.0% | 3.4%(+96.6)#1 | 4.9%(+95.1)#32 |
| 2. | De Lamere | 100.0% | 3.4%(+96.6)#2 | 4.9%(+95.1)#35 |
| 3. | Esmond | 54.5% | 3.4%(+51.2)#3 | 4.9%(+49.7)#87 |
| 4. | Kensal | 32.2% | 3.4%(+28.8)#4 | 4.9%(+27.3)#262 |
| 5. | Wildrose | 32.0% | 3.4%(+28.6)#5 | 4.9%(+27.1)#267 |
| 6. | Sherwood | 30.2% | 3.4%(+26.8)#6 | 4.9%(+25.3)#285 |
| 7. | Regent | 27.6% | 3.4%(+24.2)#7 | 4.9%(+22.7)#342 |
| 8. | Hannaford | 27.3% | 3.4%(+23.9)#8 | 4.9%(+22.4)#351 |
| 9. | Nome | 25.0% | 3.4%(+21.6)#9 | 4.9%(+20.1)#429 |
| 10. | Woodworth | 25.0% | 3.4%(+21.6)#10 | 4.9%(+20.1)#431 |
| 11. | Oberon | 22.2% | 3.4%(+18.8)#11 | 4.9%(+17.3)#517 |
| 12. | Walhalla | 20.0% | 3.4%(+16.6)#12 | 4.9%(+15.1)#593 |
| 13. | Oriska | 20.0% | 3.4%(+16.6)#13 | 4.9%(+15.1)#607 |
| 14. | Pekin | 20.0% | 3.4%(+16.6)#14 | 4.9%(+15.1)#621 |
| 15. | Max | 18.5% | 3.4%(+15.1)#15 | 4.9%(+13.6)#712 |
| 16. | Minnewaukan | 17.0% | 3.4%(+13.6)#16 | 4.9%(+12.1)#836 |
| 17. | Mooreton | 16.7% | 3.4%(+13.3)#17 | 4.9%(+11.8)#869 |
| 18. | Riverdale | 14.3% | 3.4%(+10.9)#18 | 4.9%(+9.39)#1,131 |
| 19. | Abercrombie | 12.5% | 3.4%(+9.12)#19 | 4.9%(+7.61)#1,442 |
| 20. | Alamo | 11.5% | 3.4%(+8.15)#20 | 4.9%(+6.64)#1,643 |
| 21. | Gackle | 11.4% | 3.4%(+7.98)#21 | 4.9%(+6.47)#1,682 |
| 22. | Deering | 11.1% | 3.4%(+7.73)#22 | 4.9%(+6.22)#1,771 |
| 23. | Mapleton | 10.4% | 3.4%(+7.04)#23 | 4.9%(+5.53)#1,972 |
| 24. | Noonan | 10.3% | 3.4%(+6.87)#24 | 4.9%(+5.36)#2,039 |
| 25. | Forest River | 10.0% | 3.4%(+6.62)#25 | 4.9%(+5.11)#2,158 |
| 26. | Crystal | 9.4% | 3.4%(+5.99)#26 | 4.9%(+4.48)#2,440 |
| 27. | Flasher | 9.1% | 3.4%(+5.71)#27 | 4.9%(+4.20)#2,582 |
| 28. | Marmarth | 8.3% | 3.4%(+4.95)#28 | 4.9%(+3.44)#3,017 |
| 29. | Granville | 7.7% | 3.4%(+4.31)#29 | 4.9%(+2.80)#3,460 |
| 30. | White Shield | 7.7% | 3.4%(+4.31)#30 | 4.9%(+2.80)#3,467 |
| 31. | Lincoln | 7.7% | 3.4%(+4.29)#31 | 4.9%(+2.78)#3,483 |
| 32. | Walcott | 7.5% | 3.4%(+4.12)#32 | 4.9%(+2.61)#3,597 |
| 33. | Wishek | 7.4% | 3.4%(+4.00)#33 | 4.9%(+2.49)#3,688 |
| 34. | Argusville | 7.0% | 3.4%(+3.57)#34 | 4.9%(+2.06)#4,078 |
| 35. | Hankinson | 6.9% | 3.4%(+3.56)#35 | 4.9%(+2.05)#4,088 |
| 36. | Reile S Acres | 6.8% | 3.4%(+3.44)#36 | 4.9%(+1.93)#4,190 |
| 37. | Beulah | 6.8% | 3.4%(+3.39)#37 | 4.9%(+1.88)#4,252 |
| 38. | Wilton | 6.4% | 3.4%(+3.04)#38 | 4.9%(+1.53)#4,644 |
| 39. | Grenora | 6.4% | 3.4%(+3.00)#39 | 4.9%(+1.49)#4,703 |
| 40. | Casselton | 6.3% | 3.4%(+2.92)#40 | 4.9%(+1.41)#4,769 |
| 41. | Stanley | 6.1% | 3.4%(+2.69)#41 | 4.9%(+1.18)#5,040 |
| 42. | Williston | 6.1% | 3.4%(+2.69)#42 | 4.9%(+1.18)#5,042 |
| 43. | Kindred | 5.9% | 3.4%(+2.50)#43 | 4.9%(+0.988)#5,296 |
| 44. | Taylor | 5.4% | 3.4%(+1.97)#44 | 4.9%(+0.463)#6,075 |
| 45. | Lignite | 5.3% | 3.4%(+1.88)#45 | 4.9%(+0.369)#6,236 |
| 46. | Beach | 5.0% | 3.4%(+1.59)#46 | 4.9%(+0.081)#6,720 |
| 47. | Dickinson | 5.0% | 3.4%(+1.59)#47 | 4.9%(+0.080)#6,722 |
| 48. | New Rockford | 4.8% | 3.4%(+1.38)#48 | 4.9%(-0.132)#7,119 |
| 49. | Litchville | 4.8% | 3.4%(+1.38)#49 | 4.9%(-0.132)#7,150 |
| 50. | Briarwood | 4.8% | 3.4%(+1.38)#50 | 4.9%(-0.132)#7,153 |
| 51. | Valley City | 4.5% | 3.4%(+1.16)#51 | 4.9%(-0.355)#7,609 |
| 52. | Washburn | 4.4% | 3.4%(+1.01)#52 | 4.9%(-0.498)#7,887 |
| 53. | Minot Afb | 4.4% | 3.4%(+0.981)#53 | 4.9%(-0.530)#7,955 |
| 54. | Fargo | 4.3% | 3.4%(+0.944)#54 | 4.9%(-0.566)#8,036 |
| 55. | Bottineau | 4.2% | 3.4%(+0.804)#55 | 4.9%(-0.707)#8,345 |
| 56. | Minto | 4.2% | 3.4%(+0.783)#56 | 4.9%(-0.727)#8,392 |
| 57. | Lansford | 4.2% | 3.4%(+0.783)#57 | 4.9%(-0.727)#8,407 |
| 58. | Petersburg | 4.2% | 3.4%(+0.783)#58 | 4.9%(-0.727)#8,411 |
| 59. | Maddock | 4.1% | 3.4%(+0.726)#59 | 4.9%(-0.784)#8,520 |
| 60. | Wahpeton | 4.0% | 3.4%(+0.657)#60 | 4.9%(-0.854)#8,664 |
| 61. | West Fargo | 4.0% | 3.4%(+0.613)#61 | 4.9%(-0.898)#8,765 |
| 62. | Grafton | 3.9% | 3.4%(+0.558)#62 | 4.9%(-0.952)#8,881 |
| 63. | Grand Forks Afb | 3.9% | 3.4%(+0.553)#63 | 4.9%(-0.957)#8,902 |
| 64. | Hatton | 3.9% | 3.4%(+0.500)#64 | 4.9%(-1.01)#9,028 |
| 65. | Wimbledon | 3.8% | 3.4%(+0.463)#65 | 4.9%(-1.05)#9,135 |
| 66. | Buffalo | 3.8% | 3.4%(+0.463)#66 | 4.9%(-1.05)#9,136 |
| 67. | Lamoure | 3.8% | 3.4%(+0.414)#67 | 4.9%(-1.10)#9,245 |
| 68. | Bowbells | 3.6% | 3.4%(+0.253)#68 | 4.9%(-1.26)#9,624 |
| 69. | Parshall | 3.6% | 3.4%(+0.240)#69 | 4.9%(-1.27)#9,653 |
| 70. | Arthur | 3.6% | 3.4%(+0.188)#70 | 4.9%(-1.32)#9,775 |
| 71. | Drake | 3.6% | 3.4%(+0.188)#71 | 4.9%(-1.32)#9,777 |
| 72. | Strasburg | 3.5% | 3.4%(+0.125)#72 | 4.9%(-1.39)#9,918 |
| 73. | Hillsboro | 3.5% | 3.4%(+0.099)#73 | 4.9%(-1.41)#9,979 |
| 74. | Oxbow | 3.3% | 3.4%(-0.072)#74 | 4.9%(-1.58)#10,428 |
| 75. | Devils Lake | 3.3% | 3.4%(-0.111)#75 | 4.9%(-1.62)#10,540 |
| 76. | Bismarck | 3.2% | 3.4%(-0.138)#76 | 4.9%(-1.65)#10,596 |
| 77. | Watford City | 3.2% | 3.4%(-0.140)#77 | 4.9%(-1.65)#10,603 |
| 78. | Burlington | 3.0% | 3.4%(-0.398)#78 | 4.9%(-1.91)#11,203 |
| 79. | Glen Ullin | 3.0% | 3.4%(-0.398)#79 | 4.9%(-1.91)#11,207 |
| 80. | Cavalier | 3.0% | 3.4%(-0.413)#80 | 4.9%(-1.92)#11,245 |
| 81. | Minot | 2.9% | 3.4%(-0.463)#81 | 4.9%(-1.97)#11,373 |
| 82. | Stanton | 2.9% | 3.4%(-0.526)#82 | 4.9%(-2.04)#11,522 |
| 83. | Grand Forks | 2.8% | 3.4%(-0.549)#83 | 4.9%(-2.06)#11,593 |
| 84. | Mohall | 2.8% | 3.4%(-0.553)#84 | 4.9%(-2.06)#11,609 |
| 85. | Hettinger | 2.8% | 3.4%(-0.559)#85 | 4.9%(-2.07)#11,621 |
| 86. | Manvel | 2.8% | 3.4%(-0.606)#86 | 4.9%(-2.12)#11,755 |
| 87. | Rolla | 2.7% | 3.4%(-0.717)#87 | 4.9%(-2.23)#11,998 |
| 88. | Horace | 2.6% | 3.4%(-0.807)#88 | 4.9%(-2.32)#12,191 |
| 89. | Finley | 2.5% | 3.4%(-0.852)#89 | 4.9%(-2.36)#12,319 |
| 90. | Scranton | 2.4% | 3.4%(-0.945)#90 | 4.9%(-2.45)#12,553 |
| 91. | Bowman | 2.4% | 3.4%(-0.953)#91 | 4.9%(-2.46)#12,576 |
| 92. | Edgeley | 2.4% | 3.4%(-1.00)#92 | 4.9%(-2.51)#12,684 |
| 93. | Harwood | 2.3% | 3.4%(-1.04)#93 | 4.9%(-2.55)#12,758 |
| 94. | Thompson | 2.3% | 3.4%(-1.08)#94 | 4.9%(-2.59)#12,858 |
| 95. | Ray | 2.3% | 3.4%(-1.08)#95 | 4.9%(-2.60)#12,867 |
| 96. | Gilby | 2.2% | 3.4%(-1.16)#96 | 4.9%(-2.67)#13,046 |
| 97. | Tower City | 2.2% | 3.4%(-1.16)#97 | 4.9%(-2.67)#13,049 |
| 98. | Portland | 2.2% | 3.4%(-1.21)#98 | 4.9%(-2.72)#13,164 |
| 99. | Steele | 2.1% | 3.4%(-1.30)#99 | 4.9%(-2.81)#13,390 |
| 100. | Mayville | 2.0% | 3.4%(-1.42)#100 | 4.9%(-2.93)#13,655 |
Common Questions
What are the Top 10 Cities with the Highest Percentage of Population with a Degree in Computers and Mathematics in North Dakota?
Top 10 Cities with the Highest Percentage of Population with a Degree in Computers and Mathematics in North Dakota are:
What city has the Highest Percentage of Population with a Degree in Computers and Mathematics in North Dakota?
Ambrose has the Highest Percentage of Population with a Degree in Computers and Mathematics in North Dakota with 100.0%.
What is the Percentage of Population with a Degree in Computers and Mathematics in the State of North Dakota?
Percentage of Population with a Degree in Computers and Mathematics in North Dakota is 3.4%.
What is the Percentage of Population with a Degree in Computers and Mathematics in the United States?
Percentage of Population with a Degree in Computers and Mathematics in the United States is 4.9%.