Cities with the Highest Percentage of Population with a Degree in Computers and Mathematics in Maryland
RELATED REPORTS & OPTIONS
Computers and Mathematics
Maryland
Compare Cities
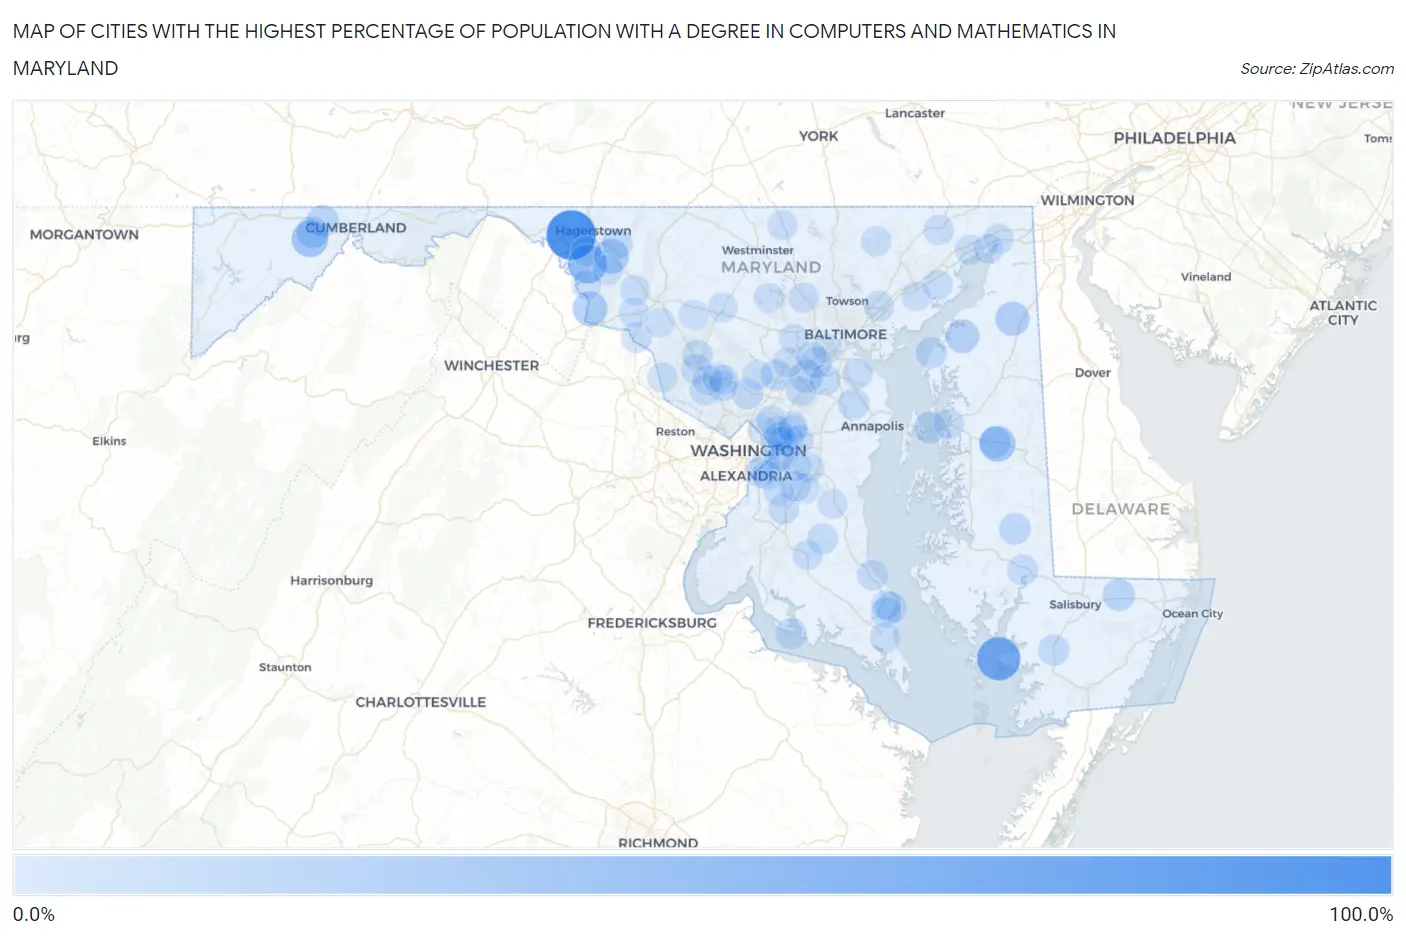
Map of Cities with the Highest Percentage of Population with a Degree in Computers and Mathematics in Maryland
0.0%
100.0%
Cities with the Highest Percentage of Population with a Degree in Computers and Mathematics in Maryland
| City | % Graduates | vs State | vs National | |
| 1. | Chesapeake Landing | 100.0% | 7.0%(+93.0)#1 | 4.9%(+95.1)#7 |
| 2. | Kemps Mill | 100.0% | 7.0%(+93.0)#2 | 4.9%(+95.1)#33 |
| 3. | Chance | 70.0% | 7.0%(+63.0)#3 | 4.9%(+65.1)#55 |
| 4. | Tilghmanton | 50.0% | 7.0%(+43.0)#4 | 4.9%(+45.1)#100 |
| 5. | Klondike | 39.0% | 7.0%(+32.0)#5 | 4.9%(+34.1)#177 |
| 6. | Lewistown | 36.1% | 7.0%(+29.2)#6 | 4.9%(+31.2)#209 |
| 7. | Hillsboro | 35.7% | 7.0%(+28.8)#7 | 4.9%(+30.8)#214 |
| 8. | San Mar | 31.6% | 7.0%(+24.6)#8 | 4.9%(+26.7)#272 |
| 9. | Dargan | 30.2% | 7.0%(+23.2)#9 | 4.9%(+25.3)#286 |
| 10. | Galena | 27.9% | 7.0%(+20.9)#10 | 4.9%(+23.0)#334 |
| 11. | Butlertown | 24.5% | 7.0%(+17.6)#11 | 4.9%(+19.7)#436 |
| 12. | Jessup | 21.5% | 7.0%(+14.5)#12 | 4.9%(+16.6)#543 |
| 13. | Ten Mile Creek | 20.4% | 7.0%(+13.5)#13 | 4.9%(+15.5)#583 |
| 14. | Callaway | 19.9% | 7.0%(+12.9)#14 | 4.9%(+15.0)#626 |
| 15. | Pittsville | 19.7% | 7.0%(+12.8)#15 | 4.9%(+14.9)#632 |
| 16. | Zihlman | 19.7% | 7.0%(+12.7)#16 | 4.9%(+14.8)#635 |
| 17. | Kent Narrows | 19.0% | 7.0%(+12.1)#17 | 4.9%(+14.2)#670 |
| 18. | Midlothian | 18.5% | 7.0%(+11.6)#18 | 4.9%(+13.6)#710 |
| 19. | Hurlock | 16.7% | 7.0%(+9.79)#19 | 4.9%(+11.9)#851 |
| 20. | Queen Anne | 16.7% | 7.0%(+9.72)#20 | 4.9%(+11.8)#866 |
| 21. | Chesapeake Ranch Estates | 16.0% | 7.0%(+9.05)#21 | 4.9%(+11.1)#929 |
| 22. | Tolchester | 16.0% | 7.0%(+9.01)#22 | 4.9%(+11.1)#938 |
| 23. | Princess Anne | 15.0% | 7.0%(+8.08)#23 | 4.9%(+10.1)#1,042 |
| 24. | Fulton | 14.9% | 7.0%(+7.99)#24 | 4.9%(+10.0)#1,050 |
| 25. | Herald Harbor | 14.8% | 7.0%(+7.90)#25 | 4.9%(+9.95)#1,053 |
| 26. | Cobb Island | 14.5% | 7.0%(+7.54)#26 | 4.9%(+9.60)#1,086 |
| 27. | Elkridge | 14.3% | 7.0%(+7.39)#27 | 4.9%(+9.45)#1,104 |
| 28. | Abingdon | 14.1% | 7.0%(+7.13)#28 | 4.9%(+9.18)#1,155 |
| 29. | Drum Point | 13.9% | 7.0%(+6.92)#29 | 4.9%(+8.98)#1,178 |
| 30. | Cheverly | 13.8% | 7.0%(+6.85)#30 | 4.9%(+8.91)#1,186 |
| 31. | Layhill | 13.7% | 7.0%(+6.73)#31 | 4.9%(+8.79)#1,206 |
| 32. | Aquasco | 13.6% | 7.0%(+6.61)#32 | 4.9%(+8.67)#1,228 |
| 33. | Vienna | 13.5% | 7.0%(+6.56)#33 | 4.9%(+8.62)#1,237 |
| 34. | Severn | 13.5% | 7.0%(+6.52)#34 | 4.9%(+8.58)#1,243 |
| 35. | Hillcrest Heights | 13.2% | 7.0%(+6.29)#35 | 4.9%(+8.35)#1,287 |
| 36. | Queenstown | 12.9% | 7.0%(+5.94)#36 | 4.9%(+7.99)#1,360 |
| 37. | St Leonard | 12.8% | 7.0%(+5.87)#37 | 4.9%(+7.93)#1,368 |
| 38. | Point Of Rocks | 12.6% | 7.0%(+5.69)#38 | 4.9%(+7.74)#1,401 |
| 39. | Brandywine | 12.5% | 7.0%(+5.60)#39 | 4.9%(+7.65)#1,415 |
| 40. | Clarksburg | 12.4% | 7.0%(+5.44)#40 | 4.9%(+7.50)#1,460 |
| 41. | North Potomac | 12.3% | 7.0%(+5.33)#41 | 4.9%(+7.39)#1,476 |
| 42. | Mount Aetna | 12.1% | 7.0%(+5.20)#42 | 4.9%(+7.26)#1,496 |
| 43. | Rosaryville | 12.1% | 7.0%(+5.17)#43 | 4.9%(+7.23)#1,503 |
| 44. | Derwood | 11.8% | 7.0%(+4.80)#44 | 4.9%(+6.86)#1,595 |
| 45. | St James | 11.7% | 7.0%(+4.75)#45 | 4.9%(+6.81)#1,604 |
| 46. | Glenarden | 11.4% | 7.0%(+4.44)#46 | 4.9%(+6.50)#1,674 |
| 47. | Brown Station | 11.4% | 7.0%(+4.43)#47 | 4.9%(+6.49)#1,675 |
| 48. | Lexington Park | 11.4% | 7.0%(+4.43)#48 | 4.9%(+6.49)#1,678 |
| 49. | Darlington | 11.3% | 7.0%(+4.36)#49 | 4.9%(+6.42)#1,696 |
| 50. | Boonsboro | 11.3% | 7.0%(+4.34)#50 | 4.9%(+6.40)#1,699 |
| 51. | Germantown | 11.2% | 7.0%(+4.29)#51 | 4.9%(+6.35)#1,705 |
| 52. | Maryland City | 11.1% | 7.0%(+4.14)#52 | 4.9%(+6.19)#1,774 |
| 53. | Glassmanor | 11.0% | 7.0%(+4.09)#53 | 4.9%(+6.15)#1,780 |
| 54. | Capitol Heights | 11.0% | 7.0%(+4.02)#54 | 4.9%(+6.08)#1,790 |
| 55. | Middletown | 10.9% | 7.0%(+3.95)#55 | 4.9%(+6.01)#1,816 |
| 56. | Perryman | 10.9% | 7.0%(+3.93)#56 | 4.9%(+5.99)#1,823 |
| 57. | Romancoke | 10.7% | 7.0%(+3.79)#57 | 4.9%(+5.85)#1,860 |
| 58. | Ashton Sandy Spring | 10.7% | 7.0%(+3.76)#58 | 4.9%(+5.82)#1,866 |
| 59. | Jarrettsville | 10.7% | 7.0%(+3.73)#59 | 4.9%(+5.78)#1,881 |
| 60. | Owings Mills | 10.6% | 7.0%(+3.69)#60 | 4.9%(+5.75)#1,895 |
| 61. | Seabrook | 10.6% | 7.0%(+3.61)#61 | 4.9%(+5.67)#1,926 |
| 62. | Manchester | 10.5% | 7.0%(+3.55)#62 | 4.9%(+5.61)#1,953 |
| 63. | Marlboro Village | 10.5% | 7.0%(+3.52)#63 | 4.9%(+5.58)#1,960 |
| 64. | White Marsh | 10.4% | 7.0%(+3.50)#64 | 4.9%(+5.55)#1,965 |
| 65. | Chillum | 10.4% | 7.0%(+3.48)#65 | 4.9%(+5.54)#1,969 |
| 66. | Flower Hill | 10.4% | 7.0%(+3.48)#66 | 4.9%(+5.54)#1,970 |
| 67. | North East | 10.4% | 7.0%(+3.48)#67 | 4.9%(+5.54)#1,971 |
| 68. | Poolesville | 10.4% | 7.0%(+3.41)#68 | 4.9%(+5.47)#1,994 |
| 69. | Mitchellville | 10.3% | 7.0%(+3.32)#69 | 4.9%(+5.38)#2,029 |
| 70. | Gaithersburg | 10.3% | 7.0%(+3.31)#70 | 4.9%(+5.37)#2,032 |
| 71. | Pasadena | 10.3% | 7.0%(+3.31)#71 | 4.9%(+5.37)#2,033 |
| 72. | Hughesville | 10.2% | 7.0%(+3.27)#72 | 4.9%(+5.33)#2,047 |
| 73. | Washington Grove | 10.2% | 7.0%(+3.27)#73 | 4.9%(+5.33)#2,048 |
| 74. | East Riverdale | 10.2% | 7.0%(+3.25)#74 | 4.9%(+5.30)#2,057 |
| 75. | Walker Mill | 10.1% | 7.0%(+3.20)#75 | 4.9%(+5.25)#2,075 |
| 76. | Redland | 10.1% | 7.0%(+3.13)#76 | 4.9%(+5.18)#2,093 |
| 77. | Eldersburg | 10.1% | 7.0%(+3.13)#77 | 4.9%(+5.18)#2,094 |
| 78. | Dunkirk | 10.0% | 7.0%(+3.06)#78 | 4.9%(+5.12)#2,116 |
| 79. | Marlton | 10.0% | 7.0%(+3.05)#79 | 4.9%(+5.11)#2,118 |
| 80. | Westphalia | 10.0% | 7.0%(+3.03)#80 | 4.9%(+5.09)#2,167 |
| 81. | College Park | 9.9% | 7.0%(+2.94)#81 | 4.9%(+5.00)#2,198 |
| 82. | Arbutus | 9.9% | 7.0%(+2.93)#82 | 4.9%(+4.99)#2,202 |
| 83. | Charlestown | 9.9% | 7.0%(+2.92)#83 | 4.9%(+4.98)#2,206 |
| 84. | Ilchester | 9.9% | 7.0%(+2.90)#84 | 4.9%(+4.96)#2,211 |
| 85. | Temple Hills | 9.7% | 7.0%(+2.80)#85 | 4.9%(+4.86)#2,248 |
| 86. | Clinton | 9.7% | 7.0%(+2.80)#86 | 4.9%(+4.85)#2,249 |
| 87. | Columbia | 9.7% | 7.0%(+2.76)#87 | 4.9%(+4.82)#2,259 |
| 88. | Edgewood | 9.6% | 7.0%(+2.70)#88 | 4.9%(+4.75)#2,297 |
| 89. | Monrovia | 9.6% | 7.0%(+2.65)#89 | 4.9%(+4.71)#2,317 |
| 90. | Perryville | 9.6% | 7.0%(+2.63)#90 | 4.9%(+4.69)#2,321 |
| 91. | Lusby | 9.6% | 7.0%(+2.63)#91 | 4.9%(+4.68)#2,325 |
| 92. | Mount Airy | 9.5% | 7.0%(+2.60)#92 | 4.9%(+4.65)#2,342 |
| 93. | Buckeystown | 9.5% | 7.0%(+2.59)#93 | 4.9%(+4.65)#2,344 |
| 94. | Woodlawn Cdp Baltimore County | 9.5% | 7.0%(+2.58)#94 | 4.9%(+4.63)#2,349 |
| 95. | Landover Hills | 9.5% | 7.0%(+2.51)#95 | 4.9%(+4.57)#2,392 |
| 96. | Jefferson | 9.4% | 7.0%(+2.49)#96 | 4.9%(+4.55)#2,396 |
| 97. | Landover | 9.4% | 7.0%(+2.49)#97 | 4.9%(+4.54)#2,397 |
| 98. | Sharpsburg | 9.4% | 7.0%(+2.46)#98 | 4.9%(+4.52)#2,414 |
| 99. | Ellicott City | 9.4% | 7.0%(+2.43)#99 | 4.9%(+4.49)#2,429 |
| 100. | Lanham | 9.4% | 7.0%(+2.40)#100 | 4.9%(+4.46)#2,448 |
Common Questions
What are the Top 10 Cities with the Highest Percentage of Population with a Degree in Computers and Mathematics in Maryland?
Top 10 Cities with the Highest Percentage of Population with a Degree in Computers and Mathematics in Maryland are:
#1
100.0%
#2
70.0%
#3
50.0%
#4
39.0%
#5
35.7%
#6
31.6%
#7
30.2%
#8
27.9%
#9
24.5%
#10
21.5%
What city has the Highest Percentage of Population with a Degree in Computers and Mathematics in Maryland?
Kemps Mill has the Highest Percentage of Population with a Degree in Computers and Mathematics in Maryland with 100.0%.
What is the Percentage of Population with a Degree in Computers and Mathematics in the State of Maryland?
Percentage of Population with a Degree in Computers and Mathematics in Maryland is 7.0%.
What is the Percentage of Population with a Degree in Computers and Mathematics in the United States?
Percentage of Population with a Degree in Computers and Mathematics in the United States is 4.9%.