Cities with the Highest Percentage of Population with a Degree in Computers and Mathematics in West Virginia
RELATED REPORTS & OPTIONS
Computers and Mathematics
West Virginia
Compare Cities
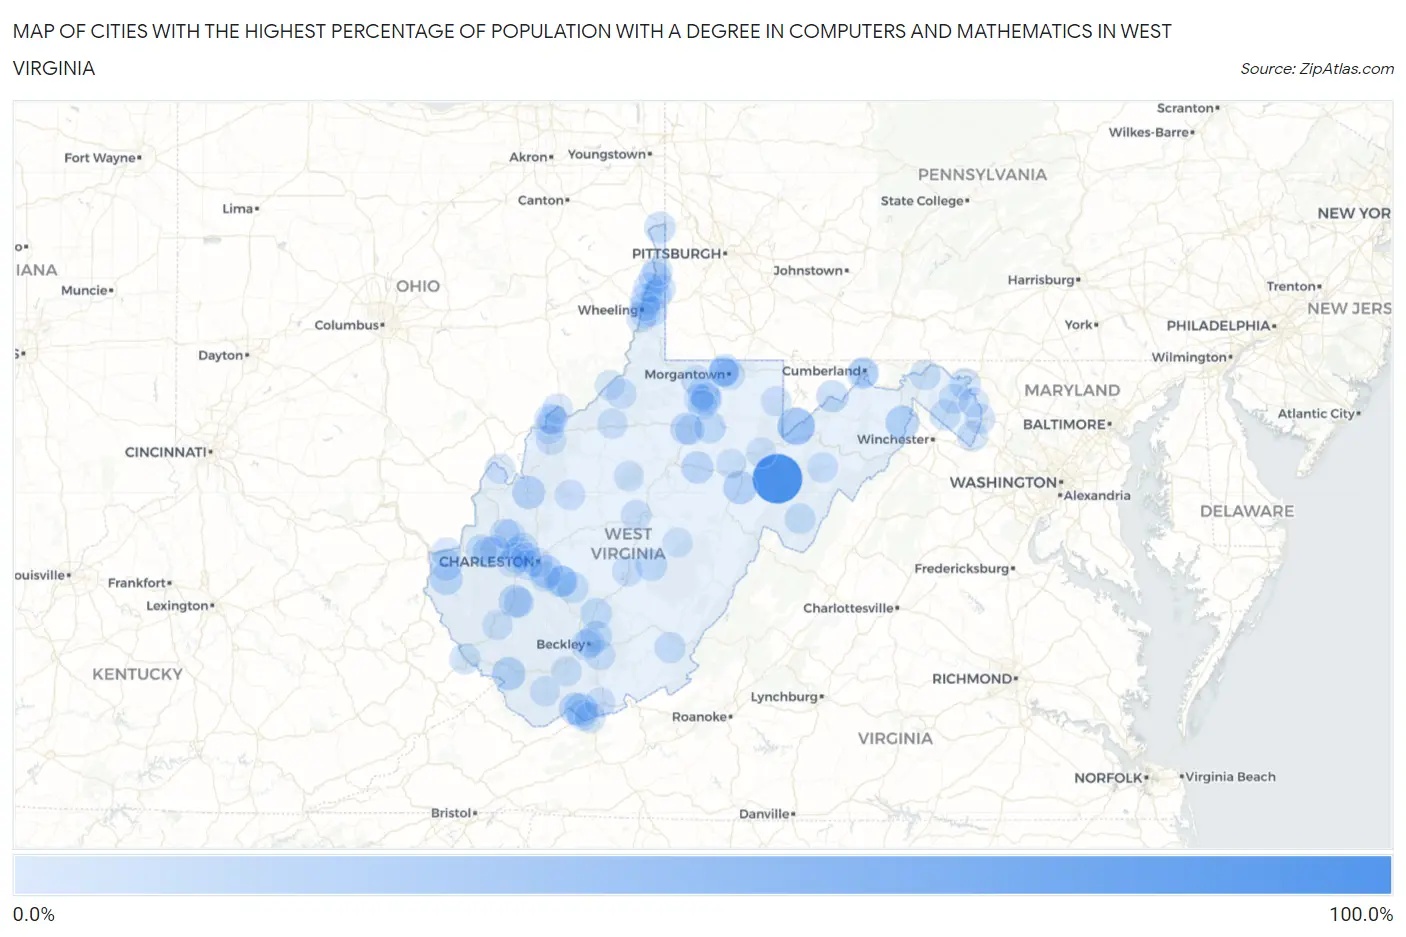
Map of Cities with the Highest Percentage of Population with a Degree in Computers and Mathematics in West Virginia
0.0%
100.0%
Cities with the Highest Percentage of Population with a Degree in Computers and Mathematics in West Virginia
| City | % Graduates | vs State | vs National | |
| 1. | Harman | 100.0% | 3.0%(+97.0)#1 | 4.9%(+95.1)#25 |
| 2. | Bayard | 37.0% | 3.0%(+34.1)#2 | 4.9%(+32.1)#198 |
| 3. | Hansford | 31.6% | 3.0%(+28.6)#3 | 4.9%(+26.7)#274 |
| 4. | Capon Bridge | 19.4% | 3.0%(+16.5)#4 | 4.9%(+14.6)#648 |
| 5. | Beverly | 18.5% | 3.0%(+15.5)#5 | 4.9%(+13.6)#706 |
| 6. | Gilbert Creek | 17.9% | 3.0%(+15.0)#6 | 4.9%(+13.1)#750 |
| 7. | Bluewell | 16.9% | 3.0%(+14.0)#7 | 4.9%(+12.0)#840 |
| 8. | Ripley | 16.5% | 3.0%(+13.6)#8 | 4.9%(+11.6)#881 |
| 9. | Danville | 15.7% | 3.0%(+12.7)#9 | 4.9%(+10.8)#964 |
| 10. | Rand | 14.5% | 3.0%(+11.5)#10 | 4.9%(+9.62)#1,082 |
| 11. | Wayne | 13.6% | 3.0%(+10.7)#11 | 4.9%(+8.74)#1,212 |
| 12. | Buckhannon | 13.3% | 3.0%(+10.3)#12 | 4.9%(+8.40)#1,281 |
| 13. | Wellsburg | 12.0% | 3.0%(+9.01)#13 | 4.9%(+7.10)#1,532 |
| 14. | Bramwell | 11.9% | 3.0%(+8.92)#14 | 4.9%(+7.01)#1,548 |
| 15. | Culloden | 11.6% | 3.0%(+8.57)#15 | 4.9%(+6.66)#1,633 |
| 16. | Piedmont | 11.1% | 3.0%(+8.13)#16 | 4.9%(+6.22)#1,733 |
| 17. | Nutter Fort | 11.0% | 3.0%(+8.00)#17 | 4.9%(+6.09)#1,789 |
| 18. | Cross Lanes | 10.6% | 3.0%(+7.62)#18 | 4.9%(+5.71)#1,911 |
| 19. | Craigsville | 10.4% | 3.0%(+7.45)#19 | 4.9%(+5.54)#1,968 |
| 20. | Lavalette | 10.1% | 3.0%(+7.14)#20 | 4.9%(+5.23)#2,083 |
| 21. | Flemington | 10.0% | 3.0%(+7.02)#21 | 4.9%(+5.11)#2,146 |
| 22. | East Bank | 9.7% | 3.0%(+6.70)#22 | 4.9%(+4.78)#2,274 |
| 23. | Barrackville | 9.2% | 3.0%(+6.20)#23 | 4.9%(+4.29)#2,524 |
| 24. | Montgomery | 9.1% | 3.0%(+6.16)#24 | 4.9%(+4.24)#2,547 |
| 25. | Clearview | 8.6% | 3.0%(+5.61)#25 | 4.9%(+3.69)#2,847 |
| 26. | Falling Waters | 8.6% | 3.0%(+5.57)#26 | 4.9%(+3.66)#2,865 |
| 27. | Oak Hill | 8.4% | 3.0%(+5.41)#27 | 4.9%(+3.50)#2,942 |
| 28. | Chester | 8.2% | 3.0%(+5.24)#28 | 4.9%(+3.33)#3,074 |
| 29. | Star City | 8.2% | 3.0%(+5.22)#29 | 4.9%(+3.31)#3,082 |
| 30. | Piney View | 8.0% | 3.0%(+5.05)#30 | 4.9%(+3.14)#3,192 |
| 31. | Nitro | 7.9% | 3.0%(+4.89)#31 | 4.9%(+2.98)#3,308 |
| 32. | Kanawha | 7.4% | 3.0%(+4.43)#32 | 4.9%(+2.51)#3,667 |
| 33. | Milton | 7.3% | 3.0%(+4.35)#33 | 4.9%(+2.44)#3,722 |
| 34. | Ronceverte | 7.2% | 3.0%(+4.26)#34 | 4.9%(+2.35)#3,789 |
| 35. | Bethany | 7.1% | 3.0%(+4.11)#35 | 4.9%(+2.20)#3,945 |
| 36. | Williamson | 6.7% | 3.0%(+3.76)#36 | 4.9%(+1.84)#4,282 |
| 37. | Brush Fork | 6.4% | 3.0%(+3.44)#37 | 4.9%(+1.52)#4,646 |
| 38. | Carpendale | 6.4% | 3.0%(+3.43)#38 | 4.9%(+1.52)#4,658 |
| 39. | Glasgow | 6.4% | 3.0%(+3.43)#39 | 4.9%(+1.52)#4,662 |
| 40. | Franklin | 6.3% | 3.0%(+3.32)#40 | 4.9%(+1.41)#4,779 |
| 41. | Inwood | 6.0% | 3.0%(+3.06)#41 | 4.9%(+1.15)#5,104 |
| 42. | Shady Spring | 5.8% | 3.0%(+2.82)#42 | 4.9%(+0.911)#5,411 |
| 43. | Mabscott | 5.8% | 3.0%(+2.82)#43 | 4.9%(+0.908)#5,416 |
| 44. | Winfield | 5.7% | 3.0%(+2.74)#44 | 4.9%(+0.828)#5,513 |
| 45. | Pleasant Valley | 5.6% | 3.0%(+2.61)#45 | 4.9%(+0.695)#5,705 |
| 46. | Shannondale | 5.5% | 3.0%(+2.57)#46 | 4.9%(+0.653)#5,787 |
| 47. | Summersville | 5.4% | 3.0%(+2.43)#47 | 4.9%(+0.521)#5,969 |
| 48. | Bath Berkeley Springs | 5.3% | 3.0%(+2.32)#48 | 4.9%(+0.404)#6,152 |
| 49. | Marmet | 5.3% | 3.0%(+2.31)#49 | 4.9%(+0.394)#6,167 |
| 50. | Bluefield | 5.3% | 3.0%(+2.31)#50 | 4.9%(+0.394)#6,168 |
| 51. | Bethlehem | 5.2% | 3.0%(+2.25)#51 | 4.9%(+0.336)#6,291 |
| 52. | Petersburg | 5.1% | 3.0%(+2.13)#52 | 4.9%(+0.217)#6,490 |
| 53. | West Liberty | 5.1% | 3.0%(+2.13)#53 | 4.9%(+0.216)#6,492 |
| 54. | Martinsburg | 4.6% | 3.0%(+1.60)#54 | 4.9%(-0.308)#7,497 |
| 55. | Gassaway | 4.6% | 3.0%(+1.60)#55 | 4.9%(-0.314)#7,503 |
| 56. | Spencer | 4.3% | 3.0%(+1.37)#56 | 4.9%(-0.546)#7,980 |
| 57. | Mineralwells | 4.2% | 3.0%(+1.26)#57 | 4.9%(-0.657)#8,227 |
| 58. | Bolivar | 4.2% | 3.0%(+1.18)#58 | 4.9%(-0.727)#8,376 |
| 59. | Parkersburg | 4.2% | 3.0%(+1.17)#59 | 4.9%(-0.743)#8,427 |
| 60. | Princeton | 3.9% | 3.0%(+0.946)#60 | 4.9%(-0.966)#8,922 |
| 61. | Pennsboro | 3.9% | 3.0%(+0.940)#61 | 4.9%(-0.972)#8,942 |
| 62. | Vienna | 3.9% | 3.0%(+0.920)#62 | 4.9%(-0.992)#8,988 |
| 63. | Mullens | 3.8% | 3.0%(+0.864)#63 | 4.9%(-1.05)#9,101 |
| 64. | Beech Bottom | 3.8% | 3.0%(+0.864)#64 | 4.9%(-1.05)#9,116 |
| 65. | Ridgeley | 3.8% | 3.0%(+0.792)#65 | 4.9%(-1.12)#9,291 |
| 66. | Terra Alta | 3.7% | 3.0%(+0.677)#66 | 4.9%(-1.24)#9,560 |
| 67. | Triadelphia | 3.5% | 3.0%(+0.496)#67 | 4.9%(-1.42)#9,987 |
| 68. | Shepherdstown | 3.4% | 3.0%(+0.434)#68 | 4.9%(-1.48)#10,149 |
| 69. | Williamstown | 3.4% | 3.0%(+0.408)#69 | 4.9%(-1.50)#10,210 |
| 70. | Middlebourne | 3.4% | 3.0%(+0.379)#70 | 4.9%(-1.53)#10,280 |
| 71. | St Albans | 3.3% | 3.0%(+0.364)#71 | 4.9%(-1.55)#10,324 |
| 72. | Fairview | 3.3% | 3.0%(+0.351)#72 | 4.9%(-1.56)#10,382 |
| 73. | Madison | 3.3% | 3.0%(+0.304)#73 | 4.9%(-1.61)#10,497 |
| 74. | Fairmont | 3.3% | 3.0%(+0.303)#74 | 4.9%(-1.61)#10,504 |
| 75. | North Hills | 3.3% | 3.0%(+0.282)#75 | 4.9%(-1.63)#10,553 |
| 76. | Tornado | 3.3% | 3.0%(+0.279)#76 | 4.9%(-1.63)#10,559 |
| 77. | Hurricane | 3.2% | 3.0%(+0.246)#77 | 4.9%(-1.67)#10,641 |
| 78. | Beckley | 3.2% | 3.0%(+0.216)#78 | 4.9%(-1.70)#10,717 |
| 79. | Benwood | 3.2% | 3.0%(+0.210)#79 | 4.9%(-1.70)#10,734 |
| 80. | Welch | 3.2% | 3.0%(+0.171)#80 | 4.9%(-1.74)#10,828 |
| 81. | Glenville | 3.1% | 3.0%(+0.155)#81 | 4.9%(-1.76)#10,852 |
| 82. | Mitchell Heights | 3.1% | 3.0%(+0.079)#82 | 4.9%(-1.83)#11,037 |
| 83. | Huntington | 3.0% | 3.0%(+0.043)#83 | 4.9%(-1.87)#11,127 |
| 84. | Eleanor | 3.0% | 3.0%(+0.003)#84 | 4.9%(-1.91)#11,202 |
| 85. | New Haven | 3.0% | 3.0%(-0.003)#85 | 4.9%(-1.92)#11,226 |
| 86. | South Charleston | 2.9% | 3.0%(-0.064)#86 | 4.9%(-1.98)#11,378 |
| 87. | Morgantown | 2.8% | 3.0%(-0.137)#87 | 4.9%(-2.05)#11,569 |
| 88. | Wheeling | 2.8% | 3.0%(-0.221)#88 | 4.9%(-2.13)#11,786 |
| 89. | Monongah | 2.6% | 3.0%(-0.350)#89 | 4.9%(-2.26)#12,069 |
| 90. | Sistersville | 2.6% | 3.0%(-0.391)#90 | 4.9%(-2.30)#12,159 |
| 91. | Parsons | 2.6% | 3.0%(-0.401)#91 | 4.9%(-2.31)#12,182 |
| 92. | Granville | 2.5% | 3.0%(-0.482)#92 | 4.9%(-2.39)#12,387 |
| 93. | Hooverson Heights | 2.3% | 3.0%(-0.717)#93 | 4.9%(-2.63)#12,938 |
| 94. | Dunbar | 2.2% | 3.0%(-0.735)#94 | 4.9%(-2.65)#12,974 |
| 95. | Addison Webster Springs | 2.2% | 3.0%(-0.784)#95 | 4.9%(-2.70)#13,106 |
| 96. | Charleston | 2.1% | 3.0%(-0.881)#96 | 4.9%(-2.79)#13,348 |
| 97. | Belington | 2.1% | 3.0%(-0.927)#97 | 4.9%(-2.84)#13,463 |
| 98. | Westover | 2.1% | 3.0%(-0.931)#98 | 4.9%(-2.84)#13,471 |
| 99. | Stonewood | 2.0% | 3.0%(-1.01)#99 | 4.9%(-2.92)#13,624 |
| 100. | White Hall | 1.9% | 3.0%(-1.04)#100 | 4.9%(-2.95)#13,710 |
Common Questions
What are the Top 10 Cities with the Highest Percentage of Population with a Degree in Computers and Mathematics in West Virginia?
Top 10 Cities with the Highest Percentage of Population with a Degree in Computers and Mathematics in West Virginia are:
#1
100.0%
#2
37.0%
#3
19.4%
#4
18.5%
#5
17.9%
#6
16.9%
#7
16.5%
#8
15.7%
#9
14.5%
#10
13.6%
What city has the Highest Percentage of Population with a Degree in Computers and Mathematics in West Virginia?
Harman has the Highest Percentage of Population with a Degree in Computers and Mathematics in West Virginia with 100.0%.
What is the Percentage of Population with a Degree in Computers and Mathematics in the State of West Virginia?
Percentage of Population with a Degree in Computers and Mathematics in West Virginia is 3.0%.
What is the Percentage of Population with a Degree in Computers and Mathematics in the United States?
Percentage of Population with a Degree in Computers and Mathematics in the United States is 4.9%.