Cities with the Highest Percentage of Population with a Degree in Computers and Mathematics in Idaho
RELATED REPORTS & OPTIONS
Computers and Mathematics
Idaho
Compare Cities
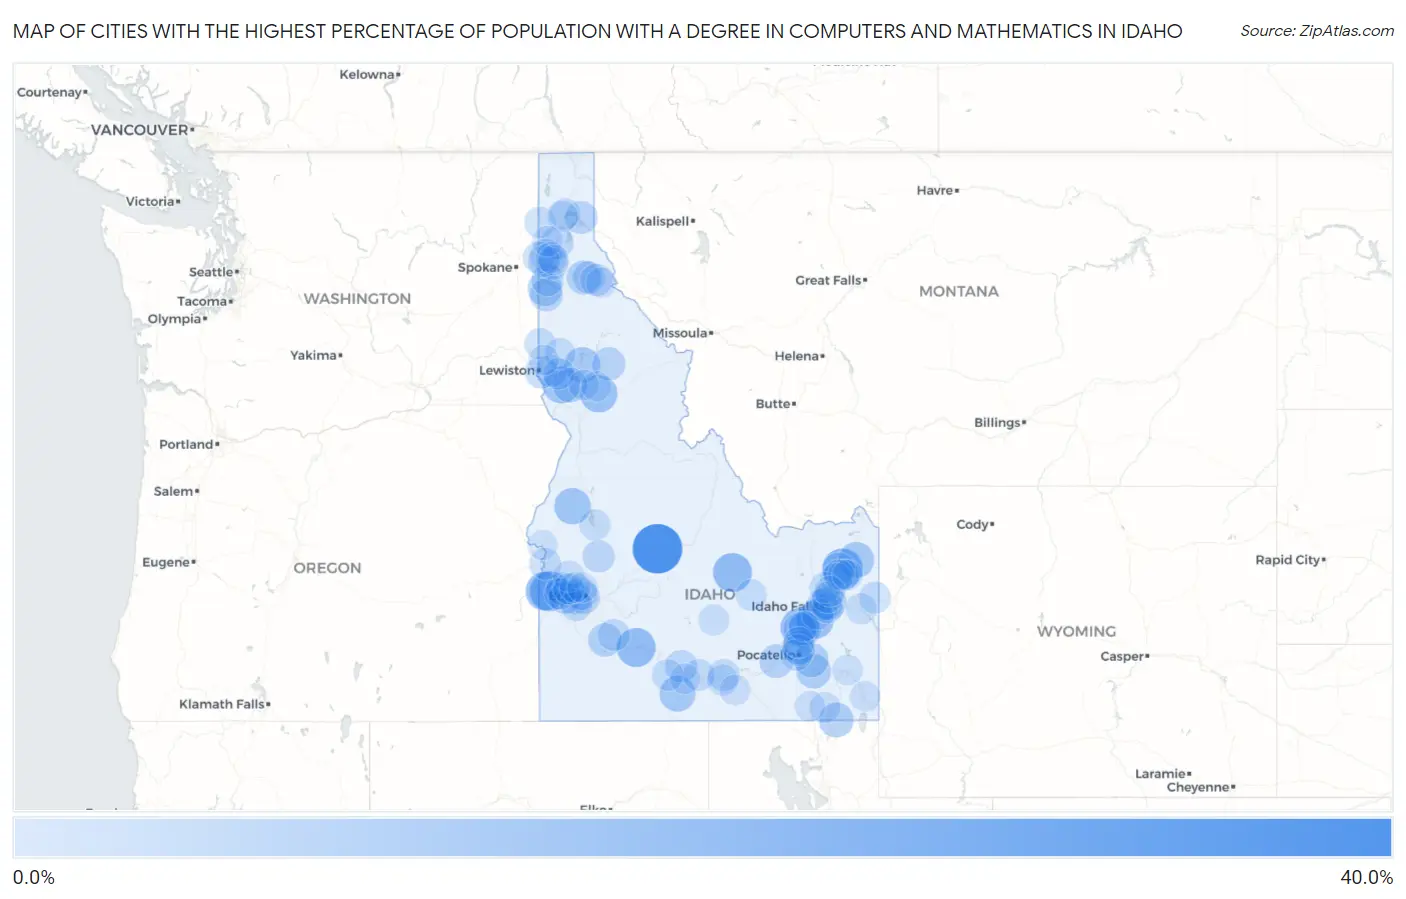
Map of Cities with the Highest Percentage of Population with a Degree in Computers and Mathematics in Idaho
0.0%
40.0%
Cities with the Highest Percentage of Population with a Degree in Computers and Mathematics in Idaho
| City | % Graduates | vs State | vs National | |
| 1. | Stanley | 33.5% | 3.5%(+30.0)#1 | 4.9%(+28.6)#230 |
| 2. | St Anthony | 17.8% | 3.5%(+14.3)#2 | 4.9%(+12.9)#764 |
| 3. | Greenleaf | 16.9% | 3.5%(+13.3)#3 | 4.9%(+12.0)#845 |
| 4. | Mackay | 15.3% | 3.5%(+11.7)#4 | 4.9%(+10.4)#1,009 |
| 5. | Glenns Ferry | 15.0% | 3.5%(+11.5)#5 | 4.9%(+10.2)#1,040 |
| 6. | Moreland | 14.9% | 3.5%(+11.4)#6 | 4.9%(+9.98)#1,052 |
| 7. | Wilder | 14.7% | 3.5%(+11.1)#7 | 4.9%(+9.77)#1,072 |
| 8. | Firth | 13.2% | 3.5%(+9.63)#8 | 4.9%(+8.26)#1,305 |
| 9. | Kooskia | 12.5% | 3.5%(+8.98)#9 | 4.9%(+7.61)#1,430 |
| 10. | Avimor | 12.1% | 3.5%(+8.57)#10 | 4.9%(+7.20)#1,509 |
| 11. | Winchester | 11.8% | 3.5%(+8.24)#11 | 4.9%(+6.87)#1,585 |
| 12. | Council | 11.0% | 3.5%(+7.45)#12 | 4.9%(+6.08)#1,793 |
| 13. | Ashton | 10.0% | 3.5%(+6.48)#13 | 4.9%(+5.11)#2,123 |
| 14. | Hollister | 10.0% | 3.5%(+6.48)#14 | 4.9%(+5.11)#2,144 |
| 15. | Orofino | 9.7% | 3.5%(+6.19)#15 | 4.9%(+4.82)#2,258 |
| 16. | Iona | 8.9% | 3.5%(+5.40)#16 | 4.9%(+4.03)#2,666 |
| 17. | Franklin | 8.3% | 3.5%(+4.81)#17 | 4.9%(+3.44)#2,977 |
| 18. | Craigmont | 8.2% | 3.5%(+4.67)#18 | 4.9%(+3.30)#3,086 |
| 19. | Mccammon | 7.9% | 3.5%(+4.40)#19 | 4.9%(+3.04)#3,268 |
| 20. | Inkom | 7.9% | 3.5%(+4.33)#20 | 4.9%(+2.96)#3,323 |
| 21. | Worley | 7.7% | 3.5%(+4.17)#21 | 4.9%(+2.80)#3,461 |
| 22. | Pinehurst | 7.1% | 3.5%(+3.58)#22 | 4.9%(+2.21)#3,933 |
| 23. | Mountain Home Afb | 6.6% | 3.5%(+3.04)#23 | 4.9%(+1.68)#4,468 |
| 24. | American Falls | 6.3% | 3.5%(+2.80)#24 | 4.9%(+1.43)#4,757 |
| 25. | Tyhee | 6.0% | 3.5%(+2.52)#25 | 4.9%(+1.15)#5,090 |
| 26. | Pierce | 5.8% | 3.5%(+2.24)#26 | 4.9%(+0.875)#5,458 |
| 27. | Blackfoot | 5.6% | 3.5%(+2.03)#27 | 4.9%(+0.665)#5,735 |
| 28. | Meridian | 5.4% | 3.5%(+1.91)#28 | 4.9%(+0.546)#5,940 |
| 29. | Riverside | 5.3% | 3.5%(+1.77)#29 | 4.9%(+0.404)#6,151 |
| 30. | Plummer | 5.3% | 3.5%(+1.74)#30 | 4.9%(+0.369)#6,211 |
| 31. | East Hope | 5.2% | 3.5%(+1.69)#31 | 4.9%(+0.323)#6,315 |
| 32. | Boise City | 4.9% | 3.5%(+1.38)#32 | 4.9%(+0.013)#6,836 |
| 33. | Middleton | 4.8% | 3.5%(+1.30)#33 | 4.9%(-0.068)#7,014 |
| 34. | Nampa | 4.8% | 3.5%(+1.24)#34 | 4.9%(-0.125)#7,108 |
| 35. | Garden City | 4.6% | 3.5%(+1.11)#35 | 4.9%(-0.259)#7,405 |
| 36. | Kellogg | 4.5% | 3.5%(+0.939)#36 | 4.9%(-0.430)#7,742 |
| 37. | Athol | 4.4% | 3.5%(+0.887)#37 | 4.9%(-0.482)#7,854 |
| 38. | Jerome | 4.3% | 3.5%(+0.817)#38 | 4.9%(-0.552)#8,014 |
| 39. | Lewiston | 4.3% | 3.5%(+0.747)#39 | 4.9%(-0.622)#8,164 |
| 40. | Lincoln | 4.2% | 3.5%(+0.694)#40 | 4.9%(-0.675)#8,265 |
| 41. | Rathdrum | 4.2% | 3.5%(+0.688)#41 | 4.9%(-0.681)#8,281 |
| 42. | Rockford Bay | 4.2% | 3.5%(+0.671)#42 | 4.9%(-0.698)#8,332 |
| 43. | Osburn | 4.2% | 3.5%(+0.642)#43 | 4.9%(-0.727)#8,374 |
| 44. | Crouch | 4.2% | 3.5%(+0.642)#44 | 4.9%(-0.727)#8,408 |
| 45. | Parker | 4.1% | 3.5%(+0.557)#45 | 4.9%(-0.812)#8,563 |
| 46. | Kuna | 3.9% | 3.5%(+0.383)#46 | 4.9%(-0.986)#8,976 |
| 47. | Mountain Home | 3.7% | 3.5%(+0.166)#47 | 4.9%(-1.20)#9,489 |
| 48. | Lapwai | 3.7% | 3.5%(+0.152)#48 | 4.9%(-1.22)#9,519 |
| 49. | Fruitland | 3.6% | 3.5%(+0.047)#49 | 4.9%(-1.32)#9,754 |
| 50. | Paul | 3.5% | 3.5%(+0.021)#50 | 4.9%(-1.35)#9,829 |
| 51. | Coeur D Alene | 3.4% | 3.5%(-0.098)#51 | 4.9%(-1.47)#10,126 |
| 52. | Hauser | 3.3% | 3.5%(-0.191)#52 | 4.9%(-1.56)#10,361 |
| 53. | Idaho Falls | 3.3% | 3.5%(-0.201)#53 | 4.9%(-1.57)#10,400 |
| 54. | Shelley | 3.3% | 3.5%(-0.203)#54 | 4.9%(-1.57)#10,403 |
| 55. | Chubbuck | 3.3% | 3.5%(-0.242)#55 | 4.9%(-1.61)#10,510 |
| 56. | Victor | 3.3% | 3.5%(-0.244)#56 | 4.9%(-1.61)#10,517 |
| 57. | Rexburg | 3.3% | 3.5%(-0.263)#57 | 4.9%(-1.63)#10,557 |
| 58. | Eden | 3.2% | 3.5%(-0.299)#58 | 4.9%(-1.67)#10,655 |
| 59. | Post Falls | 3.1% | 3.5%(-0.413)#59 | 4.9%(-1.78)#10,909 |
| 60. | Pocatello | 3.0% | 3.5%(-0.511)#60 | 4.9%(-1.88)#11,144 |
| 61. | Moscow | 3.0% | 3.5%(-0.561)#61 | 4.9%(-1.93)#11,266 |
| 62. | Buhl | 2.9% | 3.5%(-0.577)#62 | 4.9%(-1.95)#11,305 |
| 63. | Kendrick | 2.9% | 3.5%(-0.668)#63 | 4.9%(-2.04)#11,531 |
| 64. | Caldwell | 2.8% | 3.5%(-0.742)#64 | 4.9%(-2.11)#11,724 |
| 65. | Culdesac | 2.8% | 3.5%(-0.747)#65 | 4.9%(-2.12)#11,756 |
| 66. | Oldtown | 2.7% | 3.5%(-0.785)#66 | 4.9%(-2.15)#11,831 |
| 67. | Ammon | 2.7% | 3.5%(-0.861)#67 | 4.9%(-2.23)#12,005 |
| 68. | Cascade | 2.5% | 3.5%(-1.01)#68 | 4.9%(-2.38)#12,356 |
| 69. | Arco | 2.5% | 3.5%(-1.06)#69 | 4.9%(-2.42)#12,463 |
| 70. | Swan Valley | 2.5% | 3.5%(-1.06)#70 | 4.9%(-2.42)#12,465 |
| 71. | Sandpoint | 2.4% | 3.5%(-1.09)#71 | 4.9%(-2.46)#12,567 |
| 72. | Emmett | 2.3% | 3.5%(-1.21)#72 | 4.9%(-2.58)#12,828 |
| 73. | Star | 2.3% | 3.5%(-1.22)#73 | 4.9%(-2.59)#12,864 |
| 74. | Burley | 2.3% | 3.5%(-1.24)#74 | 4.9%(-2.60)#12,885 |
| 75. | Fort Hall | 2.2% | 3.5%(-1.29)#75 | 4.9%(-2.66)#13,000 |
| 76. | Menan | 2.2% | 3.5%(-1.30)#76 | 4.9%(-2.67)#13,040 |
| 77. | Ucon | 2.2% | 3.5%(-1.33)#77 | 4.9%(-2.70)#13,121 |
| 78. | Teton | 2.2% | 3.5%(-1.35)#78 | 4.9%(-2.72)#13,161 |
| 79. | Clifton | 2.1% | 3.5%(-1.42)#79 | 4.9%(-2.79)#13,333 |
| 80. | Dover | 2.0% | 3.5%(-1.50)#80 | 4.9%(-2.87)#13,519 |
| 81. | Hayden | 2.0% | 3.5%(-1.54)#81 | 4.9%(-2.91)#13,603 |
| 82. | Sugar City | 2.0% | 3.5%(-1.54)#82 | 4.9%(-2.91)#13,604 |
| 83. | Rigby | 1.9% | 3.5%(-1.61)#83 | 4.9%(-2.98)#13,770 |
| 84. | Carey | 1.9% | 3.5%(-1.67)#84 | 4.9%(-3.04)#13,904 |
| 85. | Eagle | 1.8% | 3.5%(-1.70)#85 | 4.9%(-3.07)#13,960 |
| 86. | Genesee | 1.6% | 3.5%(-1.90)#86 | 4.9%(-3.27)#14,415 |
| 87. | Spirit Lake | 1.5% | 3.5%(-1.99)#87 | 4.9%(-3.36)#14,585 |
| 88. | Albion | 1.5% | 3.5%(-1.99)#88 | 4.9%(-3.36)#14,593 |
| 89. | Soda Springs | 1.4% | 3.5%(-2.10)#89 | 4.9%(-3.47)#14,794 |
| 90. | Malad City | 1.3% | 3.5%(-2.18)#90 | 4.9%(-3.55)#14,967 |
| 91. | Twin Falls | 1.3% | 3.5%(-2.20)#91 | 4.9%(-3.57)#15,019 |
| 92. | Nezperce | 1.3% | 3.5%(-2.21)#92 | 4.9%(-3.58)#15,033 |
| 93. | Groveland | 1.3% | 3.5%(-2.25)#93 | 4.9%(-3.62)#15,119 |
| 94. | Montpelier | 1.1% | 3.5%(-2.38)#94 | 4.9%(-3.75)#15,313 |
| 95. | Wallace | 1.1% | 3.5%(-2.45)#95 | 4.9%(-3.82)#15,434 |
| 96. | Newdale | 0.98% | 3.5%(-2.54)#96 | 4.9%(-3.91)#15,581 |
| 97. | Hidden Springs | 0.96% | 3.5%(-2.56)#97 | 4.9%(-3.93)#15,612 |
| 98. | Dalton Gardens | 0.91% | 3.5%(-2.61)#98 | 4.9%(-3.98)#15,664 |
| 99. | Weiser | 0.87% | 3.5%(-2.65)#99 | 4.9%(-4.02)#15,708 |
| 100. | Kamiah | 0.75% | 3.5%(-2.77)#100 | 4.9%(-4.14)#15,867 |
Common Questions
What are the Top 10 Cities with the Highest Percentage of Population with a Degree in Computers and Mathematics in Idaho?
Top 10 Cities with the Highest Percentage of Population with a Degree in Computers and Mathematics in Idaho are:
#1
33.5%
#2
17.8%
#3
16.9%
#4
15.3%
#5
15.0%
#6
14.9%
#7
14.7%
#8
13.2%
#9
12.5%
#10
11.8%
What city has the Highest Percentage of Population with a Degree in Computers and Mathematics in Idaho?
Stanley has the Highest Percentage of Population with a Degree in Computers and Mathematics in Idaho with 33.5%.
What is the Percentage of Population with a Degree in Computers and Mathematics in the State of Idaho?
Percentage of Population with a Degree in Computers and Mathematics in Idaho is 3.5%.
What is the Percentage of Population with a Degree in Computers and Mathematics in the United States?
Percentage of Population with a Degree in Computers and Mathematics in the United States is 4.9%.