Cities with the Highest Percentage of Population with a Degree in Computers and Mathematics in Nevada
RELATED REPORTS & OPTIONS
Computers and Mathematics
Nevada
Compare Cities
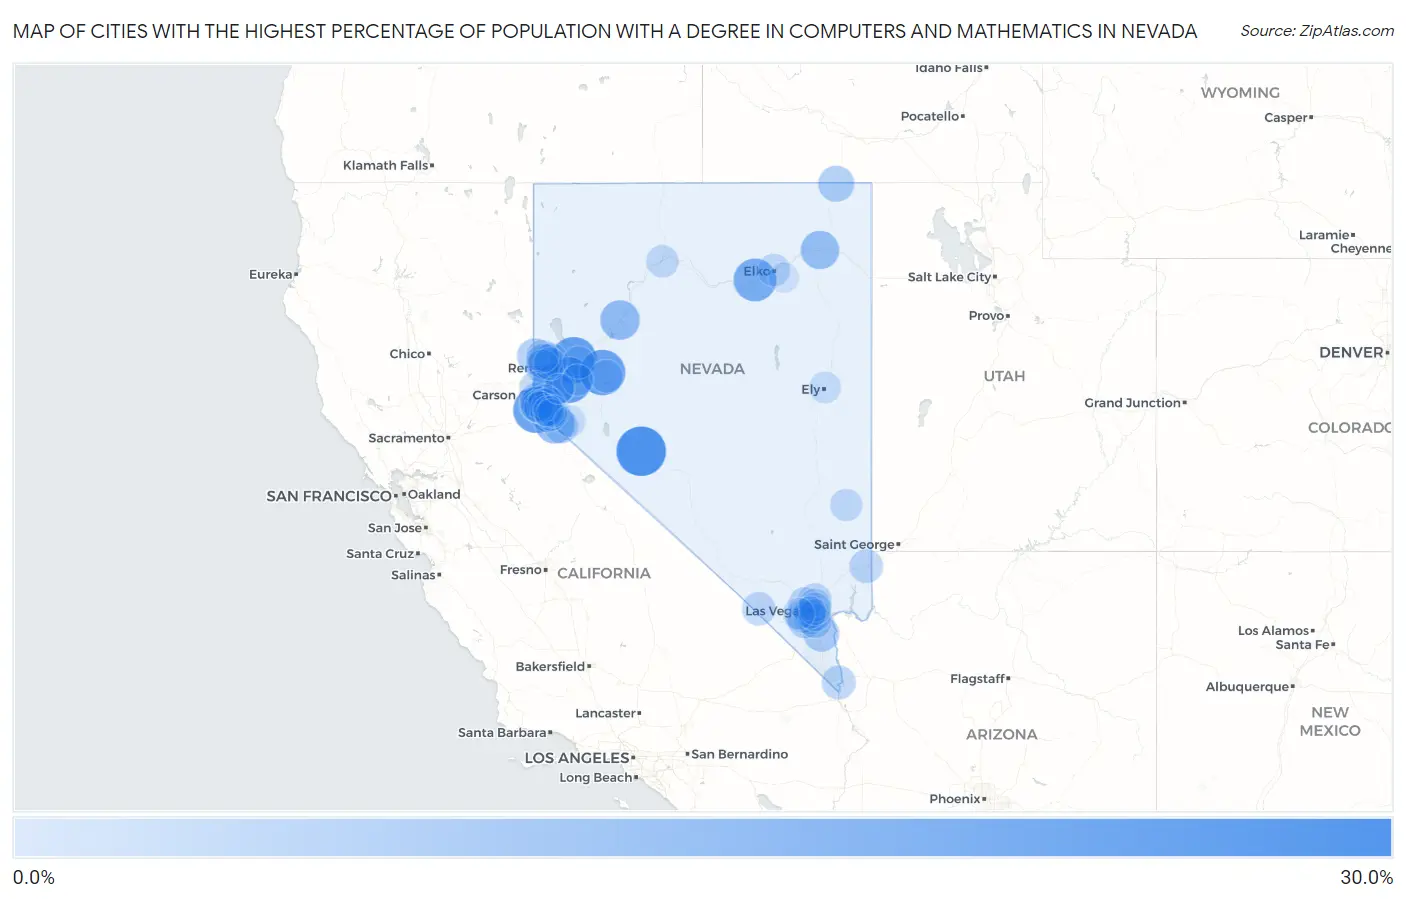
Map of Cities with the Highest Percentage of Population with a Degree in Computers and Mathematics in Nevada
0.0%
30.0%
Cities with the Highest Percentage of Population with a Degree in Computers and Mathematics in Nevada
| City | % Graduates | vs State | vs National | |
| 1. | Mina | 26.5% | 4.2%(+22.3)#1 | 4.9%(+21.6)#372 |
| 2. | Wadsworth | 21.7% | 4.2%(+17.5)#2 | 4.9%(+16.8)#533 |
| 3. | Stateline | 21.6% | 4.2%(+17.4)#3 | 4.9%(+16.7)#537 |
| 4. | Stagecoach | 21.6% | 4.2%(+17.3)#4 | 4.9%(+16.7)#540 |
| 5. | Fallon | 21.0% | 4.2%(+16.7)#5 | 4.9%(+16.1)#562 |
| 6. | Carlin | 17.1% | 4.2%(+12.9)#6 | 4.9%(+12.2)#815 |
| 7. | Virginia City | 16.3% | 4.2%(+12.1)#7 | 4.9%(+11.4)#902 |
| 8. | Double Spring | 12.5% | 4.2%(+8.29)#8 | 4.9%(+7.61)#1,441 |
| 9. | Lovelock | 12.3% | 4.2%(+8.13)#9 | 4.9%(+7.45)#1,468 |
| 10. | Wells | 11.1% | 4.2%(+6.90)#10 | 4.9%(+6.22)#1,732 |
| 11. | Jackpot | 7.7% | 4.2%(+3.48)#11 | 4.9%(+2.80)#3,441 |
| 12. | Cold Springs | 7.4% | 4.2%(+3.23)#12 | 4.9%(+2.55)#3,633 |
| 13. | Boulder City | 7.4% | 4.2%(+3.23)#13 | 4.9%(+2.54)#3,635 |
| 14. | Skyland | 6.7% | 4.2%(+2.54)#14 | 4.9%(+1.85)#4,264 |
| 15. | Sun Valley | 6.7% | 4.2%(+2.50)#15 | 4.9%(+1.82)#4,303 |
| 16. | Glenbrook | 6.6% | 4.2%(+2.36)#16 | 4.9%(+1.68)#4,471 |
| 17. | Golden Valley | 6.4% | 4.2%(+2.21)#17 | 4.9%(+1.52)#4,649 |
| 18. | Lakeridge | 6.3% | 4.2%(+2.09)#18 | 4.9%(+1.40)#4,785 |
| 19. | Gardnerville Ranchos | 5.7% | 4.2%(+1.45)#19 | 4.9%(+0.764)#5,594 |
| 20. | Topaz Ranch Estates | 5.3% | 4.2%(+1.06)#20 | 4.9%(+0.369)#6,207 |
| 21. | Enterprise | 5.2% | 4.2%(+1.03)#21 | 4.9%(+0.339)#6,282 |
| 22. | Laughlin | 5.0% | 4.2%(+0.788)#22 | 4.9%(+0.102)#6,700 |
| 23. | Paradise | 4.9% | 4.2%(+0.730)#23 | 4.9%(+0.044)#6,779 |
| 24. | East Valley | 4.8% | 4.2%(+0.593)#24 | 4.9%(-0.093)#7,063 |
| 25. | Spanish Springs | 4.7% | 4.2%(+0.541)#25 | 4.9%(-0.145)#7,170 |
| 26. | Mesquite | 4.5% | 4.2%(+0.261)#26 | 4.9%(-0.425)#7,728 |
| 27. | Spring Valley | 4.4% | 4.2%(+0.230)#27 | 4.9%(-0.456)#7,800 |
| 28. | Henderson | 4.4% | 4.2%(+0.226)#28 | 4.9%(-0.460)#7,807 |
| 29. | Reno | 4.4% | 4.2%(+0.178)#29 | 4.9%(-0.508)#7,907 |
| 30. | Pahrump | 4.4% | 4.2%(+0.155)#30 | 4.9%(-0.531)#7,957 |
| 31. | North Las Vegas | 4.3% | 4.2%(+0.077)#31 | 4.9%(-0.609)#8,140 |
| 32. | Las Vegas | 4.2% | 4.2%(-0.046)#32 | 4.9%(-0.732)#8,414 |
| 33. | Incline Village | 4.0% | 4.2%(-0.172)#33 | 4.9%(-0.858)#8,678 |
| 34. | Indian Hills | 3.9% | 4.2%(-0.277)#34 | 4.9%(-0.963)#8,914 |
| 35. | Fallon Station | 3.6% | 4.2%(-0.636)#35 | 4.9%(-1.32)#9,759 |
| 36. | Sparks | 3.4% | 4.2%(-0.847)#36 | 4.9%(-1.53)#10,285 |
| 37. | Nellis Afb | 3.4% | 4.2%(-0.851)#37 | 4.9%(-1.54)#10,295 |
| 38. | Lemmon Valley | 3.3% | 4.2%(-0.890)#38 | 4.9%(-1.58)#10,408 |
| 39. | Johnson Lane | 3.3% | 4.2%(-0.926)#39 | 4.9%(-1.61)#10,514 |
| 40. | Carson | 3.2% | 4.2%(-0.991)#40 | 4.9%(-1.68)#10,673 |
| 41. | Genoa | 3.2% | 4.2%(-1.00)#41 | 4.9%(-1.69)#10,700 |
| 42. | Whitney | 3.1% | 4.2%(-1.13)#42 | 4.9%(-1.82)#10,995 |
| 43. | Winnemucca | 3.0% | 4.2%(-1.16)#43 | 4.9%(-1.85)#11,067 |
| 44. | Elko | 3.0% | 4.2%(-1.17)#44 | 4.9%(-1.85)#11,082 |
| 45. | Sunrise Manor | 3.0% | 4.2%(-1.19)#45 | 4.9%(-1.88)#11,140 |
| 46. | Winchester | 2.9% | 4.2%(-1.26)#46 | 4.9%(-1.95)#11,306 |
| 47. | Fernley | 2.9% | 4.2%(-1.29)#47 | 4.9%(-1.97)#11,371 |
| 48. | Caliente | 2.8% | 4.2%(-1.45)#48 | 4.9%(-2.14)#11,790 |
| 49. | Minden | 2.6% | 4.2%(-1.63)#49 | 4.9%(-2.32)#12,194 |
| 50. | Zephyr Cove | 2.4% | 4.2%(-1.78)#50 | 4.9%(-2.47)#12,596 |
| 51. | Summerlin South | 2.4% | 4.2%(-1.81)#51 | 4.9%(-2.49)#12,646 |
| 52. | Kingsbury | 2.3% | 4.2%(-1.90)#52 | 4.9%(-2.59)#12,851 |
| 53. | Ely | 2.2% | 4.2%(-2.04)#53 | 4.9%(-2.72)#13,174 |
| 54. | Fish Springs | 2.1% | 4.2%(-2.08)#54 | 4.9%(-2.77)#13,276 |
| 55. | Ruhenstroth | 2.0% | 4.2%(-2.18)#55 | 4.9%(-2.87)#13,518 |
| 56. | Smith Valley | 1.6% | 4.2%(-2.66)#56 | 4.9%(-3.34)#14,571 |
| 57. | Silver Springs | 1.5% | 4.2%(-2.69)#57 | 4.9%(-3.37)#14,621 |
| 58. | Gardnerville | 0.82% | 4.2%(-3.39)#58 | 4.9%(-4.08)#15,795 |
| 59. | Spring Creek | 0.32% | 4.2%(-3.89)#59 | 4.9%(-4.57)#16,155 |
| 60. | Dayton | 0.22% | 4.2%(-3.98)#60 | 4.9%(-4.67)#16,183 |
1
2Common Questions
What are the Top 10 Cities with the Highest Percentage of Population with a Degree in Computers and Mathematics in Nevada?
Top 10 Cities with the Highest Percentage of Population with a Degree in Computers and Mathematics in Nevada are:
#1
26.5%
#2
21.7%
#3
21.6%
#4
21.6%
#5
21.0%
#6
17.1%
#7
16.3%
#8
12.5%
#9
12.3%
#10
11.1%
What city has the Highest Percentage of Population with a Degree in Computers and Mathematics in Nevada?
Mina has the Highest Percentage of Population with a Degree in Computers and Mathematics in Nevada with 26.5%.
What is the Percentage of Population with a Degree in Computers and Mathematics in the State of Nevada?
Percentage of Population with a Degree in Computers and Mathematics in Nevada is 4.2%.
What is the Percentage of Population with a Degree in Computers and Mathematics in the United States?
Percentage of Population with a Degree in Computers and Mathematics in the United States is 4.9%.