Cities with the Highest Percentage of Population with a Degree in Computers and Mathematics in Connecticut
RELATED REPORTS & OPTIONS
Computers and Mathematics
Connecticut
Compare Cities
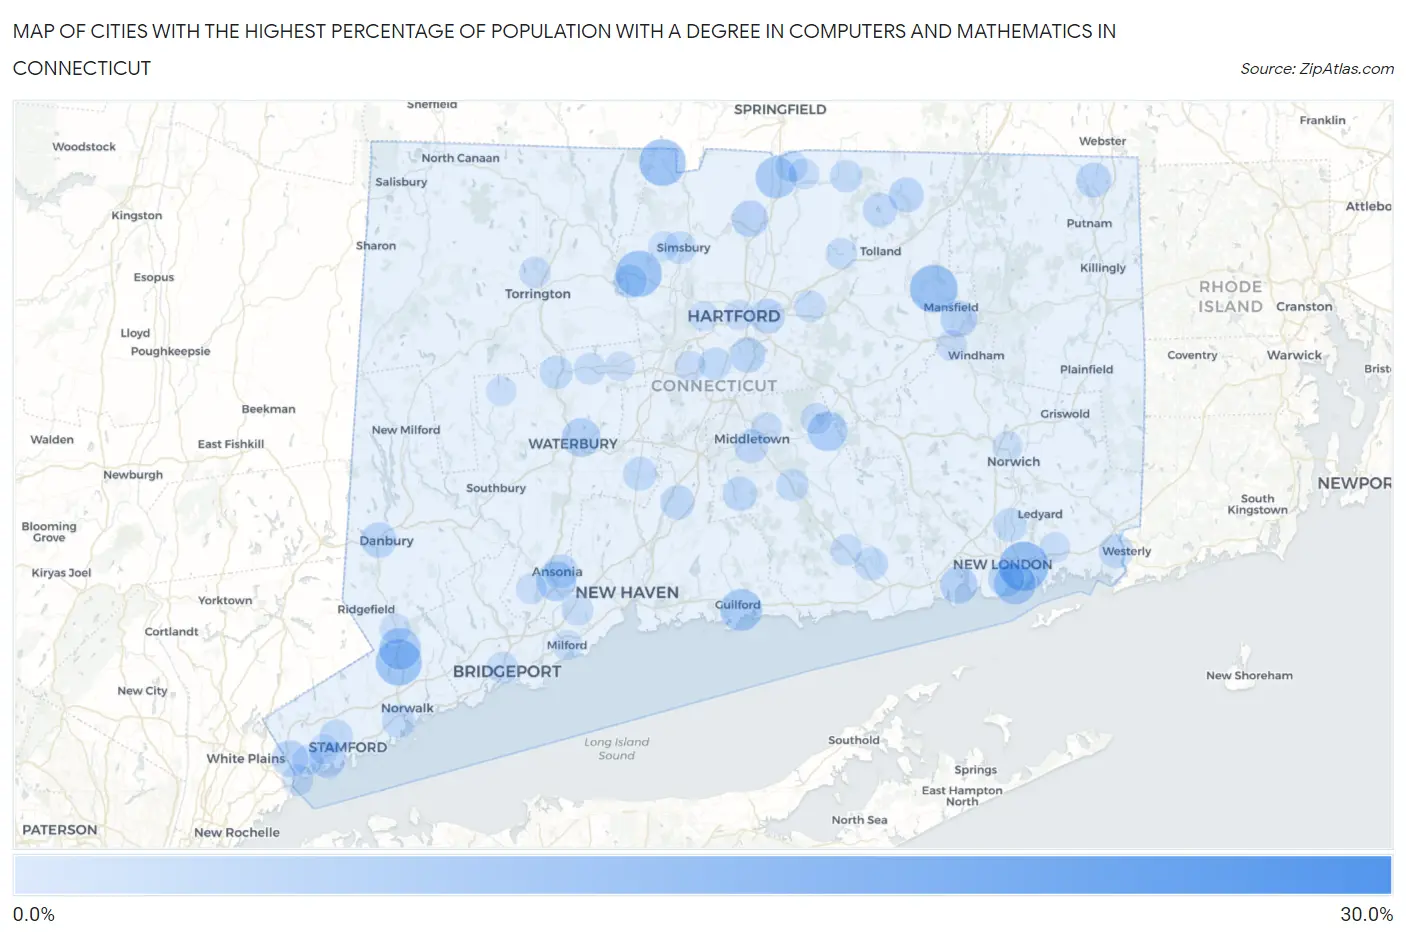
Map of Cities with the Highest Percentage of Population with a Degree in Computers and Mathematics in Connecticut
0.0%
30.0%
Cities with the Highest Percentage of Population with a Degree in Computers and Mathematics in Connecticut
| City | % Graduates | vs State | vs National | |
| 1. | Candlewood Lake Club | 26.8% | 4.4%(+22.4)#1 | 4.9%(+21.9)#363 |
| 2. | Lake Bungee | 19.3% | 4.4%(+14.9)#2 | 4.9%(+14.4)#655 |
| 3. | Knollcrest | 15.4% | 4.4%(+11.0)#3 | 4.9%(+10.5)#993 |
| 4. | Long Hill | 12.6% | 4.4%(+8.12)#4 | 4.9%(+7.66)#1,413 |
| 5. | Storrs | 11.8% | 4.4%(+7.37)#5 | 4.9%(+6.91)#1,568 |
| 6. | North Granby | 11.3% | 4.4%(+6.90)#6 | 4.9%(+6.44)#1,691 |
| 7. | Wilton Center | 11.1% | 4.4%(+6.69)#7 | 4.9%(+6.23)#1,727 |
| 8. | Canton Valley | 11.1% | 4.4%(+6.65)#8 | 4.9%(+6.19)#1,776 |
| 9. | Ball Pond | 9.6% | 4.4%(+5.20)#9 | 4.9%(+4.74)#2,304 |
| 10. | Guilford Center | 9.2% | 4.4%(+4.72)#10 | 4.9%(+4.26)#2,537 |
| 11. | Cannondale | 9.1% | 4.4%(+4.66)#11 | 4.9%(+4.20)#2,573 |
| 12. | Bridgewater | 9.1% | 4.4%(+4.66)#12 | 4.9%(+4.20)#2,590 |
| 13. | Groton | 8.9% | 4.4%(+4.50)#13 | 4.9%(+4.03)#2,664 |
| 14. | Thompsonville | 8.9% | 4.4%(+4.49)#14 | 4.9%(+4.03)#2,671 |
| 15. | Plattsville | 8.6% | 4.4%(+4.18)#15 | 4.9%(+3.72)#2,833 |
| 16. | East | 8.3% | 4.4%(+3.84)#16 | 4.9%(+3.38)#3,046 |
| 17. | East Hampton | 8.1% | 4.4%(+3.68)#17 | 4.9%(+3.22)#3,142 |
| 18. | Derby | 8.0% | 4.4%(+3.55)#18 | 4.9%(+3.09)#3,228 |
| 19. | Waterbury | 7.7% | 4.4%(+3.28)#19 | 4.9%(+2.82)#3,427 |
| 20. | Noroton Heights | 7.4% | 4.4%(+2.97)#20 | 4.9%(+2.51)#3,655 |
| 21. | Jewett City Borough | 7.1% | 4.4%(+2.67)#21 | 4.9%(+2.21)#3,932 |
| 22. | Niantic | 7.0% | 4.4%(+2.62)#22 | 4.9%(+2.15)#3,983 |
| 23. | Windsor Locks | 6.6% | 4.4%(+2.21)#23 | 4.9%(+1.74)#4,399 |
| 24. | Mansfield Center | 6.6% | 4.4%(+2.20)#24 | 4.9%(+1.74)#4,403 |
| 25. | Glenville | 6.6% | 4.4%(+2.15)#25 | 4.9%(+1.69)#4,454 |
| 26. | Pleasant Valley | 6.5% | 4.4%(+2.09)#26 | 4.9%(+1.63)#4,534 |
| 27. | New London | 6.5% | 4.4%(+2.08)#27 | 4.9%(+1.62)#4,545 |
| 28. | Cornwall Bridge | 6.5% | 4.4%(+2.02)#28 | 4.9%(+1.56)#4,617 |
| 29. | Riverside | 6.4% | 4.4%(+1.96)#29 | 4.9%(+1.50)#4,683 |
| 30. | Fenwick Borough | 6.2% | 4.4%(+1.82)#30 | 4.9%(+1.36)#4,862 |
| 31. | Danbury | 6.2% | 4.4%(+1.79)#31 | 4.9%(+1.33)#4,879 |
| 32. | Wethersfield | 6.2% | 4.4%(+1.75)#32 | 4.9%(+1.29)#4,911 |
| 33. | Tashua | 6.0% | 4.4%(+1.59)#33 | 4.9%(+1.13)#5,127 |
| 34. | North Grosvenor Dale | 6.0% | 4.4%(+1.58)#34 | 4.9%(+1.12)#5,133 |
| 35. | East Hartford | 5.9% | 4.4%(+1.46)#35 | 4.9%(+1.00)#5,278 |
| 36. | Stafford Springs | 5.9% | 4.4%(+1.43)#36 | 4.9%(+0.968)#5,342 |
| 37. | Pawcatuck | 5.7% | 4.4%(+1.32)#37 | 4.9%(+0.855)#5,483 |
| 38. | Wallingford Center | 5.7% | 4.4%(+1.31)#38 | 4.9%(+0.845)#5,495 |
| 39. | Crystal Lake | 5.7% | 4.4%(+1.24)#39 | 4.9%(+0.778)#5,567 |
| 40. | Durham | 5.7% | 4.4%(+1.24)#40 | 4.9%(+0.776)#5,569 |
| 41. | Sandy Hook | 5.6% | 4.4%(+1.14)#41 | 4.9%(+0.674)#5,726 |
| 42. | Ansonia | 5.5% | 4.4%(+1.03)#42 | 4.9%(+0.564)#5,915 |
| 43. | Middletown | 5.4% | 4.4%(+1.00)#43 | 4.9%(+0.539)#5,950 |
| 44. | Gales Ferry | 5.4% | 4.4%(+0.973)#44 | 4.9%(+0.511)#5,982 |
| 45. | Cheshire Village | 5.4% | 4.4%(+0.965)#45 | 4.9%(+0.504)#6,004 |
| 46. | Collinsville | 5.4% | 4.4%(+0.949)#46 | 4.9%(+0.488)#6,022 |
| 47. | Westport | 5.3% | 4.4%(+0.881)#47 | 4.9%(+0.419)#6,132 |
| 48. | Essex Village | 5.3% | 4.4%(+0.865)#48 | 4.9%(+0.404)#6,150 |
| 49. | Botsford | 5.2% | 4.4%(+0.803)#49 | 4.9%(+0.342)#6,280 |
| 50. | Stamford | 5.2% | 4.4%(+0.799)#50 | 4.9%(+0.337)#6,288 |
| 51. | Norwalk | 5.2% | 4.4%(+0.798)#51 | 4.9%(+0.336)#6,290 |
| 52. | Old Hill | 5.2% | 4.4%(+0.739)#52 | 4.9%(+0.277)#6,391 |
| 53. | Lakes West | 5.2% | 4.4%(+0.721)#53 | 4.9%(+0.259)#6,423 |
| 54. | Thomaston | 5.1% | 4.4%(+0.684)#54 | 4.9%(+0.222)#6,481 |
| 55. | Stepney | 5.0% | 4.4%(+0.602)#55 | 4.9%(+0.141)#6,618 |
| 56. | Simsbury Center | 4.9% | 4.4%(+0.492)#56 | 4.9%(+0.030)#6,801 |
| 57. | Northford | 4.9% | 4.4%(+0.477)#57 | 4.9%(+0.016)#6,834 |
| 58. | Newington | 4.9% | 4.4%(+0.469)#58 | 4.9%(+0.008)#6,849 |
| 59. | Route 7 Gateway | 4.9% | 4.4%(+0.463)#59 | 4.9%(+0.001)#6,856 |
| 60. | Higganum | 4.9% | 4.4%(+0.460)#60 | 4.9%(-0.001)#6,863 |
| 61. | Somers | 4.9% | 4.4%(+0.435)#61 | 4.9%(-0.026)#6,942 |
| 62. | Candlewood Isle | 4.8% | 4.4%(+0.355)#62 | 4.9%(-0.107)#7,089 |
| 63. | Trumbull Center | 4.7% | 4.4%(+0.305)#63 | 4.9%(-0.156)#7,192 |
| 64. | Sherwood Manor | 4.7% | 4.4%(+0.240)#64 | 4.9%(-0.221)#7,328 |
| 65. | Litchfield Borough | 4.7% | 4.4%(+0.222)#65 | 4.9%(-0.240)#7,365 |
| 66. | Newtown Borough | 4.6% | 4.4%(+0.138)#66 | 4.9%(-0.323)#7,518 |
| 67. | Terryville | 4.6% | 4.4%(+0.120)#67 | 4.9%(-0.341)#7,555 |
| 68. | Poplar Plains | 4.5% | 4.4%(+0.108)#68 | 4.9%(-0.353)#7,604 |
| 69. | Manchester | 4.5% | 4.4%(+0.082)#69 | 4.9%(-0.380)#7,650 |
| 70. | Deep River Center | 4.5% | 4.4%(+0.049)#70 | 4.9%(-0.412)#7,709 |
| 71. | Bridgeport | 4.5% | 4.4%(+0.040)#71 | 4.9%(-0.421)#7,726 |
| 72. | South Wilton | 4.4% | 4.4%(-0.000)#72 | 4.9%(-0.462)#7,810 |
| 73. | Byram | 4.4% | 4.4%(-0.067)#73 | 4.9%(-0.528)#7,953 |
| 74. | Lake Pocotopaug | 4.4% | 4.4%(-0.079)#74 | 4.9%(-0.540)#7,971 |
| 75. | Orange | 4.3% | 4.4%(-0.118)#75 | 4.9%(-0.580)#8,079 |
| 76. | Rockville | 4.3% | 4.4%(-0.124)#76 | 4.9%(-0.586)#8,088 |
| 77. | Torrington | 4.3% | 4.4%(-0.147)#77 | 4.9%(-0.608)#8,137 |
| 78. | Lordship | 4.2% | 4.4%(-0.230)#78 | 4.9%(-0.691)#8,313 |
| 79. | Georgetown | 4.2% | 4.4%(-0.279)#79 | 4.9%(-0.740)#8,424 |
| 80. | Hazardville | 4.1% | 4.4%(-0.316)#80 | 4.9%(-0.778)#8,503 |
| 81. | Old Mystic | 4.1% | 4.4%(-0.324)#81 | 4.9%(-0.786)#8,521 |
| 82. | New Britain | 4.1% | 4.4%(-0.330)#82 | 4.9%(-0.791)#8,528 |
| 83. | New Canaan | 4.1% | 4.4%(-0.356)#83 | 4.9%(-0.818)#8,580 |
| 84. | Shelton | 4.0% | 4.4%(-0.390)#84 | 4.9%(-0.851)#8,660 |
| 85. | Bigelow Corners | 4.0% | 4.4%(-0.403)#85 | 4.9%(-0.865)#8,688 |
| 86. | Portland | 4.0% | 4.4%(-0.433)#86 | 4.9%(-0.894)#8,735 |
| 87. | Willimantic | 4.0% | 4.4%(-0.435)#87 | 4.9%(-0.897)#8,763 |
| 88. | Daniels Farm | 4.0% | 4.4%(-0.442)#88 | 4.9%(-0.904)#8,780 |
| 89. | Greenwich | 3.9% | 4.4%(-0.484)#89 | 4.9%(-0.946)#8,866 |
| 90. | Saugatuck | 3.9% | 4.4%(-0.501)#90 | 4.9%(-0.962)#8,912 |
| 91. | Hartford | 3.9% | 4.4%(-0.524)#91 | 4.9%(-0.986)#8,975 |
| 92. | West Simsbury | 3.8% | 4.4%(-0.592)#92 | 4.9%(-1.05)#9,146 |
| 93. | Bethlehem Village | 3.8% | 4.4%(-0.593)#93 | 4.9%(-1.05)#9,150 |
| 94. | Cos Cob | 3.8% | 4.4%(-0.602)#94 | 4.9%(-1.06)#9,173 |
| 95. | Milford City Balance | 3.8% | 4.4%(-0.628)#95 | 4.9%(-1.09)#9,223 |
| 96. | Norwich | 3.8% | 4.4%(-0.673)#96 | 4.9%(-1.13)#9,331 |
| 97. | West Hartford | 3.7% | 4.4%(-0.694)#97 | 4.9%(-1.15)#9,368 |
| 98. | Bristol | 3.7% | 4.4%(-0.748)#98 | 4.9%(-1.21)#9,503 |
| 99. | Noroton | 3.7% | 4.4%(-0.759)#99 | 4.9%(-1.22)#9,527 |
| 100. | Inglenook | 3.7% | 4.4%(-0.759)#100 | 4.9%(-1.22)#9,529 |
Common Questions
What are the Top 10 Cities with the Highest Percentage of Population with a Degree in Computers and Mathematics in Connecticut?
Top 10 Cities with the Highest Percentage of Population with a Degree in Computers and Mathematics in Connecticut are:
#1
12.6%
#2
11.8%
#3
11.3%
#4
11.1%
#5
11.1%
#6
9.2%
#7
9.1%
#8
8.9%
#9
8.9%
#10
8.1%
What city has the Highest Percentage of Population with a Degree in Computers and Mathematics in Connecticut?
Long Hill has the Highest Percentage of Population with a Degree in Computers and Mathematics in Connecticut with 12.6%.
What is the Percentage of Population with a Degree in Computers and Mathematics in the State of Connecticut?
Percentage of Population with a Degree in Computers and Mathematics in Connecticut is 4.4%.
What is the Percentage of Population with a Degree in Computers and Mathematics in the United States?
Percentage of Population with a Degree in Computers and Mathematics in the United States is 4.9%.