Cities with the Highest Percentage of Population with a Degree in Computers and Mathematics in South Dakota
RELATED REPORTS & OPTIONS
Computers and Mathematics
South Dakota
Compare Cities
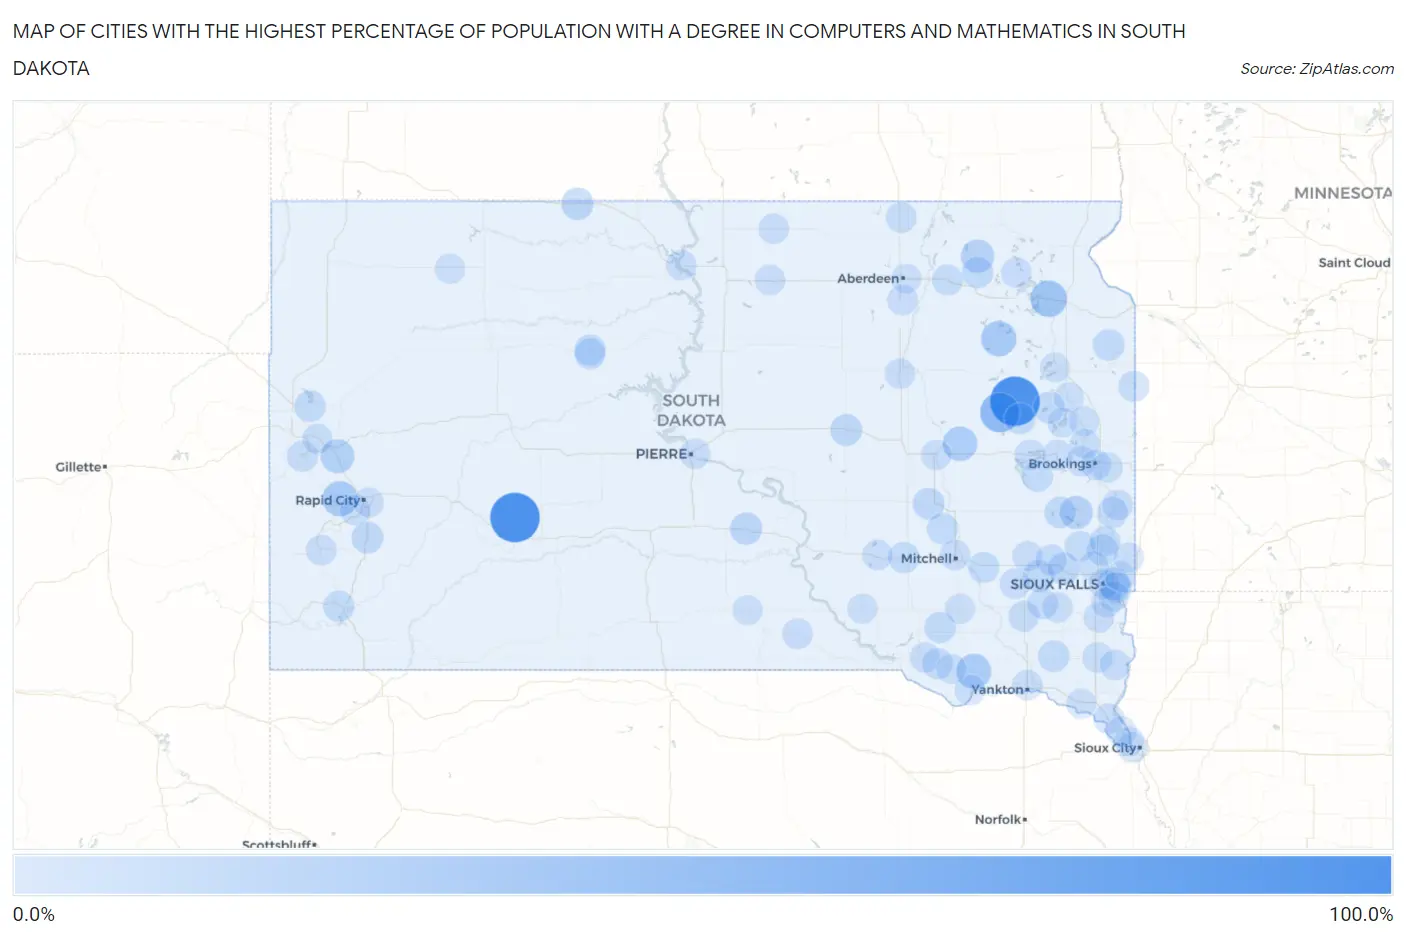
Map of Cities with the Highest Percentage of Population with a Degree in Computers and Mathematics in South Dakota
0.0%
100.0%
Cities with the Highest Percentage of Population with a Degree in Computers and Mathematics in South Dakota
| City | % Graduates | vs State | vs National | |
| 1. | Vienna | 100.0% | 3.2%(+96.8)#1 | 4.9%(+95.1)#24 |
| 2. | Cottonwood | 100.0% | 3.2%(+96.8)#2 | 4.9%(+95.1)#26 |
| 3. | Willow Lake | 48.3% | 3.2%(+45.1)#3 | 4.9%(+43.4)#124 |
| 4. | Ortley | 33.3% | 3.2%(+30.2)#4 | 4.9%(+28.4)#254 |
| 5. | Bradley | 27.3% | 3.2%(+24.1)#5 | 4.9%(+22.4)#350 |
| 6. | Johnson Siding | 26.5% | 3.2%(+23.4)#6 | 4.9%(+21.6)#371 |
| 7. | Tyndall | 25.6% | 3.2%(+22.5)#7 | 4.9%(+20.7)#393 |
| 8. | Yale | 23.5% | 3.2%(+20.4)#8 | 4.9%(+18.6)#460 |
| 9. | Blucksberg Mountain | 19.6% | 3.2%(+16.4)#9 | 4.9%(+14.7)#640 |
| 10. | Langford | 17.1% | 3.2%(+14.0)#10 | 4.9%(+12.2)#822 |
| 11. | Wentworth | 16.7% | 3.2%(+13.5)#11 | 4.9%(+11.8)#867 |
| 12. | Pine Lakes Addition | 13.2% | 3.2%(+10.0)#12 | 4.9%(+8.29)#1,301 |
| 13. | Kennebec | 11.9% | 3.2%(+8.78)#13 | 4.9%(+7.05)#1,540 |
| 14. | Mcintosh | 11.5% | 3.2%(+8.38)#14 | 4.9%(+6.64)#1,642 |
| 15. | Canistota | 11.1% | 3.2%(+7.95)#15 | 4.9%(+6.22)#1,736 |
| 16. | Humboldt | 10.9% | 3.2%(+7.79)#16 | 4.9%(+6.05)#1,803 |
| 17. | Miller | 10.2% | 3.2%(+7.05)#17 | 4.9%(+5.32)#2,050 |
| 18. | Hermosa | 9.7% | 3.2%(+6.52)#18 | 4.9%(+4.78)#2,281 |
| 19. | Woonsocket | 9.5% | 3.2%(+6.37)#19 | 4.9%(+4.63)#2,354 |
| 20. | La Bolt | 9.1% | 3.2%(+5.93)#20 | 4.9%(+4.20)#2,593 |
| 21. | Hayti | 8.8% | 3.2%(+5.61)#21 | 4.9%(+3.88)#2,750 |
| 22. | Irene | 8.6% | 3.2%(+5.46)#22 | 4.9%(+3.73)#2,830 |
| 23. | Delmont | 8.3% | 3.2%(+5.17)#23 | 4.9%(+3.44)#3,010 |
| 24. | Pierpont | 8.3% | 3.2%(+5.17)#24 | 4.9%(+3.44)#3,016 |
| 25. | Madison | 8.2% | 3.2%(+5.01)#25 | 4.9%(+3.28)#3,104 |
| 26. | Baltic | 7.9% | 3.2%(+4.74)#26 | 4.9%(+3.00)#3,292 |
| 27. | Fruitdale | 7.9% | 3.2%(+4.74)#27 | 4.9%(+3.00)#3,298 |
| 28. | Letcher | 7.7% | 3.2%(+4.53)#28 | 4.9%(+2.80)#3,471 |
| 29. | Plankinton | 7.5% | 3.2%(+4.32)#29 | 4.9%(+2.58)#3,610 |
| 30. | Hot Springs | 7.3% | 3.2%(+4.15)#30 | 4.9%(+2.42)#3,744 |
| 31. | Alexandria | 7.0% | 3.2%(+3.83)#31 | 4.9%(+2.10)#4,034 |
| 32. | Bryant | 6.7% | 3.2%(+3.51)#32 | 4.9%(+1.77)#4,348 |
| 33. | Oldham | 6.7% | 3.2%(+3.51)#33 | 4.9%(+1.77)#4,382 |
| 34. | North Eagle Butte | 6.5% | 3.2%(+3.36)#34 | 4.9%(+1.63)#4,526 |
| 35. | Eagle Butte | 6.5% | 3.2%(+3.32)#35 | 4.9%(+1.59)#4,577 |
| 36. | Dante | 6.2% | 3.2%(+3.09)#36 | 4.9%(+1.36)#4,860 |
| 37. | Groton | 6.2% | 3.2%(+3.05)#37 | 4.9%(+1.32)#4,889 |
| 38. | Lead | 6.0% | 3.2%(+2.89)#38 | 4.9%(+1.15)#5,095 |
| 39. | Montrose | 5.9% | 3.2%(+2.72)#39 | 4.9%(+0.988)#5,308 |
| 40. | Egan | 5.9% | 3.2%(+2.72)#40 | 4.9%(+0.988)#5,319 |
| 41. | Freeman | 5.6% | 3.2%(+2.45)#41 | 4.9%(+0.714)#5,668 |
| 42. | Gary | 5.6% | 3.2%(+2.40)#42 | 4.9%(+0.662)#5,770 |
| 43. | Frederick | 5.6% | 3.2%(+2.40)#43 | 4.9%(+0.662)#5,773 |
| 44. | Anderson | 5.1% | 3.2%(+1.95)#44 | 4.9%(+0.216)#6,494 |
| 45. | Colton | 5.0% | 3.2%(+1.84)#45 | 4.9%(+0.106)#6,681 |
| 46. | Dell Rapids | 5.0% | 3.2%(+1.81)#46 | 4.9%(+0.071)#6,731 |
| 47. | Marion | 4.7% | 3.2%(+1.56)#47 | 4.9%(-0.177)#7,239 |
| 48. | Lake Preston | 4.5% | 3.2%(+1.39)#48 | 4.9%(-0.349)#7,586 |
| 49. | Custer | 4.5% | 3.2%(+1.29)#49 | 4.9%(-0.441)#7,764 |
| 50. | Arlington | 4.4% | 3.2%(+1.24)#50 | 4.9%(-0.491)#7,876 |
| 51. | Gregory | 4.3% | 3.2%(+1.19)#51 | 4.9%(-0.546)#7,984 |
| 52. | Flandreau | 4.3% | 3.2%(+1.14)#52 | 4.9%(-0.596)#8,113 |
| 53. | Eureka | 4.2% | 3.2%(+1.01)#53 | 4.9%(-0.727)#8,385 |
| 54. | Bridgewater | 4.2% | 3.2%(+1.01)#54 | 4.9%(-0.727)#8,399 |
| 55. | Boulder Canyon | 4.1% | 3.2%(+0.986)#55 | 4.9%(-0.749)#8,444 |
| 56. | Redfield | 4.1% | 3.2%(+0.954)#56 | 4.9%(-0.781)#8,509 |
| 57. | Sioux Falls | 4.1% | 3.2%(+0.901)#57 | 4.9%(-0.835)#8,620 |
| 58. | Dakota Dunes | 4.1% | 3.2%(+0.892)#58 | 4.9%(-0.843)#8,646 |
| 59. | Warner | 4.0% | 3.2%(+0.882)#59 | 4.9%(-0.854)#8,668 |
| 60. | Aurora | 3.9% | 3.2%(+0.768)#60 | 4.9%(-0.967)#8,926 |
| 61. | Bowdle | 3.9% | 3.2%(+0.763)#61 | 4.9%(-0.972)#8,948 |
| 62. | Beresford | 3.9% | 3.2%(+0.725)#62 | 4.9%(-1.01)#9,026 |
| 63. | Springfield | 3.8% | 3.2%(+0.625)#63 | 4.9%(-1.11)#9,269 |
| 64. | Alcester | 3.8% | 3.2%(+0.601)#64 | 4.9%(-1.13)#9,333 |
| 65. | Volga | 3.6% | 3.2%(+0.481)#65 | 4.9%(-1.25)#9,606 |
| 66. | Worthing | 3.6% | 3.2%(+0.465)#66 | 4.9%(-1.27)#9,654 |
| 67. | White Lake | 3.6% | 3.2%(+0.413)#67 | 4.9%(-1.32)#9,769 |
| 68. | Roslyn | 3.6% | 3.2%(+0.413)#68 | 4.9%(-1.32)#9,781 |
| 69. | Parker | 3.6% | 3.2%(+0.392)#69 | 4.9%(-1.34)#9,818 |
| 70. | Colonial Pine Hills | 3.5% | 3.2%(+0.383)#70 | 4.9%(-1.35)#9,840 |
| 71. | Salem | 3.5% | 3.2%(+0.377)#71 | 4.9%(-1.36)#9,855 |
| 72. | Brookings | 3.5% | 3.2%(+0.373)#72 | 4.9%(-1.36)#9,865 |
| 73. | Elk Point | 3.5% | 3.2%(+0.364)#73 | 4.9%(-1.37)#9,884 |
| 74. | Wagner | 3.4% | 3.2%(+0.231)#74 | 4.9%(-1.50)#10,211 |
| 75. | Shindler | 3.3% | 3.2%(+0.147)#75 | 4.9%(-1.59)#10,447 |
| 76. | Pierre | 3.2% | 3.2%(+0.071)#76 | 4.9%(-1.66)#10,639 |
| 77. | Mitchell | 3.2% | 3.2%(+0.042)#77 | 4.9%(-1.69)#10,708 |
| 78. | Yankton | 3.2% | 3.2%(+0.039)#78 | 4.9%(-1.70)#10,718 |
| 79. | Mobridge | 3.2% | 3.2%(+0.002)#79 | 4.9%(-1.73)#10,810 |
| 80. | Whitewood | 3.1% | 3.2%(-0.105)#80 | 4.9%(-1.84)#11,053 |
| 81. | Huron | 3.0% | 3.2%(-0.120)#81 | 4.9%(-1.86)#11,084 |
| 82. | Bison | 3.0% | 3.2%(-0.174)#82 | 4.9%(-1.91)#11,211 |
| 83. | Parkston | 2.9% | 3.2%(-0.226)#83 | 4.9%(-1.96)#11,351 |
| 84. | Rapid City | 2.9% | 3.2%(-0.304)#84 | 4.9%(-2.04)#11,544 |
| 85. | Aberdeen | 2.7% | 3.2%(-0.448)#85 | 4.9%(-2.18)#11,888 |
| 86. | Jefferson | 2.7% | 3.2%(-0.456)#86 | 4.9%(-2.19)#11,910 |
| 87. | Harrisburg | 2.7% | 3.2%(-0.472)#87 | 4.9%(-2.21)#11,944 |
| 88. | Brandon | 2.7% | 3.2%(-0.484)#88 | 4.9%(-2.22)#11,973 |
| 89. | Crooks | 2.5% | 3.2%(-0.666)#89 | 4.9%(-2.40)#12,412 |
| 90. | Platte | 2.5% | 3.2%(-0.669)#90 | 4.9%(-2.40)#12,421 |
| 91. | Garretson | 2.4% | 3.2%(-0.729)#91 | 4.9%(-2.46)#12,578 |
| 92. | Lake Poinsett | 2.4% | 3.2%(-0.734)#92 | 4.9%(-2.47)#12,597 |
| 93. | Watertown | 2.4% | 3.2%(-0.770)#93 | 4.9%(-2.50)#12,666 |
| 94. | Winner | 2.3% | 3.2%(-0.841)#94 | 4.9%(-2.58)#12,825 |
| 95. | Avon | 2.2% | 3.2%(-0.911)#95 | 4.9%(-2.65)#12,979 |
| 96. | Vermillion | 2.2% | 3.2%(-0.924)#96 | 4.9%(-2.66)#13,003 |
| 97. | North Sioux City | 2.2% | 3.2%(-0.926)#97 | 4.9%(-2.66)#13,006 |
| 98. | Castlewood | 2.2% | 3.2%(-0.953)#98 | 4.9%(-2.69)#13,087 |
| 99. | Estelline | 2.2% | 3.2%(-0.969)#99 | 4.9%(-2.70)#13,127 |
| 100. | Bruce | 2.2% | 3.2%(-0.985)#100 | 4.9%(-2.72)#13,168 |
Common Questions
What are the Top 10 Cities with the Highest Percentage of Population with a Degree in Computers and Mathematics in South Dakota?
Top 10 Cities with the Highest Percentage of Population with a Degree in Computers and Mathematics in South Dakota are:
#1
100.0%
#2
100.0%
#3
48.3%
#4
33.3%
#5
27.3%
#6
26.5%
#7
25.6%
#8
23.5%
#9
19.6%
#10
17.1%
What city has the Highest Percentage of Population with a Degree in Computers and Mathematics in South Dakota?
Vienna has the Highest Percentage of Population with a Degree in Computers and Mathematics in South Dakota with 100.0%.
What is the Percentage of Population with a Degree in Computers and Mathematics in the State of South Dakota?
Percentage of Population with a Degree in Computers and Mathematics in South Dakota is 3.2%.
What is the Percentage of Population with a Degree in Computers and Mathematics in the United States?
Percentage of Population with a Degree in Computers and Mathematics in the United States is 4.9%.