Cities with the Highest Percentage of Population with a Degree in Computers and Mathematics in Kansas
RELATED REPORTS & OPTIONS
Computers and Mathematics
Kansas
Compare Cities
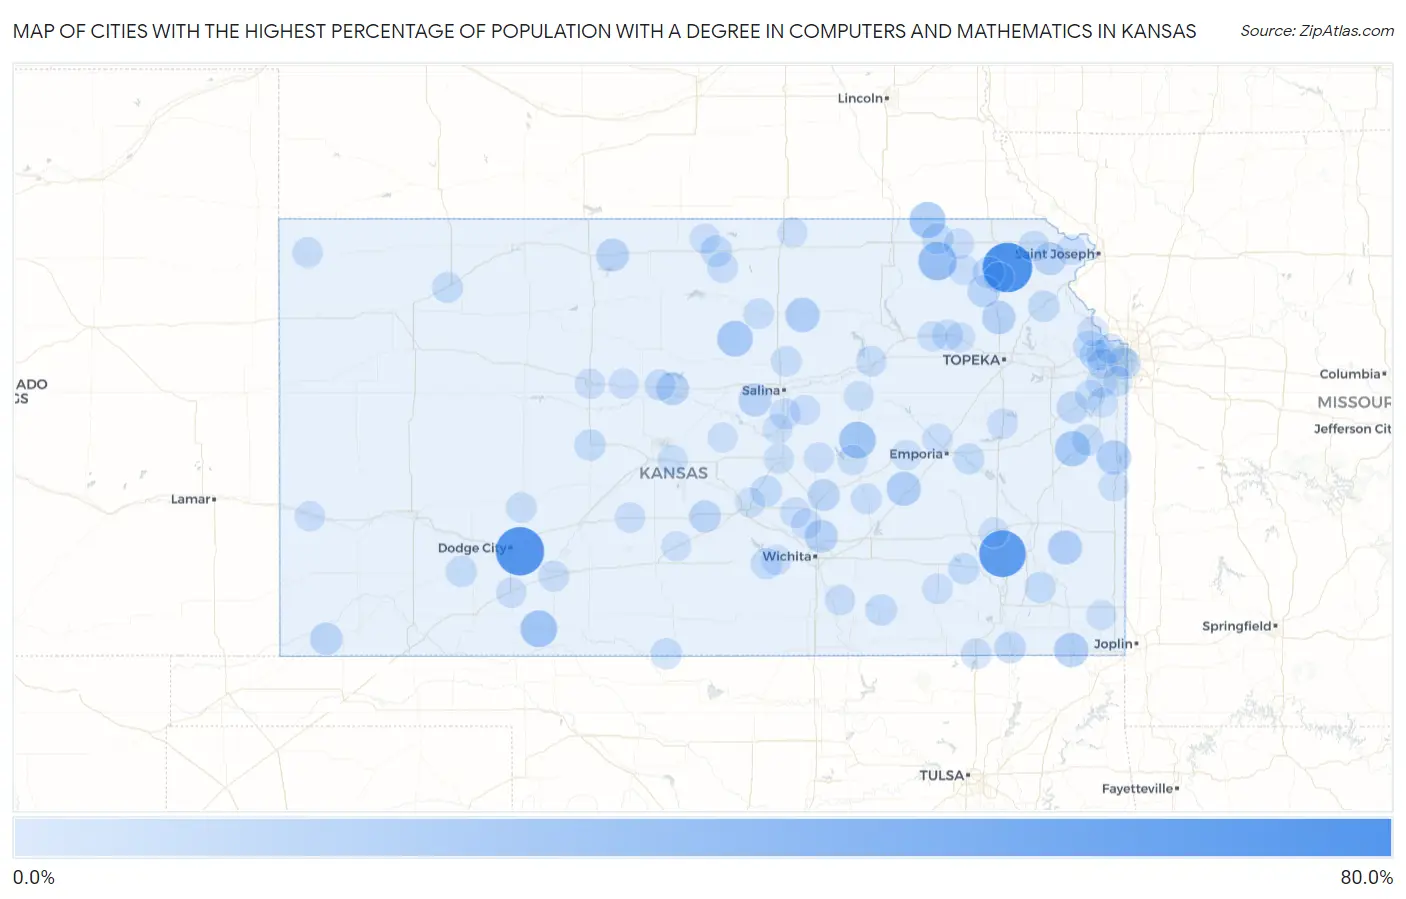
Map of Cities with the Highest Percentage of Population with a Degree in Computers and Mathematics in Kansas
0.0%
80.0%
Cities with the Highest Percentage of Population with a Degree in Computers and Mathematics in Kansas
| City | % Graduates | vs State | vs National | |
| 1. | Kickapoo Tribal Center | 75.0% | 4.0%(+71.0)#1 | 4.9%(+70.1)#45 |
| 2. | Fort Dodge | 70.6% | 4.0%(+66.6)#2 | 4.9%(+65.7)#54 |
| 3. | Buffalo | 64.7% | 4.0%(+60.7)#3 | 4.9%(+59.8)#61 |
| 4. | Vermillion | 33.3% | 4.0%(+29.4)#4 | 4.9%(+28.4)#253 |
| 5. | Ashland | 27.7% | 4.0%(+23.7)#5 | 4.9%(+22.8)#339 |
| 6. | Lincolnville | 27.3% | 4.0%(+23.3)#6 | 4.9%(+22.4)#348 |
| 7. | Summerfield | 25.0% | 4.0%(+21.0)#7 | 4.9%(+20.1)#422 |
| 8. | Barnard | 23.8% | 4.0%(+19.8)#8 | 4.9%(+18.9)#456 |
| 9. | Lane | 22.2% | 4.0%(+18.3)#9 | 4.9%(+17.3)#510 |
| 10. | Miltonvale | 19.2% | 4.0%(+15.3)#10 | 4.9%(+14.3)#662 |
| 11. | Linn Valley | 19.2% | 4.0%(+15.2)#11 | 4.9%(+14.3)#663 |
| 12. | Chetopa | 19.2% | 4.0%(+15.2)#12 | 4.9%(+14.3)#665 |
| 13. | Matfield Green | 18.8% | 4.0%(+14.8)#13 | 4.9%(+13.9)#692 |
| 14. | Savonburg | 18.2% | 4.0%(+14.2)#14 | 4.9%(+13.3)#737 |
| 15. | Mayetta | 15.9% | 4.0%(+11.9)#15 | 4.9%(+11.0)#941 |
| 16. | Kechi | 14.8% | 4.0%(+10.8)#16 | 4.9%(+9.89)#1,057 |
| 17. | Brookville | 14.3% | 4.0%(+10.3)#17 | 4.9%(+9.39)#1,128 |
| 18. | Dorrance | 13.9% | 4.0%(+9.93)#18 | 4.9%(+8.99)#1,175 |
| 19. | Denton | 13.8% | 4.0%(+9.83)#19 | 4.9%(+8.90)#1,191 |
| 20. | Agra | 13.6% | 4.0%(+9.68)#20 | 4.9%(+8.74)#1,219 |
| 21. | Rolla | 12.7% | 4.0%(+8.73)#21 | 4.9%(+7.79)#1,395 |
| 22. | Circleville | 12.5% | 4.0%(+8.54)#22 | 4.9%(+7.61)#1,449 |
| 23. | Walton | 11.1% | 4.0%(+7.15)#23 | 4.9%(+6.22)#1,752 |
| 24. | Plevna | 11.1% | 4.0%(+7.15)#24 | 4.9%(+6.22)#1,768 |
| 25. | Wellsville | 10.9% | 4.0%(+6.93)#25 | 4.9%(+6.00)#1,818 |
| 26. | Wetmore | 10.3% | 4.0%(+6.38)#26 | 4.9%(+5.45)#2,006 |
| 27. | Coffeyville | 10.1% | 4.0%(+6.14)#27 | 4.9%(+5.21)#2,090 |
| 28. | Osawatomie | 9.7% | 4.0%(+5.72)#28 | 4.9%(+4.78)#2,269 |
| 29. | Nortonville | 9.5% | 4.0%(+5.51)#29 | 4.9%(+4.58)#2,385 |
| 30. | Mankato | 9.4% | 4.0%(+5.39)#30 | 4.9%(+4.46)#2,450 |
| 31. | Axtell | 9.1% | 4.0%(+5.13)#31 | 4.9%(+4.20)#2,575 |
| 32. | Rush Center | 9.1% | 4.0%(+5.13)#32 | 4.9%(+4.20)#2,583 |
| 33. | Buhler | 8.7% | 4.0%(+4.79)#33 | 4.9%(+3.86)#2,761 |
| 34. | Burden | 8.7% | 4.0%(+4.79)#34 | 4.9%(+3.86)#2,762 |
| 35. | Fall River | 8.6% | 4.0%(+4.61)#35 | 4.9%(+3.68)#2,858 |
| 36. | Montezuma | 8.3% | 4.0%(+4.37)#36 | 4.9%(+3.44)#2,978 |
| 37. | Hardtner | 8.3% | 4.0%(+4.37)#37 | 4.9%(+3.44)#3,008 |
| 38. | Galesburg | 8.3% | 4.0%(+4.37)#38 | 4.9%(+3.44)#3,018 |
| 39. | Basehor | 8.3% | 4.0%(+4.31)#39 | 4.9%(+3.37)#3,051 |
| 40. | Bonner Springs | 8.2% | 4.0%(+4.25)#40 | 4.9%(+3.31)#3,080 |
| 41. | Mission Hills | 8.1% | 4.0%(+4.11)#41 | 4.9%(+3.18)#3,168 |
| 42. | Selden | 7.8% | 4.0%(+3.88)#42 | 4.9%(+2.95)#3,335 |
| 43. | Neosho Rapids | 7.7% | 4.0%(+3.73)#43 | 4.9%(+2.80)#3,456 |
| 44. | Robinson | 7.7% | 4.0%(+3.73)#44 | 4.9%(+2.80)#3,468 |
| 45. | Bunker Hill | 7.7% | 4.0%(+3.73)#45 | 4.9%(+2.80)#3,474 |
| 46. | Cheney | 7.6% | 4.0%(+3.61)#46 | 4.9%(+2.68)#3,554 |
| 47. | Assaria | 7.2% | 4.0%(+3.25)#47 | 4.9%(+2.31)#3,822 |
| 48. | Jewell | 6.8% | 4.0%(+2.86)#48 | 4.9%(+1.92)#4,199 |
| 49. | Glasco | 6.8% | 4.0%(+2.86)#49 | 4.9%(+1.92)#4,200 |
| 50. | St Francis | 6.7% | 4.0%(+2.71)#50 | 4.9%(+1.77)#4,344 |
| 51. | Burns | 6.7% | 4.0%(+2.71)#51 | 4.9%(+1.77)#4,364 |
| 52. | Belvue | 6.7% | 4.0%(+2.71)#52 | 4.9%(+1.77)#4,372 |
| 53. | Netawaka | 6.7% | 4.0%(+2.71)#53 | 4.9%(+1.77)#4,379 |
| 54. | Bennington | 6.6% | 4.0%(+2.63)#54 | 4.9%(+1.70)#4,444 |
| 55. | Caney | 6.6% | 4.0%(+2.62)#55 | 4.9%(+1.68)#4,456 |
| 56. | Junction City | 6.6% | 4.0%(+2.61)#56 | 4.9%(+1.68)#4,464 |
| 57. | Jetmore | 6.6% | 4.0%(+2.61)#57 | 4.9%(+1.68)#4,470 |
| 58. | Bucklin | 6.5% | 4.0%(+2.54)#58 | 4.9%(+1.61)#4,555 |
| 59. | Udall | 6.4% | 4.0%(+2.42)#59 | 4.9%(+1.49)#4,698 |
| 60. | Olathe | 6.3% | 4.0%(+2.30)#60 | 4.9%(+1.37)#4,814 |
| 61. | Halstead | 6.2% | 4.0%(+2.29)#61 | 4.9%(+1.36)#4,825 |
| 62. | Macksville | 6.2% | 4.0%(+2.29)#62 | 4.9%(+1.36)#4,844 |
| 63. | Seneca | 6.2% | 4.0%(+2.21)#63 | 4.9%(+1.28)#4,920 |
| 64. | Howard | 6.2% | 4.0%(+2.21)#64 | 4.9%(+1.28)#4,925 |
| 65. | Sedgwick | 6.1% | 4.0%(+2.13)#65 | 4.9%(+1.20)#5,025 |
| 66. | Troy | 6.1% | 4.0%(+2.10)#66 | 4.9%(+1.17)#5,060 |
| 67. | Corning | 6.1% | 4.0%(+2.10)#67 | 4.9%(+1.17)#5,077 |
| 68. | Edwardsville | 6.0% | 4.0%(+2.05)#68 | 4.9%(+1.12)#5,143 |
| 69. | Lyndon | 6.0% | 4.0%(+2.03)#69 | 4.9%(+1.10)#5,174 |
| 70. | Shawnee | 6.0% | 4.0%(+2.03)#70 | 4.9%(+1.09)#5,176 |
| 71. | Minneola | 5.7% | 4.0%(+1.70)#71 | 4.9%(+0.766)#5,583 |
| 72. | Lansing | 5.6% | 4.0%(+1.68)#72 | 4.9%(+0.747)#5,615 |
| 73. | Ellinwood | 5.6% | 4.0%(+1.65)#73 | 4.9%(+0.717)#5,663 |
| 74. | Americus | 5.6% | 4.0%(+1.63)#74 | 4.9%(+0.700)#5,693 |
| 75. | Gorham | 5.6% | 4.0%(+1.60)#75 | 4.9%(+0.662)#5,762 |
| 76. | Burr Oak | 5.6% | 4.0%(+1.60)#76 | 4.9%(+0.662)#5,776 |
| 77. | Garden Plain | 5.5% | 4.0%(+1.57)#77 | 4.9%(+0.638)#5,811 |
| 78. | Marion | 5.5% | 4.0%(+1.57)#78 | 4.9%(+0.632)#5,815 |
| 79. | Roeland Park | 5.4% | 4.0%(+1.46)#79 | 4.9%(+0.529)#5,964 |
| 80. | Syracuse | 5.4% | 4.0%(+1.45)#80 | 4.9%(+0.511)#5,979 |
| 81. | Lehigh | 5.4% | 4.0%(+1.45)#81 | 4.9%(+0.511)#5,995 |
| 82. | Gypsum | 5.3% | 4.0%(+1.30)#82 | 4.9%(+0.369)#6,225 |
| 83. | Woodbine | 5.3% | 4.0%(+1.30)#83 | 4.9%(+0.369)#6,238 |
| 84. | Mcpherson | 5.2% | 4.0%(+1.27)#84 | 4.9%(+0.335)#6,294 |
| 85. | Overland Park | 5.2% | 4.0%(+1.27)#85 | 4.9%(+0.332)#6,297 |
| 86. | Hays | 5.2% | 4.0%(+1.24)#86 | 4.9%(+0.308)#6,336 |
| 87. | Wamego | 5.2% | 4.0%(+1.23)#87 | 4.9%(+0.300)#6,352 |
| 88. | Scammon | 5.2% | 4.0%(+1.21)#88 | 4.9%(+0.278)#6,388 |
| 89. | Pleasanton | 5.2% | 4.0%(+1.19)#89 | 4.9%(+0.261)#6,419 |
| 90. | St Marys | 5.0% | 4.0%(+1.05)#90 | 4.9%(+0.119)#6,648 |
| 91. | Gardner | 5.0% | 4.0%(+1.05)#91 | 4.9%(+0.118)#6,650 |
| 92. | Strong City | 5.0% | 4.0%(+1.04)#92 | 4.9%(+0.106)#6,687 |
| 93. | Munden | 5.0% | 4.0%(+1.04)#93 | 4.9%(+0.106)#6,698 |
| 94. | Spring Hill | 4.9% | 4.0%(+0.957)#94 | 4.9%(+0.023)#6,823 |
| 95. | Geneseo | 4.8% | 4.0%(+0.802)#95 | 4.9%(-0.132)#7,146 |
| 96. | Preston | 4.8% | 4.0%(+0.802)#96 | 4.9%(-0.132)#7,147 |
| 97. | Yates Center | 4.7% | 4.0%(+0.783)#97 | 4.9%(-0.151)#7,181 |
| 98. | Lindsborg | 4.7% | 4.0%(+0.743)#98 | 4.9%(-0.191)#7,266 |
| 99. | Hutchinson | 4.7% | 4.0%(+0.694)#99 | 4.9%(-0.240)#7,366 |
| 100. | Kansas City | 4.6% | 4.0%(+0.637)#100 | 4.9%(-0.297)#7,477 |
Common Questions
What are the Top 10 Cities with the Highest Percentage of Population with a Degree in Computers and Mathematics in Kansas?
Top 10 Cities with the Highest Percentage of Population with a Degree in Computers and Mathematics in Kansas are:
#1
75.0%
#2
70.6%
#3
64.7%
#4
33.3%
#5
27.7%
#6
27.3%
#7
25.0%
#8
23.8%
#9
22.2%
#10
19.2%
What city has the Highest Percentage of Population with a Degree in Computers and Mathematics in Kansas?
Kickapoo Tribal Center has the Highest Percentage of Population with a Degree in Computers and Mathematics in Kansas with 75.0%.
What is the Percentage of Population with a Degree in Computers and Mathematics in the State of Kansas?
Percentage of Population with a Degree in Computers and Mathematics in Kansas is 4.0%.
What is the Percentage of Population with a Degree in Computers and Mathematics in the United States?
Percentage of Population with a Degree in Computers and Mathematics in the United States is 4.9%.