Cities with the Highest Percentage of Population with a Degree in Computers and Mathematics in Virginia
RELATED REPORTS & OPTIONS
Computers and Mathematics
Virginia
Compare Cities
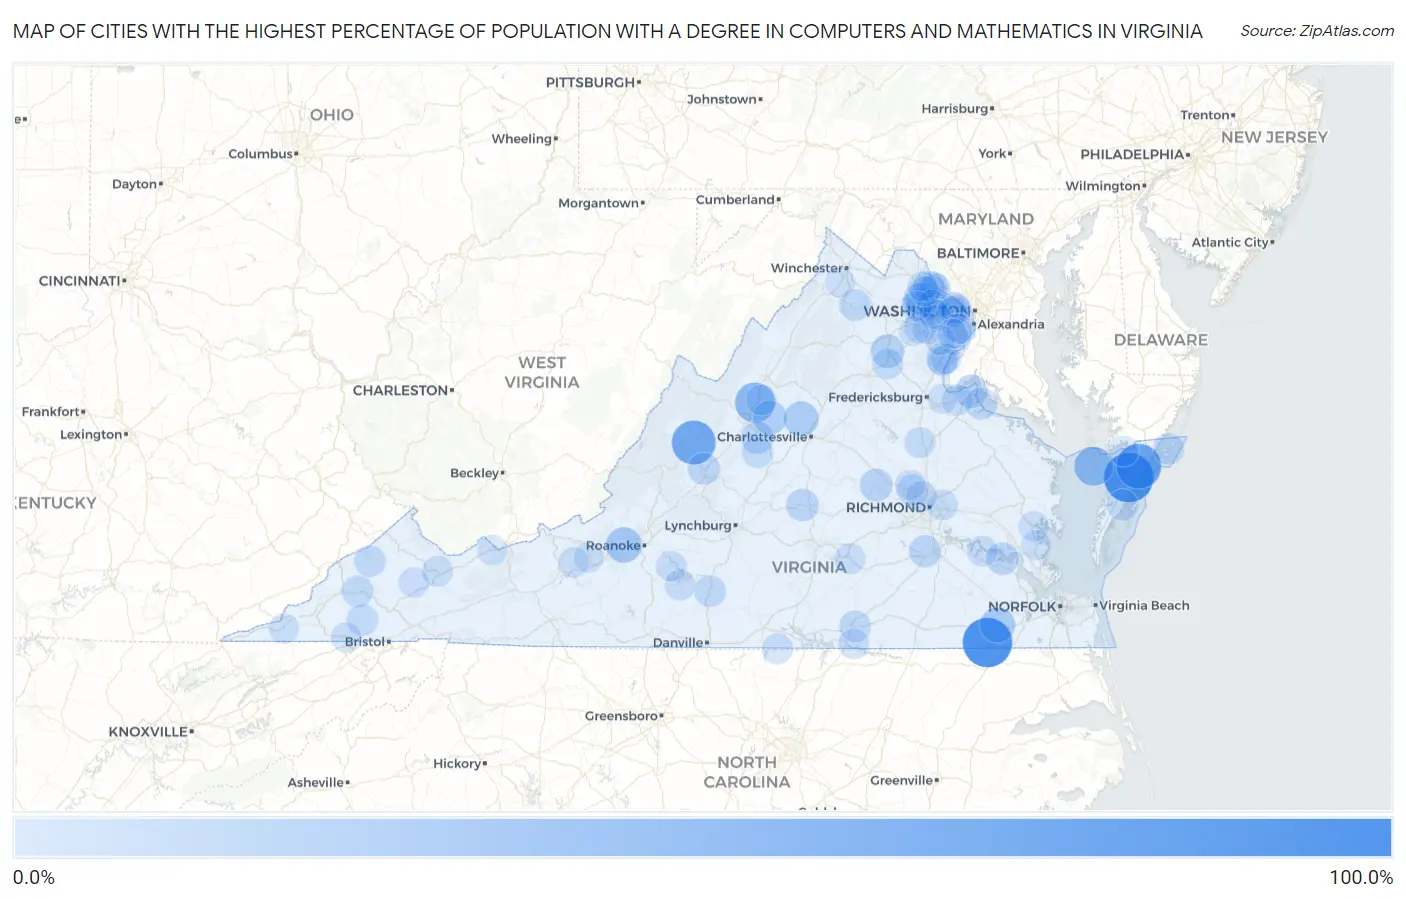
Map of Cities with the Highest Percentage of Population with a Degree in Computers and Mathematics in Virginia
0.0%
100.0%
Cities with the Highest Percentage of Population with a Degree in Computers and Mathematics in Virginia
| City | % Graduates | vs State | vs National | |
| 1. | Allison Gap | 100.0% | 6.6%(+93.4)#1 | 4.9%(+95.1)#4 |
| 2. | Southampton Meadows | 100.0% | 6.6%(+93.4)#2 | 4.9%(+95.1)#8 |
| 3. | Greenbush | 100.0% | 6.6%(+93.4)#3 | 4.9%(+95.1)#21 |
| 4. | Nelsonia | 78.8% | 6.6%(+72.2)#4 | 4.9%(+73.9)#42 |
| 5. | Goshen | 73.3% | 6.6%(+66.8)#5 | 4.9%(+68.4)#50 |
| 6. | Mount Sidney | 54.5% | 6.6%(+47.9)#6 | 4.9%(+49.6)#88 |
| 7. | Tangier | 50.0% | 6.6%(+43.4)#7 | 4.9%(+45.1)#101 |
| 8. | Glenvar | 35.0% | 6.6%(+28.5)#8 | 4.9%(+30.1)#220 |
| 9. | Carrsville | 33.3% | 6.6%(+26.8)#9 | 4.9%(+28.4)#236 |
| 10. | Free Union | 31.4% | 6.6%(+24.8)#10 | 4.9%(+26.5)#276 |
| 11. | Crimora | 27.5% | 6.6%(+20.9)#11 | 4.9%(+22.6)#343 |
| 12. | Opal | 26.1% | 6.6%(+19.5)#12 | 4.9%(+21.2)#380 |
| 13. | Aldie | 25.3% | 6.6%(+18.7)#13 | 4.9%(+20.4)#400 |
| 14. | Mcgaheysville | 25.1% | 6.6%(+18.6)#14 | 4.9%(+20.2)#402 |
| 15. | Dahlgren | 23.9% | 6.6%(+17.3)#15 | 4.9%(+19.0)#449 |
| 16. | Port Republic | 22.5% | 6.6%(+15.9)#16 | 4.9%(+17.6)#496 |
| 17. | Goochland | 22.0% | 6.6%(+15.4)#17 | 4.9%(+17.1)#521 |
| 18. | Lyndhurst | 21.3% | 6.6%(+14.7)#18 | 4.9%(+16.4)#549 |
| 19. | Buckingham Courthouse | 21.0% | 6.6%(+14.4)#19 | 4.9%(+16.1)#561 |
| 20. | Scotland | 20.8% | 6.6%(+14.3)#20 | 4.9%(+15.9)#567 |
| 21. | Matoaca | 19.8% | 6.6%(+13.2)#21 | 4.9%(+14.9)#629 |
| 22. | Navy | 19.8% | 6.6%(+13.2)#22 | 4.9%(+14.9)#630 |
| 23. | Dumfries | 19.3% | 6.6%(+12.7)#23 | 4.9%(+14.4)#659 |
| 24. | Loudoun Valley Estates | 18.9% | 6.6%(+12.3)#24 | 4.9%(+14.0)#681 |
| 25. | East Lexington | 18.7% | 6.6%(+12.1)#25 | 4.9%(+13.8)#695 |
| 26. | Colonial Beach | 17.9% | 6.6%(+11.3)#26 | 4.9%(+13.0)#752 |
| 27. | One Loudoun | 17.9% | 6.6%(+11.3)#27 | 4.9%(+13.0)#755 |
| 28. | Countryside | 17.7% | 6.6%(+11.2)#28 | 4.9%(+12.8)#772 |
| 29. | Skyland Estates | 17.7% | 6.6%(+11.1)#29 | 4.9%(+12.8)#776 |
| 30. | Hutchison | 17.7% | 6.6%(+11.1)#30 | 4.9%(+12.8)#777 |
| 31. | Gretna | 17.4% | 6.6%(+10.9)#31 | 4.9%(+12.5)#796 |
| 32. | La Crosse | 17.1% | 6.6%(+10.5)#32 | 4.9%(+12.2)#828 |
| 33. | Clinchco | 16.7% | 6.6%(+10.1)#33 | 4.9%(+11.8)#859 |
| 34. | Coeburn | 16.4% | 6.6%(+9.86)#34 | 4.9%(+11.5)#887 |
| 35. | Nickelsville | 16.1% | 6.6%(+9.56)#35 | 4.9%(+11.2)#914 |
| 36. | Chincoteague | 16.1% | 6.6%(+9.53)#36 | 4.9%(+11.2)#919 |
| 37. | Quinby | 16.1% | 6.6%(+9.53)#37 | 4.9%(+11.2)#920 |
| 38. | Arcola | 15.9% | 6.6%(+9.30)#38 | 4.9%(+11.0)#944 |
| 39. | Mcnair | 15.7% | 6.6%(+9.09)#39 | 4.9%(+10.8)#968 |
| 40. | Dulles Town Center | 15.6% | 6.6%(+9.04)#40 | 4.9%(+10.7)#974 |
| 41. | Bull Run | 15.5% | 6.6%(+8.88)#41 | 4.9%(+10.6)#987 |
| 42. | Brambleton | 15.3% | 6.6%(+8.72)#42 | 4.9%(+10.4)#1,007 |
| 43. | Lake Caroline | 15.2% | 6.6%(+8.59)#43 | 4.9%(+10.3)#1,023 |
| 44. | Innsbrook | 15.1% | 6.6%(+8.56)#44 | 4.9%(+10.2)#1,032 |
| 45. | Wintergreen | 14.8% | 6.6%(+8.20)#45 | 4.9%(+9.88)#1,059 |
| 46. | South Riding | 14.5% | 6.6%(+7.94)#46 | 4.9%(+9.62)#1,083 |
| 47. | University Center | 14.4% | 6.6%(+7.82)#47 | 4.9%(+9.50)#1,102 |
| 48. | Idylwood | 14.3% | 6.6%(+7.73)#48 | 4.9%(+9.41)#1,106 |
| 49. | Remington | 14.1% | 6.6%(+7.56)#49 | 4.9%(+9.24)#1,148 |
| 50. | Fair Lakes | 14.1% | 6.6%(+7.49)#50 | 4.9%(+9.17)#1,157 |
| 51. | North Garden | 14.1% | 6.6%(+7.49)#51 | 4.9%(+9.17)#1,159 |
| 52. | Cascades | 14.0% | 6.6%(+7.46)#52 | 4.9%(+9.14)#1,160 |
| 53. | King George | 14.0% | 6.6%(+7.46)#53 | 4.9%(+9.14)#1,161 |
| 54. | Floris | 13.9% | 6.6%(+7.31)#54 | 4.9%(+8.99)#1,177 |
| 55. | Cedar Bluff | 13.9% | 6.6%(+7.30)#55 | 4.9%(+8.97)#1,180 |
| 56. | Tysons | 13.8% | 6.6%(+7.27)#56 | 4.9%(+8.95)#1,183 |
| 57. | Dumbarton | 13.6% | 6.6%(+7.03)#57 | 4.9%(+8.71)#1,222 |
| 58. | Claremont | 13.5% | 6.6%(+6.97)#58 | 4.9%(+8.65)#1,232 |
| 59. | Penhook | 13.5% | 6.6%(+6.95)#59 | 4.9%(+8.63)#1,233 |
| 60. | Merrifield | 13.4% | 6.6%(+6.81)#60 | 4.9%(+8.48)#1,259 |
| 61. | Crewe | 13.2% | 6.6%(+6.61)#61 | 4.9%(+8.29)#1,298 |
| 62. | Virgilina | 13.0% | 6.6%(+6.47)#62 | 4.9%(+8.15)#1,331 |
| 63. | Westlake Corner | 13.0% | 6.6%(+6.43)#63 | 4.9%(+8.11)#1,338 |
| 64. | Weyers Cave | 12.8% | 6.6%(+6.25)#64 | 4.9%(+7.93)#1,366 |
| 65. | Highland Springs | 12.8% | 6.6%(+6.20)#65 | 4.9%(+7.88)#1,377 |
| 66. | Manassas Park | 12.7% | 6.6%(+6.15)#66 | 4.9%(+7.83)#1,386 |
| 67. | Bracey | 12.6% | 6.6%(+6.04)#67 | 4.9%(+7.71)#1,406 |
| 68. | Lorton | 12.5% | 6.6%(+5.92)#68 | 4.9%(+7.60)#1,454 |
| 69. | Honaker | 12.1% | 6.6%(+5.58)#69 | 4.9%(+7.26)#1,495 |
| 70. | Fairlawn | 12.0% | 6.6%(+5.40)#70 | 4.9%(+7.08)#1,535 |
| 71. | Keezletown | 12.0% | 6.6%(+5.38)#71 | 4.9%(+7.06)#1,538 |
| 72. | Pimmit Hills | 11.8% | 6.6%(+5.23)#72 | 4.9%(+6.91)#1,567 |
| 73. | Sully Square | 11.8% | 6.6%(+5.18)#73 | 4.9%(+6.86)#1,594 |
| 74. | Weber City | 11.7% | 6.6%(+5.12)#74 | 4.9%(+6.79)#1,608 |
| 75. | Newington | 11.7% | 6.6%(+5.09)#75 | 4.9%(+6.77)#1,612 |
| 76. | Gloucester Courthouse | 11.6% | 6.6%(+5.03)#76 | 4.9%(+6.71)#1,625 |
| 77. | Cherry Hill | 11.5% | 6.6%(+4.96)#77 | 4.9%(+6.64)#1,645 |
| 78. | Fair Oaks | 11.5% | 6.6%(+4.91)#78 | 4.9%(+6.58)#1,653 |
| 79. | Stone Ridge | 11.2% | 6.6%(+4.67)#79 | 4.9%(+6.35)#1,706 |
| 80. | Goose Creek | 11.2% | 6.6%(+4.66)#80 | 4.9%(+6.34)#1,707 |
| 81. | Wyndham | 11.2% | 6.6%(+4.64)#81 | 4.9%(+6.32)#1,710 |
| 82. | Saxis | 11.1% | 6.6%(+4.54)#82 | 4.9%(+6.22)#1,756 |
| 83. | Dunn Loring | 11.0% | 6.6%(+4.46)#83 | 4.9%(+6.14)#1,783 |
| 84. | Merrimac | 11.0% | 6.6%(+4.40)#84 | 4.9%(+6.08)#1,797 |
| 85. | Springfield | 11.0% | 6.6%(+4.38)#85 | 4.9%(+6.06)#1,801 |
| 86. | Belmont | 10.9% | 6.6%(+4.36)#86 | 4.9%(+6.04)#1,806 |
| 87. | Greenbriar | 10.9% | 6.6%(+4.31)#87 | 4.9%(+5.99)#1,824 |
| 88. | Stephens City | 10.8% | 6.6%(+4.24)#88 | 4.9%(+5.92)#1,843 |
| 89. | Jonesville | 10.8% | 6.6%(+4.20)#89 | 4.9%(+5.88)#1,851 |
| 90. | Franconia | 10.8% | 6.6%(+4.19)#90 | 4.9%(+5.87)#1,854 |
| 91. | Gloucester Point | 10.6% | 6.6%(+4.04)#91 | 4.9%(+5.72)#1,908 |
| 92. | Union Mill | 10.5% | 6.6%(+3.92)#92 | 4.9%(+5.60)#1,955 |
| 93. | Ashburn | 10.5% | 6.6%(+3.90)#93 | 4.9%(+5.58)#1,961 |
| 94. | Triangle | 10.4% | 6.6%(+3.83)#94 | 4.9%(+5.51)#1,982 |
| 95. | County Center | 10.4% | 6.6%(+3.82)#95 | 4.9%(+5.49)#1,987 |
| 96. | Moorefield | 10.4% | 6.6%(+3.81)#96 | 4.9%(+5.49)#1,989 |
| 97. | Linton Hall | 10.4% | 6.6%(+3.79)#97 | 4.9%(+5.47)#1,993 |
| 98. | Newington Forest | 10.3% | 6.6%(+3.74)#98 | 4.9%(+5.42)#2,017 |
| 99. | Passapatanzy | 10.3% | 6.6%(+3.71)#99 | 4.9%(+5.39)#2,024 |
| 100. | Bluefield | 10.3% | 6.6%(+3.70)#100 | 4.9%(+5.38)#2,028 |
Common Questions
What are the Top 10 Cities with the Highest Percentage of Population with a Degree in Computers and Mathematics in Virginia?
Top 10 Cities with the Highest Percentage of Population with a Degree in Computers and Mathematics in Virginia are:
#1
100.0%
#2
100.0%
#3
78.8%
#4
73.3%
#5
54.5%
#6
50.0%
#7
35.0%
#8
33.3%
#9
31.4%
#10
27.5%
What city has the Highest Percentage of Population with a Degree in Computers and Mathematics in Virginia?
Southampton Meadows has the Highest Percentage of Population with a Degree in Computers and Mathematics in Virginia with 100.0%.
What is the Percentage of Population with a Degree in Computers and Mathematics in the State of Virginia?
Percentage of Population with a Degree in Computers and Mathematics in Virginia is 6.6%.
What is the Percentage of Population with a Degree in Computers and Mathematics in the United States?
Percentage of Population with a Degree in Computers and Mathematics in the United States is 4.9%.