Cities with the Highest Percentage of Population with a Degree in Computers and Mathematics in New Jersey
RELATED REPORTS & OPTIONS
Computers and Mathematics
New Jersey
Compare Cities
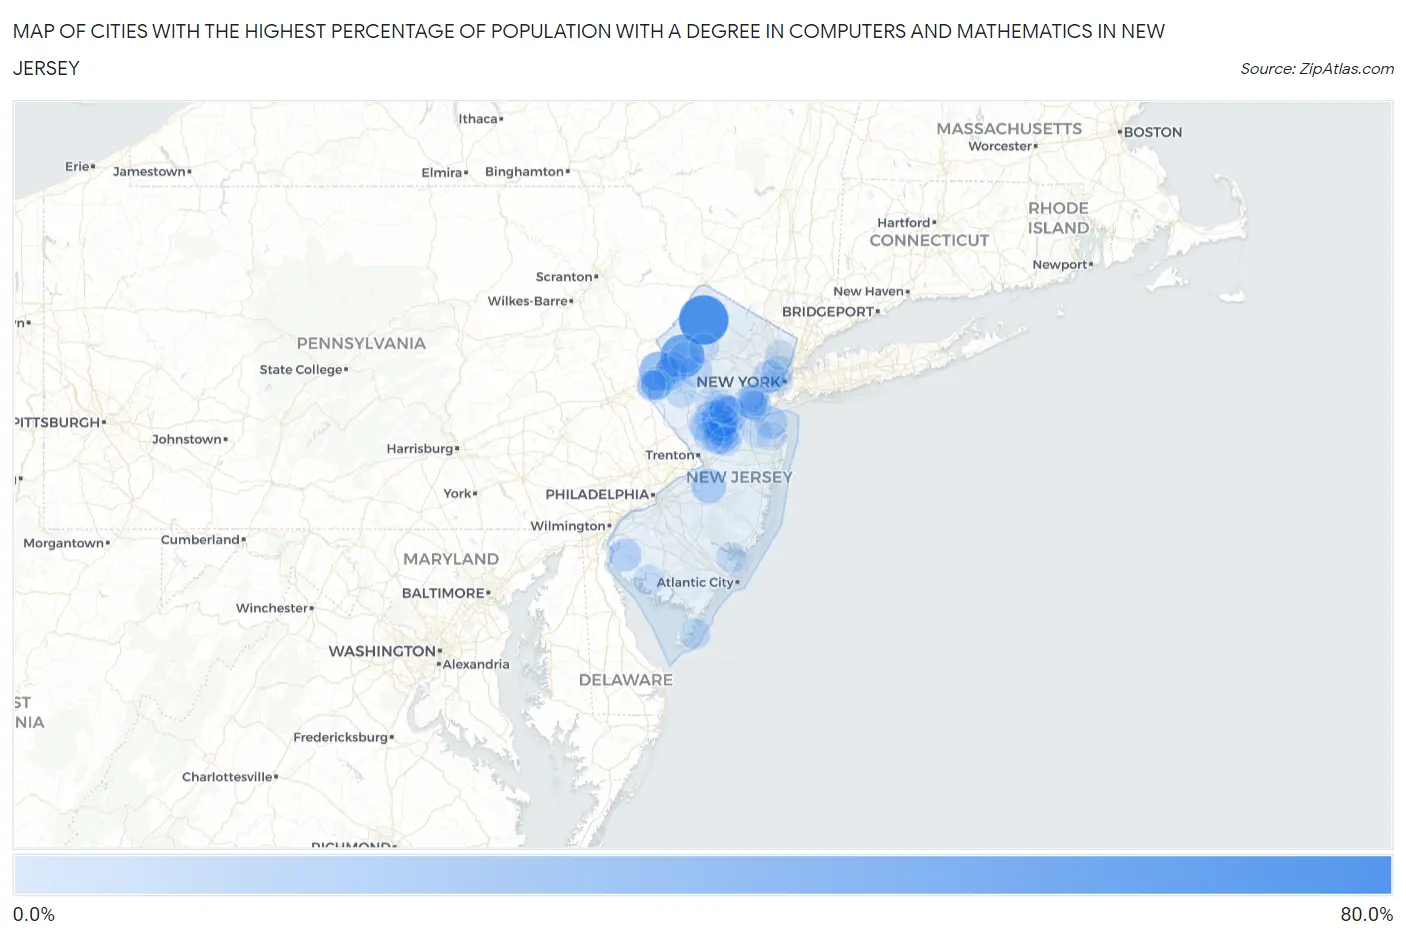
Map of Cities with the Highest Percentage of Population with a Degree in Computers and Mathematics in New Jersey
0.0%
80.0%
Cities with the Highest Percentage of Population with a Degree in Computers and Mathematics in New Jersey
| City | % Graduates | vs State | vs National | |
| 1. | Ross Corner | 68.4% | 6.2%(+62.3)#1 | 4.9%(+63.5)#56 |
| 2. | Great Meadows | 50.0% | 6.2%(+43.8)#2 | 4.9%(+45.1)#102 |
| 3. | English Creek | 38.3% | 6.2%(+32.1)#3 | 4.9%(+33.4)#183 |
| 4. | Hutchinson | 36.8% | 6.2%(+30.7)#4 | 4.9%(+31.9)#200 |
| 5. | Clyde | 34.4% | 6.2%(+28.2)#5 | 4.9%(+29.5)#225 |
| 6. | Windsor | 33.8% | 6.2%(+27.7)#6 | 4.9%(+29.0)#228 |
| 7. | Leeds Point | 28.0% | 6.2%(+21.9)#7 | 4.9%(+23.1)#327 |
| 8. | Pleasant Plains | 26.5% | 6.2%(+20.4)#8 | 4.9%(+21.6)#373 |
| 9. | Monroe Manor | 24.6% | 6.2%(+18.5)#9 | 4.9%(+19.7)#435 |
| 10. | Malaga | 23.9% | 6.2%(+17.7)#10 | 4.9%(+19.0)#447 |
| 11. | Juliustown | 22.2% | 6.2%(+16.1)#11 | 4.9%(+17.3)#516 |
| 12. | Rutgers University-Livingston Campus | 22.0% | 6.2%(+15.8)#12 | 4.9%(+17.1)#520 |
| 13. | Ramapo College Of New Jersey | 21.6% | 6.2%(+15.4)#13 | 4.9%(+16.7)#536 |
| 14. | Nesco | 20.7% | 6.2%(+14.5)#14 | 4.9%(+15.8)#570 |
| 15. | Hewitt | 20.4% | 6.2%(+14.3)#15 | 4.9%(+15.5)#582 |
| 16. | Princeton Meadows | 18.4% | 6.2%(+12.3)#16 | 4.9%(+13.5)#718 |
| 17. | Upper Stewartsville | 18.3% | 6.2%(+12.1)#17 | 4.9%(+13.4)#728 |
| 18. | Brass Castle | 17.8% | 6.2%(+11.7)#18 | 4.9%(+12.9)#763 |
| 19. | Quinton | 17.8% | 6.2%(+11.6)#19 | 4.9%(+12.9)#765 |
| 20. | Forsgate | 17.1% | 6.2%(+10.9)#20 | 4.9%(+12.2)#825 |
| 21. | Belle Mead | 16.9% | 6.2%(+10.8)#21 | 4.9%(+12.0)#841 |
| 22. | Ten Mile Run | 16.8% | 6.2%(+10.6)#22 | 4.9%(+11.9)#848 |
| 23. | Iselin | 16.7% | 6.2%(+10.6)#23 | 4.9%(+11.9)#850 |
| 24. | Dunellen Borough | 16.1% | 6.2%(+9.94)#24 | 4.9%(+11.2)#918 |
| 25. | Dayton | 16.0% | 6.2%(+9.83)#25 | 4.9%(+11.1)#930 |
| 26. | Oxford | 16.0% | 6.2%(+9.82)#26 | 4.9%(+11.1)#935 |
| 27. | South Bound Brook Borough | 15.8% | 6.2%(+9.63)#27 | 4.9%(+10.9)#948 |
| 28. | Deans | 15.7% | 6.2%(+9.57)#28 | 4.9%(+10.8)#958 |
| 29. | North Middletown | 15.2% | 6.2%(+9.06)#29 | 4.9%(+10.3)#1,015 |
| 30. | Heathcote | 14.5% | 6.2%(+8.31)#30 | 4.9%(+9.58)#1,090 |
| 31. | Monmouth Junction | 14.5% | 6.2%(+8.30)#31 | 4.9%(+9.57)#1,091 |
| 32. | Harrison | 14.2% | 6.2%(+8.07)#32 | 4.9%(+9.34)#1,141 |
| 33. | Troy Hills | 14.2% | 6.2%(+7.98)#33 | 4.9%(+9.26)#1,146 |
| 34. | Millington | 13.7% | 6.2%(+7.57)#34 | 4.9%(+8.85)#1,199 |
| 35. | Long Valley | 13.5% | 6.2%(+7.33)#35 | 4.9%(+8.60)#1,239 |
| 36. | Blackwells Mills | 13.5% | 6.2%(+7.30)#36 | 4.9%(+8.58)#1,244 |
| 37. | Kendall Park | 13.4% | 6.2%(+7.27)#37 | 4.9%(+8.54)#1,250 |
| 38. | Secaucus | 13.4% | 6.2%(+7.23)#38 | 4.9%(+8.51)#1,254 |
| 39. | Vienna | 13.3% | 6.2%(+7.12)#39 | 4.9%(+8.39)#1,282 |
| 40. | Avenel | 13.2% | 6.2%(+7.00)#40 | 4.9%(+8.27)#1,303 |
| 41. | Blawenburg | 13.1% | 6.2%(+6.96)#41 | 4.9%(+8.24)#1,310 |
| 42. | Woodlynne Borough | 13.0% | 6.2%(+6.86)#42 | 4.9%(+8.13)#1,336 |
| 43. | Butler Borough | 12.9% | 6.2%(+6.75)#43 | 4.9%(+8.02)#1,355 |
| 44. | Upper Pohatcong | 12.9% | 6.2%(+6.70)#44 | 4.9%(+7.98)#1,361 |
| 45. | Plainsboro Center | 12.6% | 6.2%(+6.43)#45 | 4.9%(+7.70)#1,407 |
| 46. | Sewaren | 12.1% | 6.2%(+5.91)#46 | 4.9%(+7.18)#1,512 |
| 47. | Skillman | 12.0% | 6.2%(+5.83)#47 | 4.9%(+7.11)#1,529 |
| 48. | Franklin Park | 11.9% | 6.2%(+5.76)#48 | 4.9%(+7.03)#1,543 |
| 49. | Caldwell Borough | 11.7% | 6.2%(+5.56)#49 | 4.9%(+6.83)#1,597 |
| 50. | The Hills | 11.6% | 6.2%(+5.42)#50 | 4.9%(+6.70)#1,630 |
| 51. | Clinton | 11.5% | 6.2%(+5.35)#51 | 4.9%(+6.63)#1,646 |
| 52. | Newport | 11.5% | 6.2%(+5.31)#52 | 4.9%(+6.58)#1,657 |
| 53. | North Wildwood | 11.4% | 6.2%(+5.26)#53 | 4.9%(+6.53)#1,668 |
| 54. | Englishtown Borough | 11.4% | 6.2%(+5.20)#54 | 4.9%(+6.47)#1,680 |
| 55. | Gillette | 11.3% | 6.2%(+5.15)#55 | 4.9%(+6.42)#1,695 |
| 56. | Jobstown | 11.1% | 6.2%(+4.94)#56 | 4.9%(+6.22)#1,753 |
| 57. | Lake Hiawatha | 11.1% | 6.2%(+4.92)#57 | 4.9%(+6.19)#1,775 |
| 58. | Hillsborough | 11.0% | 6.2%(+4.79)#58 | 4.9%(+6.07)#1,799 |
| 59. | Rahway | 11.0% | 6.2%(+4.79)#59 | 4.9%(+6.07)#1,800 |
| 60. | Greenwich | 10.9% | 6.2%(+4.77)#60 | 4.9%(+6.05)#1,804 |
| 61. | Jersey City | 10.9% | 6.2%(+4.74)#61 | 4.9%(+6.01)#1,811 |
| 62. | Pine Brook | 10.9% | 6.2%(+4.74)#62 | 4.9%(+6.01)#1,812 |
| 63. | Morganville | 10.9% | 6.2%(+4.73)#63 | 4.9%(+6.00)#1,819 |
| 64. | Raritan Borough | 10.9% | 6.2%(+4.72)#64 | 4.9%(+6.00)#1,821 |
| 65. | Crosswicks | 10.7% | 6.2%(+4.54)#65 | 4.9%(+5.81)#1,874 |
| 66. | Cedar Knolls | 10.6% | 6.2%(+4.48)#66 | 4.9%(+5.75)#1,894 |
| 67. | Port Republic | 10.6% | 6.2%(+4.43)#67 | 4.9%(+5.70)#1,913 |
| 68. | Rutgers University-Busch Campus | 10.6% | 6.2%(+4.39)#68 | 4.9%(+5.66)#1,927 |
| 69. | Packanack Lake | 10.4% | 6.2%(+4.24)#69 | 4.9%(+5.51)#1,981 |
| 70. | Cranbury | 10.1% | 6.2%(+3.96)#70 | 4.9%(+5.23)#2,082 |
| 71. | Sayreville Borough | 10.1% | 6.2%(+3.94)#71 | 4.9%(+5.21)#2,089 |
| 72. | Fairton | 10.0% | 6.2%(+3.83)#72 | 4.9%(+5.11)#2,129 |
| 73. | The Ponds | 10.0% | 6.2%(+3.80)#73 | 4.9%(+5.07)#2,170 |
| 74. | Wallington Borough | 9.9% | 6.2%(+3.74)#74 | 4.9%(+5.01)#2,188 |
| 75. | Finderne | 9.8% | 6.2%(+3.59)#75 | 4.9%(+4.87)#2,243 |
| 76. | Robbinsville Center | 9.7% | 6.2%(+3.53)#76 | 4.9%(+4.81)#2,262 |
| 77. | Carlls Corner | 9.7% | 6.2%(+3.51)#77 | 4.9%(+4.78)#2,272 |
| 78. | Bradley Gardens | 9.6% | 6.2%(+3.46)#78 | 4.9%(+4.73)#2,305 |
| 79. | Grenloch | 9.5% | 6.2%(+3.33)#79 | 4.9%(+4.60)#2,378 |
| 80. | New Providence Borough | 9.5% | 6.2%(+3.32)#80 | 4.9%(+4.59)#2,381 |
| 81. | Somerset | 9.4% | 6.2%(+3.19)#81 | 4.9%(+4.46)#2,446 |
| 82. | Byram Center | 9.4% | 6.2%(+3.19)#82 | 4.9%(+4.46)#2,449 |
| 83. | Woodbridge | 9.3% | 6.2%(+3.11)#83 | 4.9%(+4.39)#2,475 |
| 84. | Franklin Center | 9.3% | 6.2%(+3.11)#84 | 4.9%(+4.38)#2,476 |
| 85. | Carteret Borough | 9.3% | 6.2%(+3.09)#85 | 4.9%(+4.37)#2,487 |
| 86. | Parsippany | 9.2% | 6.2%(+3.04)#86 | 4.9%(+4.31)#2,514 |
| 87. | Phillipsburg | 9.2% | 6.2%(+3.03)#87 | 4.9%(+4.31)#2,516 |
| 88. | Princeton | 9.1% | 6.2%(+2.98)#88 | 4.9%(+4.25)#2,540 |
| 89. | Franklin Borough | 9.0% | 6.2%(+2.83)#89 | 4.9%(+4.11)#2,623 |
| 90. | Oakland Borough | 9.0% | 6.2%(+2.83)#90 | 4.9%(+4.11)#2,626 |
| 91. | East Newark Borough | 9.0% | 6.2%(+2.82)#91 | 4.9%(+4.09)#2,632 |
| 92. | Towaco | 8.9% | 6.2%(+2.74)#92 | 4.9%(+4.02)#2,679 |
| 93. | Longport Borough | 8.9% | 6.2%(+2.73)#93 | 4.9%(+4.01)#2,684 |
| 94. | Lower Berkshire Valley | 8.8% | 6.2%(+2.63)#94 | 4.9%(+3.90)#2,727 |
| 95. | Stanhope Borough | 8.7% | 6.2%(+2.58)#95 | 4.9%(+3.85)#2,765 |
| 96. | Hackensack | 8.7% | 6.2%(+2.56)#96 | 4.9%(+3.84)#2,773 |
| 97. | Highland Park Borough | 8.7% | 6.2%(+2.55)#97 | 4.9%(+3.82)#2,781 |
| 98. | Mount Tabor | 8.7% | 6.2%(+2.52)#98 | 4.9%(+3.79)#2,799 |
| 99. | Manville Borough | 8.7% | 6.2%(+2.50)#99 | 4.9%(+3.77)#2,805 |
| 100. | Lincroft | 8.7% | 6.2%(+2.48)#100 | 4.9%(+3.76)#2,813 |
Common Questions
What are the Top 10 Cities with the Highest Percentage of Population with a Degree in Computers and Mathematics in New Jersey?
Top 10 Cities with the Highest Percentage of Population with a Degree in Computers and Mathematics in New Jersey are:
#1
68.4%
#2
50.0%
#3
36.8%
#4
34.4%
#5
26.5%
#6
22.2%
#7
18.4%
#8
18.3%
#9
17.8%
#10
17.8%
What city has the Highest Percentage of Population with a Degree in Computers and Mathematics in New Jersey?
Ross Corner has the Highest Percentage of Population with a Degree in Computers and Mathematics in New Jersey with 68.4%.
What is the Percentage of Population with a Degree in Computers and Mathematics in the State of New Jersey?
Percentage of Population with a Degree in Computers and Mathematics in New Jersey is 6.2%.
What is the Percentage of Population with a Degree in Computers and Mathematics in the United States?
Percentage of Population with a Degree in Computers and Mathematics in the United States is 4.9%.