Cities with the Highest Percentage of Population with a Degree in Computers and Mathematics in Pennsylvania
RELATED REPORTS & OPTIONS
Computers and Mathematics
Pennsylvania
Compare Cities
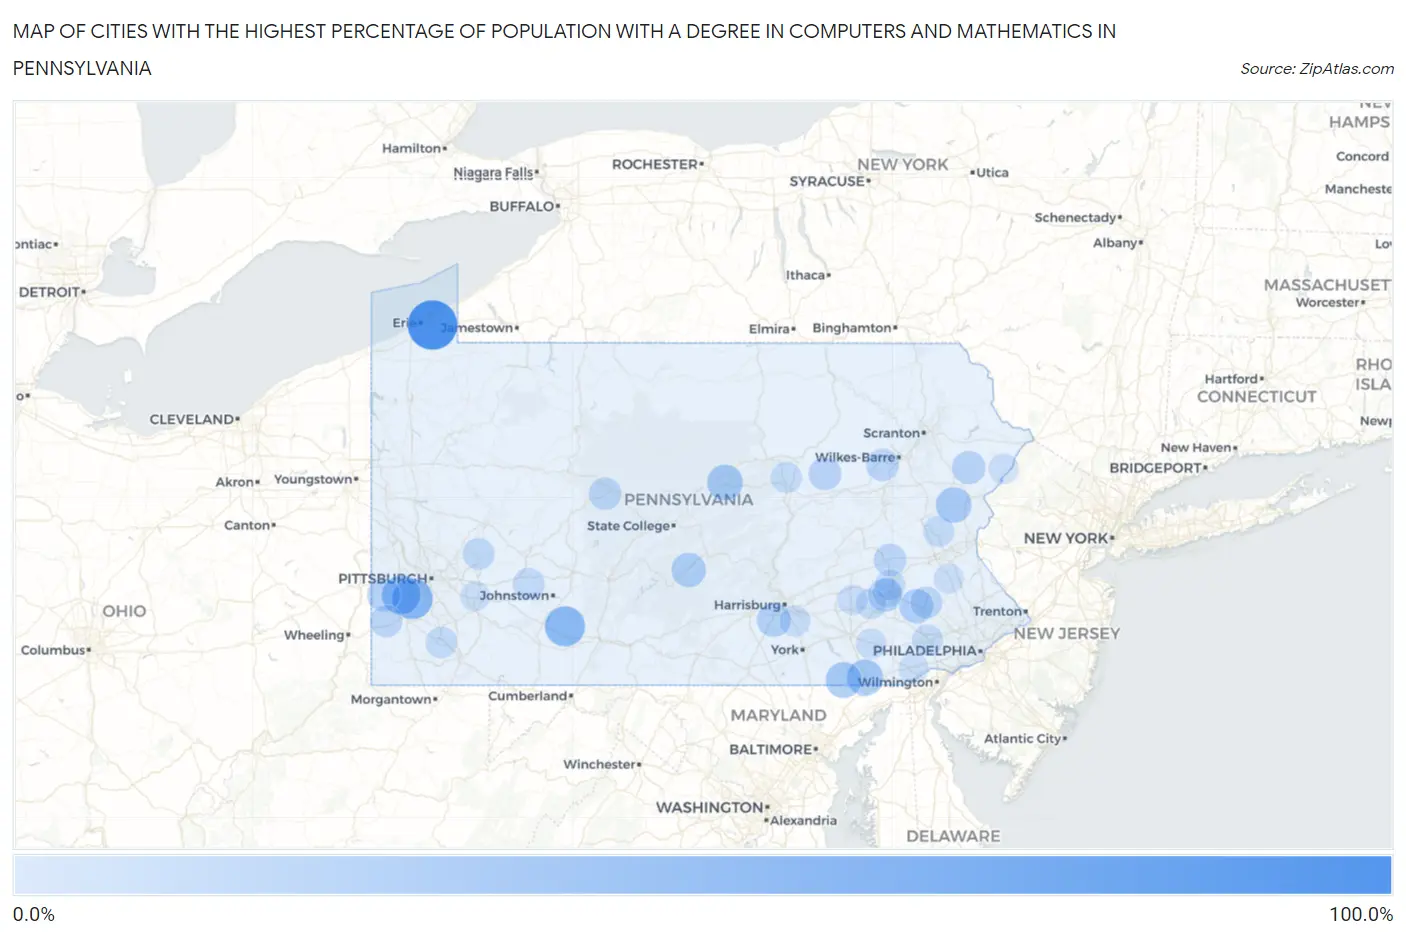
Map of Cities with the Highest Percentage of Population with a Degree in Computers and Mathematics in Pennsylvania
0.0%
100.0%
Cities with the Highest Percentage of Population with a Degree in Computers and Mathematics in Pennsylvania
| City | % Graduates | vs State | vs National | |
| 1. | Penn State Erie Behrend | 100.0% | 4.6%(+95.4)#1 | 4.9%(+95.1)#1 |
| 2. | Culp | 62.5% | 4.6%(+57.9)#2 | 4.9%(+57.6)#65 |
| 3. | Arona Borough | 60.5% | 4.6%(+56.0)#3 | 4.9%(+55.6)#69 |
| 4. | Hendersonville | 59.1% | 4.6%(+54.5)#4 | 4.9%(+54.2)#76 |
| 5. | Cairnbrook | 57.1% | 4.6%(+52.6)#5 | 4.9%(+52.2)#79 |
| 6. | Eagleville Cdp Centre County | 52.8% | 4.6%(+48.2)#6 | 4.9%(+47.9)#92 |
| 7. | Southview | 51.1% | 4.6%(+46.6)#7 | 4.9%(+46.2)#97 |
| 8. | Nealmont | 50.0% | 4.6%(+45.4)#8 | 4.9%(+45.1)#117 |
| 9. | Wakefield | 39.4% | 4.6%(+34.8)#9 | 4.9%(+34.5)#174 |
| 10. | Susquehanna Trails | 38.2% | 4.6%(+33.7)#10 | 4.9%(+33.4)#184 |
| 11. | Rote | 37.3% | 4.6%(+32.7)#11 | 4.9%(+32.4)#196 |
| 12. | Brodheadsville | 36.0% | 4.6%(+31.5)#12 | 4.9%(+31.1)#210 |
| 13. | York Haven Borough | 33.3% | 4.6%(+28.8)#13 | 4.9%(+28.4)#231 |
| 14. | Roseville Borough | 33.3% | 4.6%(+28.8)#14 | 4.9%(+28.4)#242 |
| 15. | Mattawana | 32.0% | 4.6%(+27.4)#15 | 4.9%(+27.1)#263 |
| 16. | Douglassville | 30.0% | 4.6%(+25.4)#16 | 4.9%(+25.1)#287 |
| 17. | Messiah College | 29.4% | 4.6%(+24.9)#17 | 4.9%(+24.5)#297 |
| 18. | Lykens Borough | 28.8% | 4.6%(+24.2)#18 | 4.9%(+23.9)#307 |
| 19. | Springmont | 28.1% | 4.6%(+23.5)#19 | 4.9%(+23.2)#323 |
| 20. | Cross Creek | 26.8% | 4.6%(+22.3)#20 | 4.9%(+21.9)#362 |
| 21. | Mountainhome | 26.8% | 4.6%(+22.3)#21 | 4.9%(+21.9)#364 |
| 22. | Wallaceton Borough | 26.3% | 4.6%(+21.8)#22 | 4.9%(+21.4)#375 |
| 23. | Elgin Borough | 25.9% | 4.6%(+21.4)#23 | 4.9%(+21.0)#385 |
| 24. | Shippensburg Borough | 25.9% | 4.6%(+21.3)#24 | 4.9%(+21.0)#386 |
| 25. | Bear Lake Borough | 25.0% | 4.6%(+20.4)#25 | 4.9%(+20.1)#417 |
| 26. | Iola | 25.0% | 4.6%(+20.4)#26 | 4.9%(+20.1)#420 |
| 27. | Big Run Borough | 23.8% | 4.6%(+19.3)#27 | 4.9%(+18.9)#453 |
| 28. | Friendsville Borough | 23.8% | 4.6%(+19.3)#28 | 4.9%(+18.9)#455 |
| 29. | Edenburg | 23.7% | 4.6%(+19.2)#29 | 4.9%(+18.8)#458 |
| 30. | Hyde | 23.0% | 4.6%(+18.4)#30 | 4.9%(+18.1)#483 |
| 31. | Sheatown | 22.9% | 4.6%(+18.4)#31 | 4.9%(+18.0)#486 |
| 32. | Juniata Gap | 22.4% | 4.6%(+17.9)#32 | 4.9%(+17.5)#497 |
| 33. | Halfway House | 21.6% | 4.6%(+17.0)#33 | 4.9%(+16.7)#541 |
| 34. | Taylorstown | 21.2% | 4.6%(+16.7)#34 | 4.9%(+16.3)#550 |
| 35. | Rockhill Borough | 21.1% | 4.6%(+16.5)#35 | 4.9%(+16.2)#556 |
| 36. | Pleasant View | 20.0% | 4.6%(+15.4)#36 | 4.9%(+15.1)#594 |
| 37. | Dunlevy Borough | 20.0% | 4.6%(+15.4)#37 | 4.9%(+15.1)#597 |
| 38. | Washingtonville Borough | 20.0% | 4.6%(+15.4)#38 | 4.9%(+15.1)#604 |
| 39. | Shanksville Borough | 20.0% | 4.6%(+15.4)#39 | 4.9%(+15.1)#610 |
| 40. | Sugar Grove Borough | 19.5% | 4.6%(+15.0)#40 | 4.9%(+14.6)#644 |
| 41. | Robinson | 19.4% | 4.6%(+14.9)#41 | 4.9%(+14.6)#649 |
| 42. | Hiller | 19.0% | 4.6%(+14.4)#42 | 4.9%(+14.1)#674 |
| 43. | Eagle Creek | 18.8% | 4.6%(+14.2)#43 | 4.9%(+13.9)#691 |
| 44. | Koppel Borough | 18.6% | 4.6%(+14.0)#44 | 4.9%(+13.7)#704 |
| 45. | Johnsonburg Borough | 18.3% | 4.6%(+13.8)#45 | 4.9%(+13.5)#724 |
| 46. | Frazer | 18.3% | 4.6%(+13.8)#46 | 4.9%(+13.4)#727 |
| 47. | Collingdale Borough | 18.2% | 4.6%(+13.6)#47 | 4.9%(+13.3)#729 |
| 48. | Schuylkill Haven Borough | 18.2% | 4.6%(+13.6)#48 | 4.9%(+13.3)#739 |
| 49. | Cherryville | 17.9% | 4.6%(+13.3)#49 | 4.9%(+13.0)#754 |
| 50. | Homestead Borough | 17.9% | 4.6%(+13.3)#50 | 4.9%(+13.0)#756 |
| 51. | Conneaut Lake Borough | 17.9% | 4.6%(+13.3)#51 | 4.9%(+13.0)#761 |
| 52. | Conneautville Borough | 17.7% | 4.6%(+13.2)#52 | 4.9%(+12.8)#771 |
| 53. | Dewart | 17.7% | 4.6%(+13.2)#53 | 4.9%(+12.8)#773 |
| 54. | Freeland Borough | 17.7% | 4.6%(+13.1)#54 | 4.9%(+12.8)#778 |
| 55. | Hartleton Borough | 17.6% | 4.6%(+13.1)#55 | 4.9%(+12.8)#781 |
| 56. | Etna Borough | 17.6% | 4.6%(+13.1)#56 | 4.9%(+12.7)#784 |
| 57. | Gratz Borough | 17.5% | 4.6%(+12.9)#57 | 4.9%(+12.6)#791 |
| 58. | Tremont Borough | 17.4% | 4.6%(+12.8)#58 | 4.9%(+12.5)#802 |
| 59. | Lenhartsville Borough | 17.1% | 4.6%(+12.6)#59 | 4.9%(+12.2)#819 |
| 60. | Exton | 17.1% | 4.6%(+12.6)#60 | 4.9%(+12.2)#820 |
| 61. | Salona | 17.1% | 4.6%(+12.5)#61 | 4.9%(+12.2)#829 |
| 62. | Laureldale Borough | 17.0% | 4.6%(+12.5)#62 | 4.9%(+12.1)#833 |
| 63. | Glen Rock Borough | 16.6% | 4.6%(+12.0)#63 | 4.9%(+11.7)#879 |
| 64. | Valley Green | 16.5% | 4.6%(+12.0)#64 | 4.9%(+11.7)#880 |
| 65. | Franklintown Borough | 16.4% | 4.6%(+11.9)#65 | 4.9%(+11.5)#891 |
| 66. | Mayfield Borough | 16.4% | 4.6%(+11.8)#66 | 4.9%(+11.5)#892 |
| 67. | East Rochester Borough | 16.3% | 4.6%(+11.7)#67 | 4.9%(+11.4)#900 |
| 68. | Midway Borough | 16.1% | 4.6%(+11.6)#68 | 4.9%(+11.2)#912 |
| 69. | Carroll Valley Borough | 16.1% | 4.6%(+11.5)#69 | 4.9%(+11.2)#923 |
| 70. | Dickson City Borough | 16.0% | 4.6%(+11.4)#70 | 4.9%(+11.1)#936 |
| 71. | Royalton Borough | 16.0% | 4.6%(+11.4)#71 | 4.9%(+11.1)#937 |
| 72. | Avis Borough | 15.6% | 4.6%(+11.1)#72 | 4.9%(+10.7)#971 |
| 73. | North Irwin Borough | 15.6% | 4.6%(+11.0)#73 | 4.9%(+10.7)#979 |
| 74. | Reinholds | 15.5% | 4.6%(+10.9)#74 | 4.9%(+10.6)#986 |
| 75. | Fox Chase | 15.3% | 4.6%(+10.8)#75 | 4.9%(+10.4)#1,006 |
| 76. | Long Branch Borough | 15.2% | 4.6%(+10.6)#76 | 4.9%(+10.3)#1,022 |
| 77. | Sadsburyville | 15.0% | 4.6%(+10.5)#77 | 4.9%(+10.2)#1,041 |
| 78. | Luzerne Borough | 14.8% | 4.6%(+10.2)#78 | 4.9%(+9.88)#1,058 |
| 79. | Paradise | 14.7% | 4.6%(+10.2)#79 | 4.9%(+9.85)#1,062 |
| 80. | Georgetown Borough | 14.7% | 4.6%(+10.2)#80 | 4.9%(+9.81)#1,065 |
| 81. | Pocono Ranch Lands | 14.6% | 4.6%(+10.1)#81 | 4.9%(+9.73)#1,074 |
| 82. | Monroe Borough | 14.6% | 4.6%(+10.0)#82 | 4.9%(+9.69)#1,077 |
| 83. | Williamstown Borough | 14.3% | 4.6%(+9.73)#83 | 4.9%(+9.39)#1,109 |
| 84. | Schaefferstown | 14.3% | 4.6%(+9.73)#84 | 4.9%(+9.39)#1,112 |
| 85. | Wilmore Borough | 14.3% | 4.6%(+9.73)#85 | 4.9%(+9.39)#1,118 |
| 86. | East Stroudsburg Borough | 14.1% | 4.6%(+9.59)#86 | 4.9%(+9.25)#1,147 |
| 87. | Troy Borough | 14.0% | 4.6%(+9.47)#87 | 4.9%(+9.13)#1,162 |
| 88. | Elizabeth Borough | 13.9% | 4.6%(+9.36)#88 | 4.9%(+9.02)#1,172 |
| 89. | Belle Vernon Borough | 13.9% | 4.6%(+9.34)#89 | 4.9%(+8.99)#1,174 |
| 90. | Spinnerstown | 13.8% | 4.6%(+9.28)#90 | 4.9%(+8.94)#1,184 |
| 91. | Wellersburg Borough | 13.6% | 4.6%(+9.08)#91 | 4.9%(+8.74)#1,221 |
| 92. | Modena Borough | 13.6% | 4.6%(+9.03)#92 | 4.9%(+8.69)#1,227 |
| 93. | East Side Borough | 13.5% | 4.6%(+8.96)#93 | 4.9%(+8.62)#1,238 |
| 94. | Grapeville | 13.5% | 4.6%(+8.93)#94 | 4.9%(+8.59)#1,241 |
| 95. | Toughkenamon | 13.4% | 4.6%(+8.83)#95 | 4.9%(+8.49)#1,258 |
| 96. | Colony Park | 13.4% | 4.6%(+8.82)#96 | 4.9%(+8.48)#1,260 |
| 97. | Yorkana Borough | 13.3% | 4.6%(+8.78)#97 | 4.9%(+8.44)#1,271 |
| 98. | Cresson Borough | 13.3% | 4.6%(+8.75)#98 | 4.9%(+8.41)#1,279 |
| 99. | Mcewensville Borough | 13.2% | 4.6%(+8.68)#99 | 4.9%(+8.34)#1,289 |
| 100. | Catawissa Borough | 13.2% | 4.6%(+8.66)#100 | 4.9%(+8.31)#1,293 |
Common Questions
What are the Top 10 Cities with the Highest Percentage of Population with a Degree in Computers and Mathematics in Pennsylvania?
Top 10 Cities with the Highest Percentage of Population with a Degree in Computers and Mathematics in Pennsylvania are:
#1
100.0%
#2
59.1%
#3
57.1%
#4
51.1%
#5
39.4%
#6
38.2%
#7
37.3%
#8
36.0%
#9
32.0%
#10
30.0%
What city has the Highest Percentage of Population with a Degree in Computers and Mathematics in Pennsylvania?
Penn State Erie Behrend has the Highest Percentage of Population with a Degree in Computers and Mathematics in Pennsylvania with 100.0%.
What is the Percentage of Population with a Degree in Computers and Mathematics in the State of Pennsylvania?
Percentage of Population with a Degree in Computers and Mathematics in Pennsylvania is 4.6%.
What is the Percentage of Population with a Degree in Computers and Mathematics in the United States?
Percentage of Population with a Degree in Computers and Mathematics in the United States is 4.9%.