Bangor, CA Map & Demographics
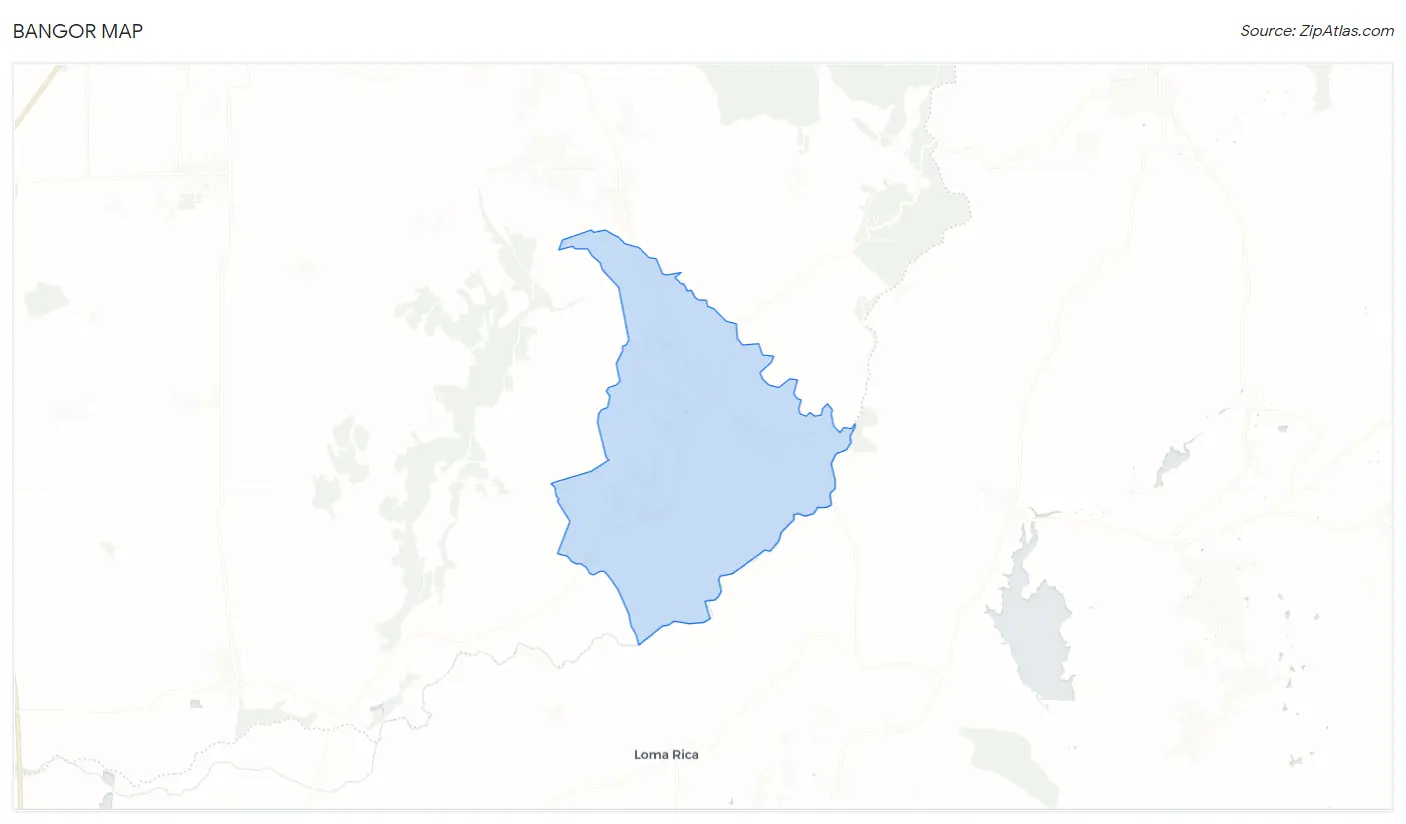
Bangor Map
Bangor Overview
$55,705
PER CAPITA INCOME
$96,250
AVG FAMILY INCOME
$92,750
AVG HOUSEHOLD INCOME
73.4%
WAGE / INCOME GAP [ % ]
26.6¢/ $1
WAGE / INCOME GAP [ $ ]
0.49
INEQUALITY / GINI INDEX
399
TOTAL POPULATION
207
MALE POPULATION
192
FEMALE POPULATION
107.81
MALES / 100 FEMALES
92.75
FEMALES / 100 MALES
66.7
MEDIAN AGE
2.7
AVG FAMILY SIZE
2.2
AVG HOUSEHOLD SIZE
95
LABOR FORCE [ PEOPLE ]
26.2%
PERCENT IN LABOR FORCE
Bangor Zip Codes
Bangor Area Codes
Income in Bangor
Income Overview in Bangor
Per Capita Income in Bangor is $55,705, while median incomes of families and households are $96,250 and $92,750 respectively.
| Characteristic | Number | Measure |
| Per Capita Income | 399 | $55,705 |
| Median Family Income | 118 | $96,250 |
| Mean Family Income | 118 | $132,148 |
| Median Household Income | 185 | $92,750 |
| Mean Household Income | 185 | $122,315 |
| Income Deficit | 118 | $0 |
| Wage / Income Gap (%) | 399 | 73.45% |
| Wage / Income Gap ($) | 399 | 26.55¢ per $1 |
| Gini / Inequality Index | 399 | 0.49 |
Earnings by Sex in Bangor
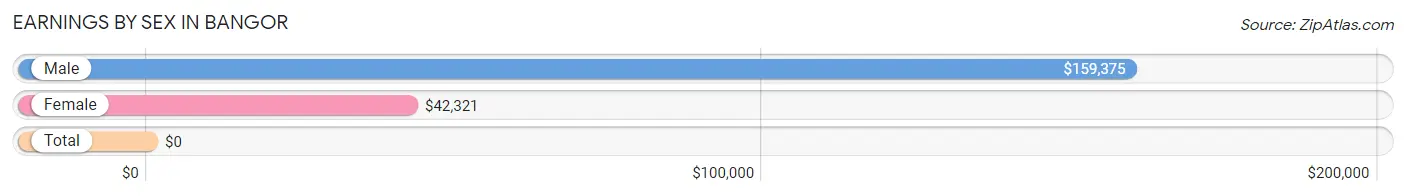
| Sex | Number | Average Earnings |
| Male | 46 (41.1%) | $159,375 |
| Female | 66 (58.9%) | $42,321 |
| Total | 112 (100.0%) | $0 |
Earnings by Sex by Income Bracket in Bangor
The most common earnings brackets in Bangor are $100,000+ for men (32 | 69.6%) and $40,000 to $44,999 for women (24 | 36.4%).
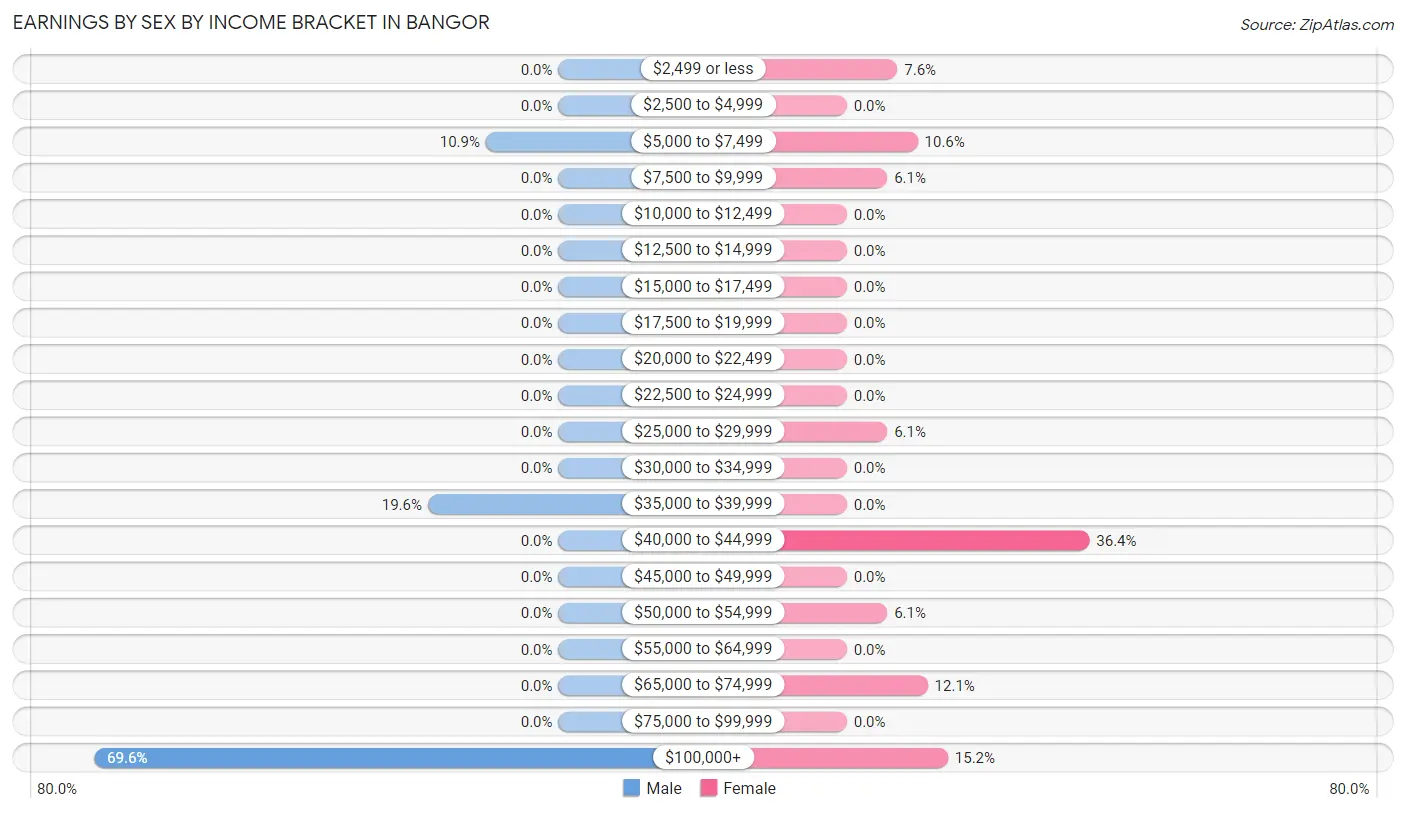
| Income | Male | Female |
| $2,499 or less | 0 (0.0%) | 5 (7.6%) |
| $2,500 to $4,999 | 0 (0.0%) | 0 (0.0%) |
| $5,000 to $7,499 | 5 (10.9%) | 7 (10.6%) |
| $7,500 to $9,999 | 0 (0.0%) | 4 (6.1%) |
| $10,000 to $12,499 | 0 (0.0%) | 0 (0.0%) |
| $12,500 to $14,999 | 0 (0.0%) | 0 (0.0%) |
| $15,000 to $17,499 | 0 (0.0%) | 0 (0.0%) |
| $17,500 to $19,999 | 0 (0.0%) | 0 (0.0%) |
| $20,000 to $22,499 | 0 (0.0%) | 0 (0.0%) |
| $22,500 to $24,999 | 0 (0.0%) | 0 (0.0%) |
| $25,000 to $29,999 | 0 (0.0%) | 4 (6.1%) |
| $30,000 to $34,999 | 0 (0.0%) | 0 (0.0%) |
| $35,000 to $39,999 | 9 (19.6%) | 0 (0.0%) |
| $40,000 to $44,999 | 0 (0.0%) | 24 (36.4%) |
| $45,000 to $49,999 | 0 (0.0%) | 0 (0.0%) |
| $50,000 to $54,999 | 0 (0.0%) | 4 (6.1%) |
| $55,000 to $64,999 | 0 (0.0%) | 0 (0.0%) |
| $65,000 to $74,999 | 0 (0.0%) | 8 (12.1%) |
| $75,000 to $99,999 | 0 (0.0%) | 0 (0.0%) |
| $100,000+ | 32 (69.6%) | 10 (15.1%) |
| Total | 46 (100.0%) | 66 (100.0%) |
Earnings by Sex by Educational Attainment in Bangor
Average earnings in Bangor are $159,375 for men and $42,321 for women, a difference of 73.5%. Men with an educational attainment of college or associate's degree enjoy the highest average annual earnings of $158,125, while those with college or associate's degree education earn the least with $158,125. Women with an educational attainment of high school diploma earn the most with the average annual earnings of $41,875, while those with high school diploma education have the smallest earnings of $41,875.
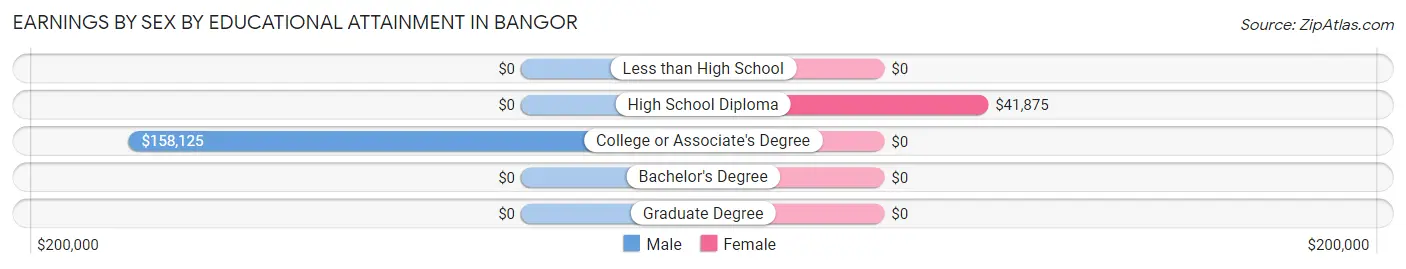
| Educational Attainment | Male Income | Female Income |
| Less than High School | - | - |
| High School Diploma | - | - |
| College or Associate's Degree | $158,125 | $0 |
| Bachelor's Degree | - | - |
| Graduate Degree | - | - |
| Total | $159,375 | $42,321 |
Family Income in Bangor
Family Income Brackets in Bangor
According to the Bangor family income data, there are 24 families falling into the $75,000 to $99,999 income range, which is the most common income bracket and makes up 20.3% of all families.
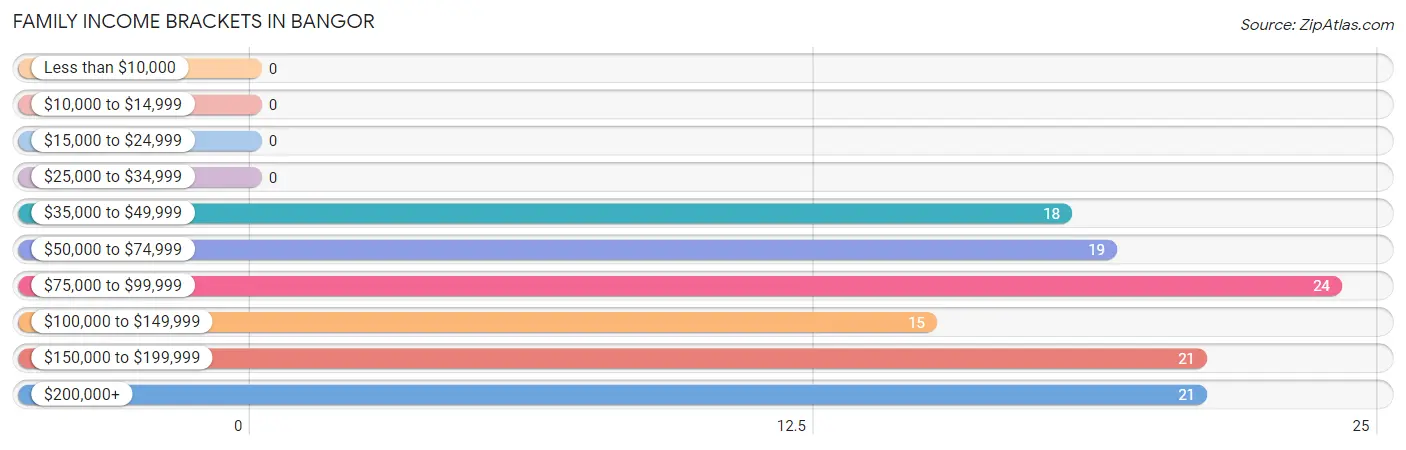
| Income Bracket | # Families | % Families |
| Less than $10,000 | 0 | 0.0% |
| $10,000 to $14,999 | 0 | 0.0% |
| $15,000 to $24,999 | 0 | 0.0% |
| $25,000 to $34,999 | 0 | 0.0% |
| $35,000 to $49,999 | 18 | 15.3% |
| $50,000 to $74,999 | 19 | 16.1% |
| $75,000 to $99,999 | 24 | 20.3% |
| $100,000 to $149,999 | 15 | 12.7% |
| $150,000 to $199,999 | 21 | 17.8% |
| $200,000+ | 21 | 17.8% |
Family Income by Famaliy Size in Bangor
4-person families (22 | 18.6%) account for the highest median family income in Bangor with $164,375 per family, while 4-person families (22 | 18.6%) have the highest median income of $41,094 per family member.
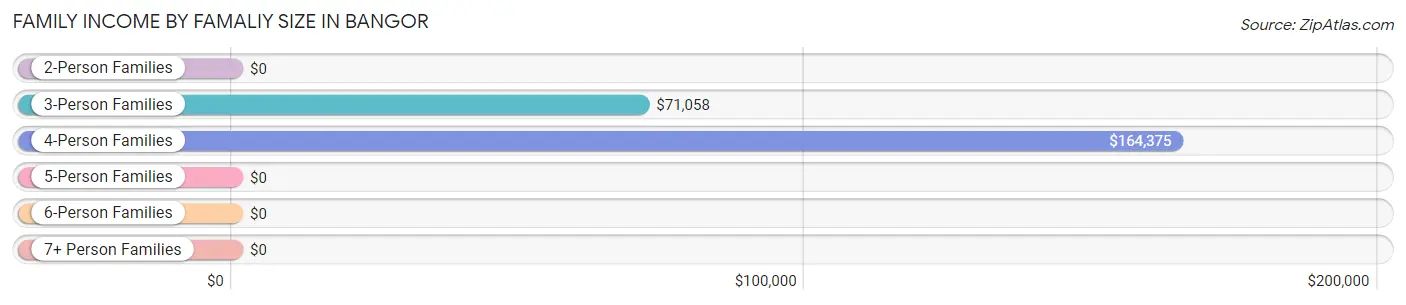
| Income Bracket | # Families | Median Income |
| 2-Person Families | 45 (38.1%) | $0 |
| 3-Person Families | 51 (43.2%) | $71,058 |
| 4-Person Families | 22 (18.6%) | $164,375 |
| 5-Person Families | 0 (0.0%) | $0 |
| 6-Person Families | 0 (0.0%) | $0 |
| 7+ Person Families | 0 (0.0%) | $0 |
| Total | 118 (100.0%) | $96,250 |
Family Income by Number of Earners in Bangor
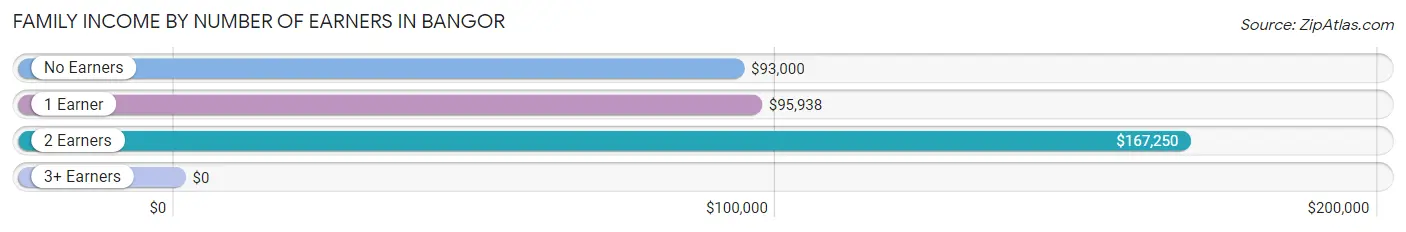
| Number of Earners | # Families | Median Income |
| No Earners | 52 (44.1%) | $93,000 |
| 1 Earner | 41 (34.7%) | $95,938 |
| 2 Earners | 25 (21.2%) | $167,250 |
| 3+ Earners | 0 (0.0%) | $0 |
| Total | 118 (100.0%) | $96,250 |
Household Income in Bangor
Household Income Brackets in Bangor
With 39 households falling in the category, the $200,000+ income range is the most frequent in Bangor, accounting for 21.1% of all households. In contrast, only 4 households (2.2%) fall into the less than $10,000 income bracket, making it the least populous group.
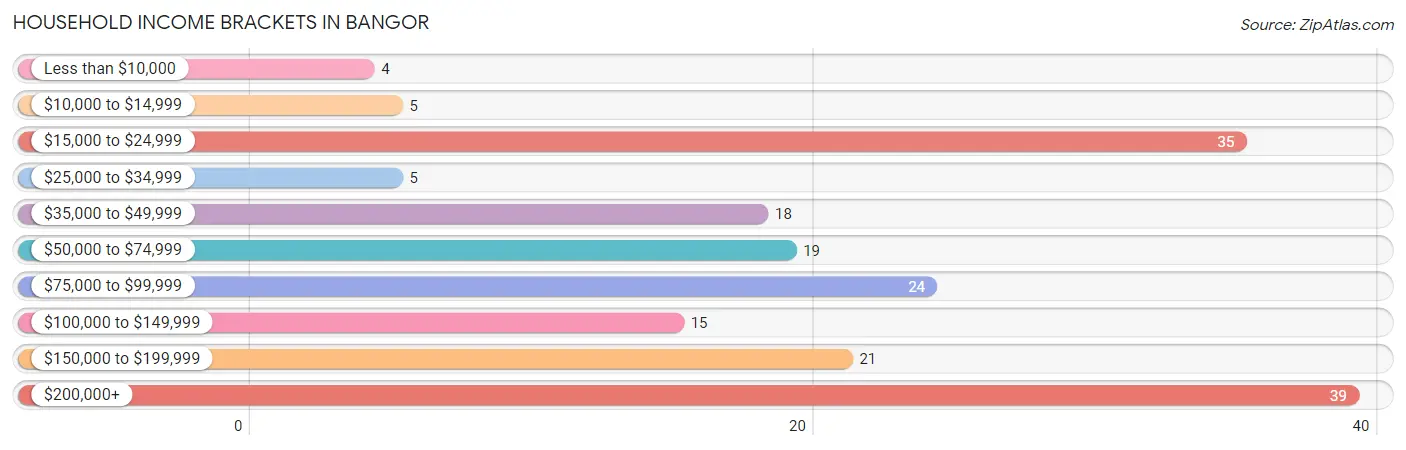
| Income Bracket | # Households | % Households |
| Less than $10,000 | 4 | 2.2% |
| $10,000 to $14,999 | 5 | 2.7% |
| $15,000 to $24,999 | 35 | 18.9% |
| $25,000 to $34,999 | 5 | 2.7% |
| $35,000 to $49,999 | 18 | 9.7% |
| $50,000 to $74,999 | 19 | 10.3% |
| $75,000 to $99,999 | 24 | 13.0% |
| $100,000 to $149,999 | 15 | 8.1% |
| $150,000 to $199,999 | 21 | 11.4% |
| $200,000+ | 39 | 21.1% |
Household Income by Householder Age in Bangor
The median household income in Bangor is $92,750, with the highest median household income of $71,923 found in the 65+ years age bracket for the primary householder. A total of 138 households (74.6%) fall into this category.
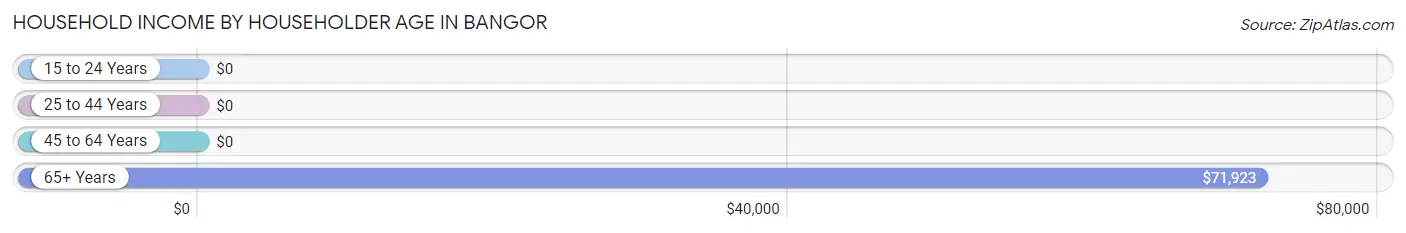
| Income Bracket | # Households | Median Income |
| 15 to 24 Years | 0 (0.0%) | $0 |
| 25 to 44 Years | 8 (4.3%) | $0 |
| 45 to 64 Years | 39 (21.1%) | $0 |
| 65+ Years | 138 (74.6%) | $71,923 |
| Total | 185 (100.0%) | $92,750 |
Poverty in Bangor
Income Below Poverty by Sex and Age in Bangor
With 4.8% poverty level for males and 4.2% for females among the residents of Bangor, 65 to 74 year old males and 75 year old and over females are the most vulnerable to poverty, with 10 males (12.2%) and 8 females (11.6%) in their respective age groups living below the poverty level.
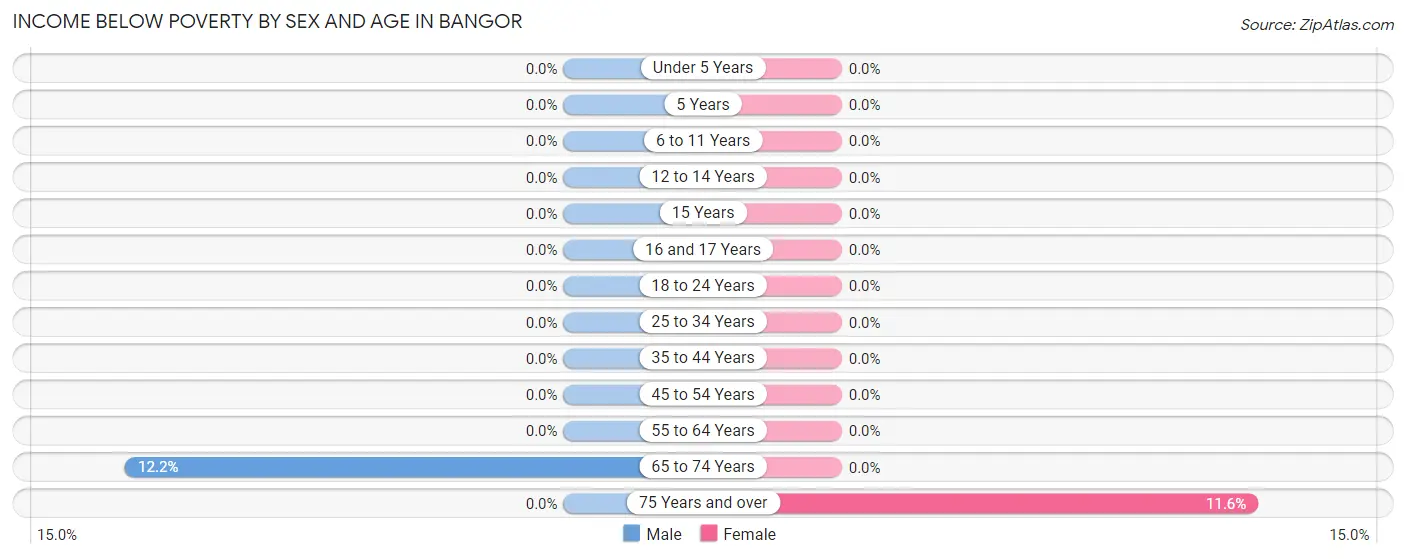
| Age Bracket | Male | Female |
| Under 5 Years | 0 (0.0%) | 0 (0.0%) |
| 5 Years | 0 (0.0%) | 0 (0.0%) |
| 6 to 11 Years | 0 (0.0%) | 0 (0.0%) |
| 12 to 14 Years | 0 (0.0%) | 0 (0.0%) |
| 15 Years | 0 (0.0%) | 0 (0.0%) |
| 16 and 17 Years | 0 (0.0%) | 0 (0.0%) |
| 18 to 24 Years | 0 (0.0%) | 0 (0.0%) |
| 25 to 34 Years | 0 (0.0%) | 0 (0.0%) |
| 35 to 44 Years | 0 (0.0%) | 0 (0.0%) |
| 45 to 54 Years | 0 (0.0%) | 0 (0.0%) |
| 55 to 64 Years | 0 (0.0%) | 0 (0.0%) |
| 65 to 74 Years | 10 (12.2%) | 0 (0.0%) |
| 75 Years and over | 0 (0.0%) | 8 (11.6%) |
| Total | 10 (4.8%) | 8 (4.2%) |
Income Above Poverty by Sex and Age in Bangor
According to the poverty statistics in Bangor, males aged under 5 years and females aged 12 to 14 years are the age groups that are most secure financially, with 100.0% of males and 100.0% of females in these age groups living above the poverty line.
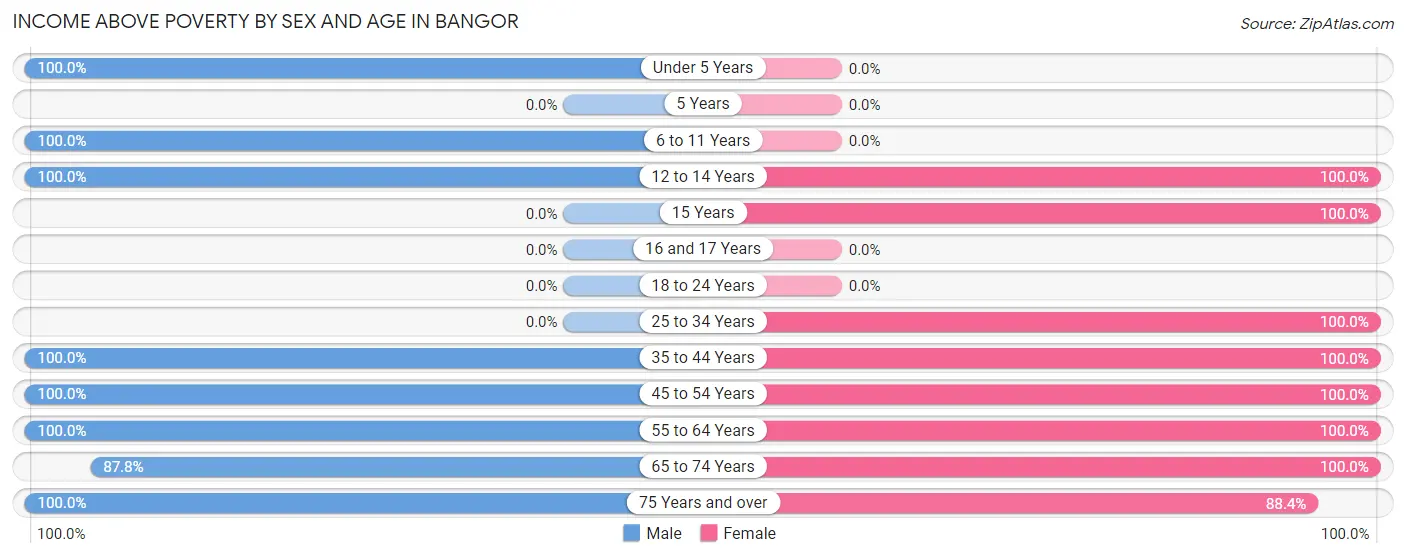
| Age Bracket | Male | Female |
| Under 5 Years | 7 (100.0%) | 0 (0.0%) |
| 5 Years | 0 (0.0%) | 0 (0.0%) |
| 6 to 11 Years | 8 (100.0%) | 0 (0.0%) |
| 12 to 14 Years | 8 (100.0%) | 8 (100.0%) |
| 15 Years | 0 (0.0%) | 6 (100.0%) |
| 16 and 17 Years | 0 (0.0%) | 0 (0.0%) |
| 18 to 24 Years | 0 (0.0%) | 0 (0.0%) |
| 25 to 34 Years | 0 (0.0%) | 5 (100.0%) |
| 35 to 44 Years | 22 (100.0%) | 9 (100.0%) |
| 45 to 54 Years | 53 (100.0%) | 12 (100.0%) |
| 55 to 64 Years | 4 (100.0%) | 26 (100.0%) |
| 65 to 74 Years | 72 (87.8%) | 57 (100.0%) |
| 75 Years and over | 23 (100.0%) | 61 (88.4%) |
| Total | 197 (95.2%) | 184 (95.8%) |
Income Below Poverty Among Married-Couple Families in Bangor
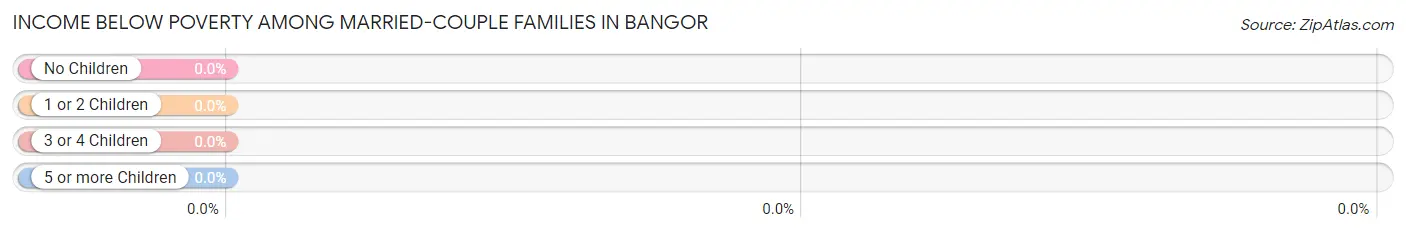
| Children | Above Poverty | Below Poverty |
| No Children | 65 (100.0%) | 0 (0.0%) |
| 1 or 2 Children | 17 (100.0%) | 0 (0.0%) |
| 3 or 4 Children | 0 (0.0%) | 0 (0.0%) |
| 5 or more Children | 0 (0.0%) | 0 (0.0%) |
| Total | 82 (100.0%) | 0 (0.0%) |
Income Below Poverty Among Single-Parent Households in Bangor
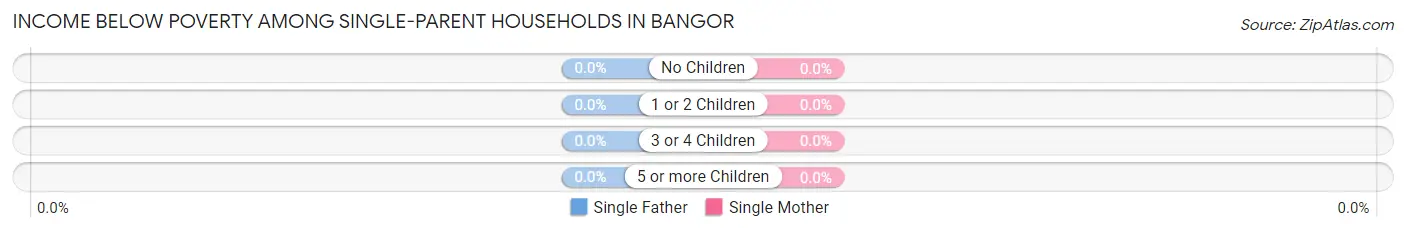
| Children | Single Father | Single Mother |
| No Children | 0 (0.0%) | 0 (0.0%) |
| 1 or 2 Children | 0 (0.0%) | 0 (0.0%) |
| 3 or 4 Children | 0 (0.0%) | 0 (0.0%) |
| 5 or more Children | 0 (0.0%) | 0 (0.0%) |
| Total | 0 (0.0%) | 0 (0.0%) |
Income Below Poverty Among Married-Couple vs Single-Parent Households in Bangor
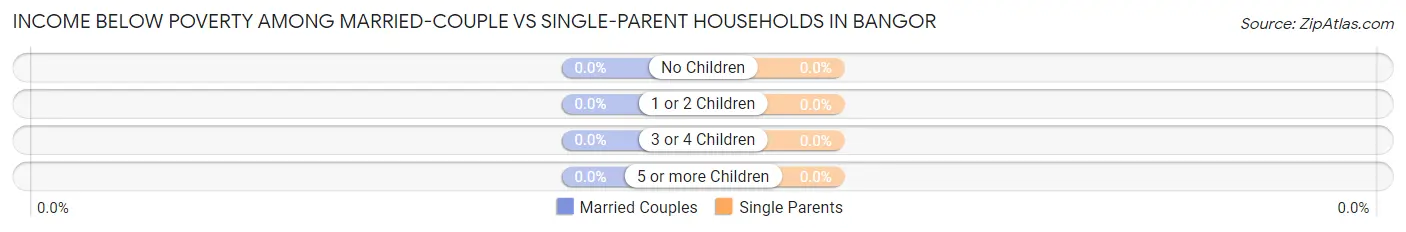
| Children | Married-Couple Families | Single-Parent Households |
| No Children | 0 (0.0%) | 0 (0.0%) |
| 1 or 2 Children | 0 (0.0%) | 0 (0.0%) |
| 3 or 4 Children | 0 (0.0%) | 0 (0.0%) |
| 5 or more Children | 0 (0.0%) | 0 (0.0%) |
| Total | 0 (0.0%) | 0 (0.0%) |
Race in Bangor
The most populous races in Bangor are White / Caucasian (353 | 88.5%), Hispanic or Latino (48 | 12.0%), and Some other Race (33 | 8.3%).
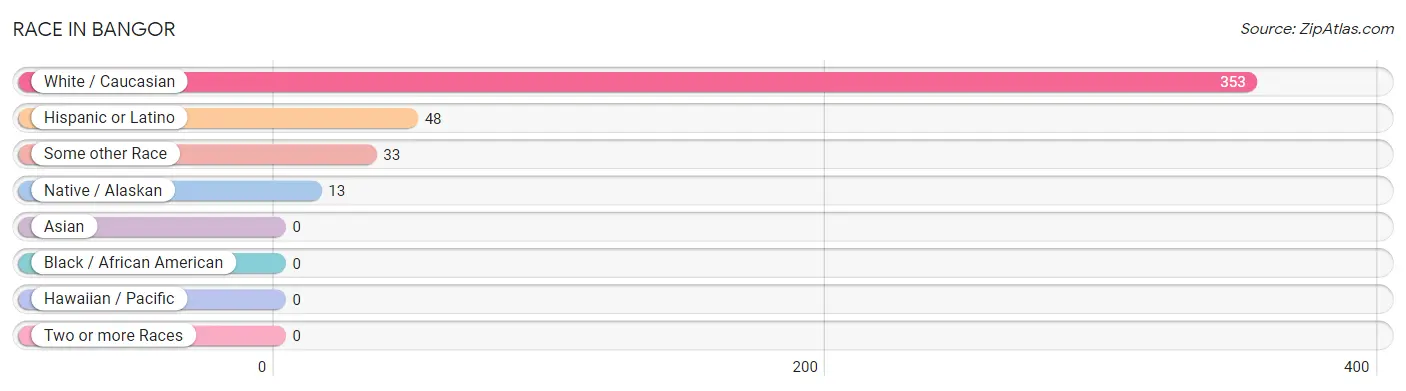
| Race | # Population | % Population |
| Asian | 0 | 0.0% |
| Black / African American | 0 | 0.0% |
| Hawaiian / Pacific | 0 | 0.0% |
| Hispanic or Latino | 48 | 12.0% |
| Native / Alaskan | 13 | 3.3% |
| White / Caucasian | 353 | 88.5% |
| Two or more Races | 0 | 0.0% |
| Some other Race | 33 | 8.3% |
| Total | 399 | 100.0% |
Ancestry in Bangor
The most populous ancestries reported in Bangor are Italian (52 | 13.0%), Irish (50 | 12.5%), English (41 | 10.3%), German (37 | 9.3%), and Scottish (26 | 6.5%), together accounting for 51.6% of all Bangor residents.
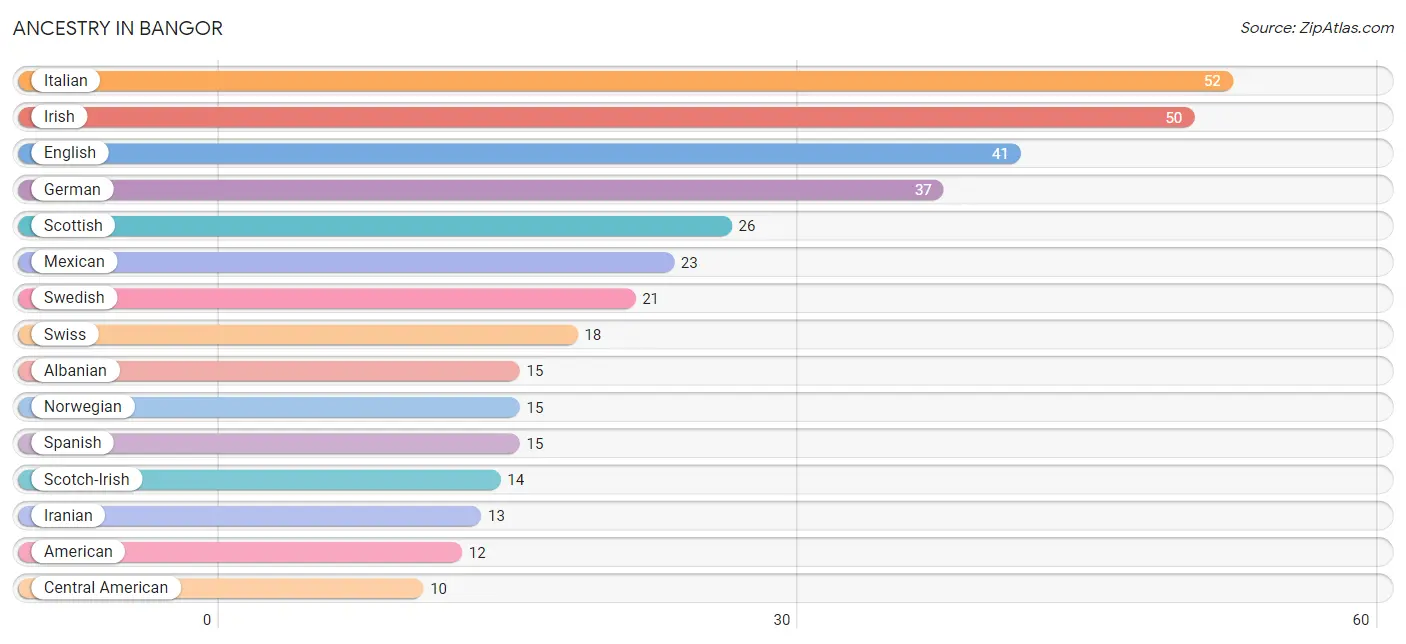
| Ancestry | # Population | % Population |
| Albanian | 15 | 3.8% |
| American | 12 | 3.0% |
| Central American | 10 | 2.5% |
| Creek | 2 | 0.5% |
| English | 41 | 10.3% |
| French | 8 | 2.0% |
| German | 37 | 9.3% |
| Guatemalan | 10 | 2.5% |
| Iranian | 13 | 3.3% |
| Irish | 50 | 12.5% |
| Italian | 52 | 13.0% |
| Mexican | 23 | 5.8% |
| Norwegian | 15 | 3.8% |
| Portuguese | 5 | 1.3% |
| Scotch-Irish | 14 | 3.5% |
| Scottish | 26 | 6.5% |
| South African | 2 | 0.5% |
| Spanish | 15 | 3.8% |
| Subsaharan African | 2 | 0.5% |
| Swedish | 21 | 5.3% |
| Swiss | 18 | 4.5% | View All 21 Rows |
Immigrants in Bangor
The most numerous immigrant groups reported in Bangor came from Asia (13 | 3.3%), Iran (13 | 3.3%), South Central Asia (13 | 3.3%), Central America (10 | 2.5%), and Guatemala (10 | 2.5%), together accounting for 14.8% of all Bangor residents.
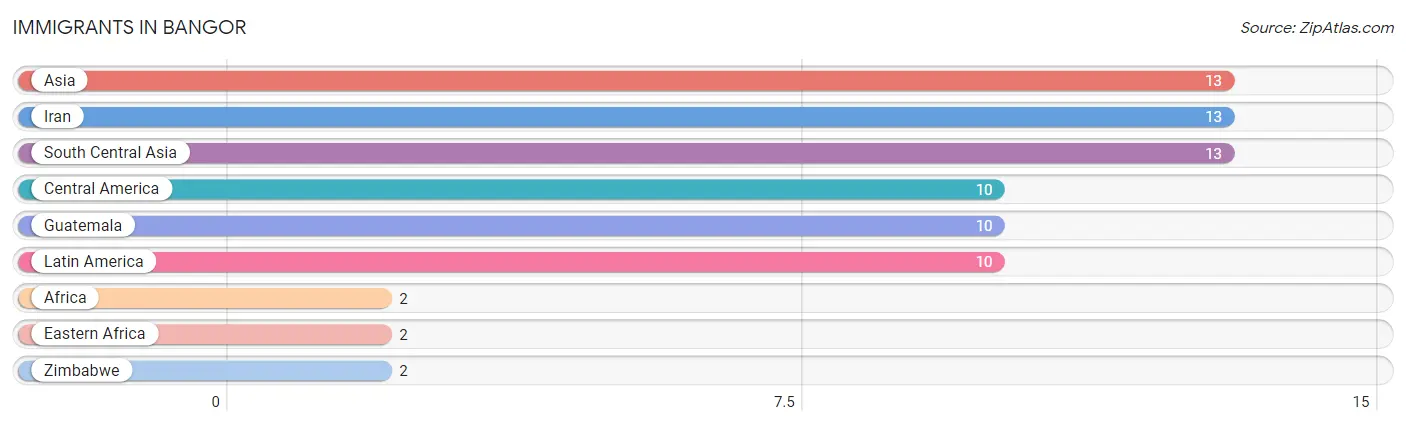
| Immigration Origin | # Population | % Population |
| Africa | 2 | 0.5% |
| Asia | 13 | 3.3% |
| Central America | 10 | 2.5% |
| Eastern Africa | 2 | 0.5% |
| Guatemala | 10 | 2.5% |
| Iran | 13 | 3.3% |
| Latin America | 10 | 2.5% |
| South Central Asia | 13 | 3.3% |
| Zimbabwe | 2 | 0.5% | View All 9 Rows |
Sex and Age in Bangor
Sex and Age in Bangor
The most populous age groups in Bangor are 70 to 74 Years (51 | 24.6%) for men and 80 to 84 Years (40 | 20.8%) for women.
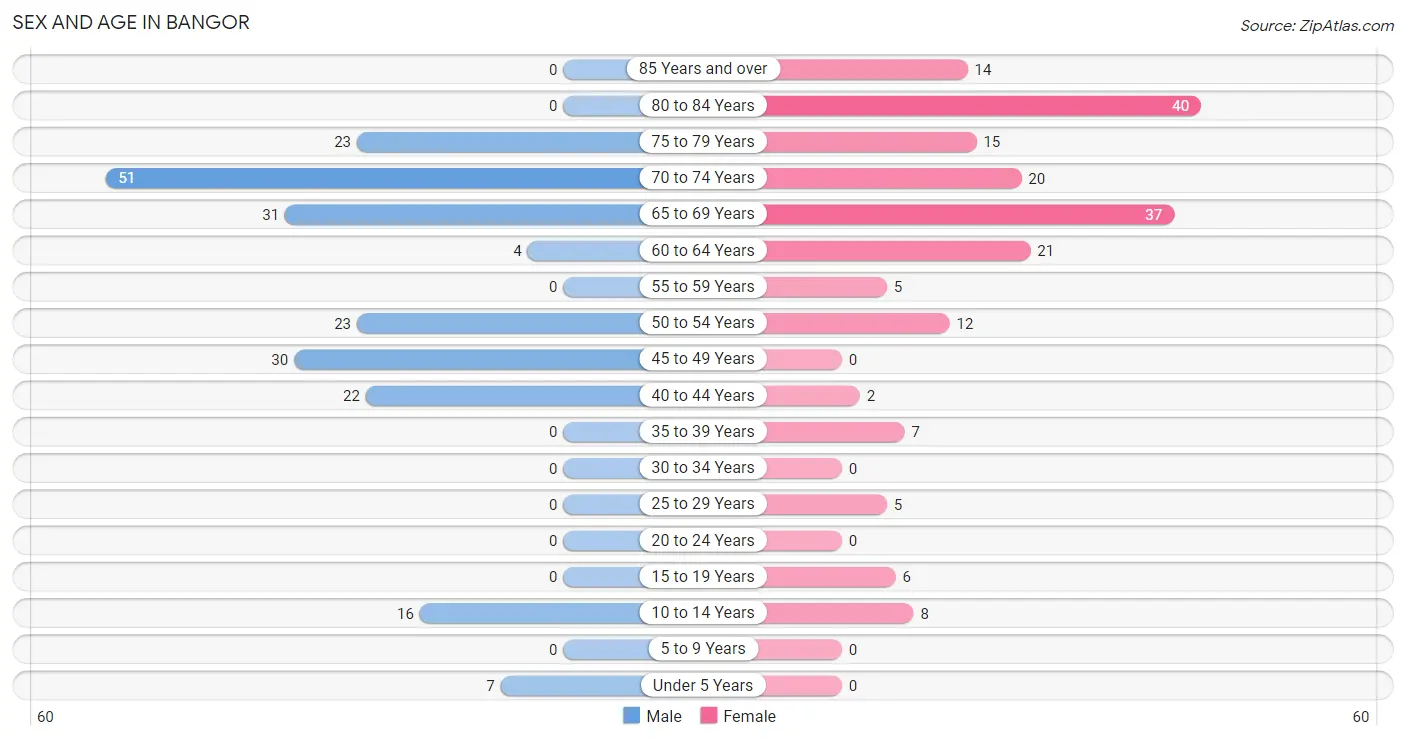
| Age Bracket | Male | Female |
| Under 5 Years | 7 (3.4%) | 0 (0.0%) |
| 5 to 9 Years | 0 (0.0%) | 0 (0.0%) |
| 10 to 14 Years | 16 (7.7%) | 8 (4.2%) |
| 15 to 19 Years | 0 (0.0%) | 6 (3.1%) |
| 20 to 24 Years | 0 (0.0%) | 0 (0.0%) |
| 25 to 29 Years | 0 (0.0%) | 5 (2.6%) |
| 30 to 34 Years | 0 (0.0%) | 0 (0.0%) |
| 35 to 39 Years | 0 (0.0%) | 7 (3.6%) |
| 40 to 44 Years | 22 (10.6%) | 2 (1.0%) |
| 45 to 49 Years | 30 (14.5%) | 0 (0.0%) |
| 50 to 54 Years | 23 (11.1%) | 12 (6.2%) |
| 55 to 59 Years | 0 (0.0%) | 5 (2.6%) |
| 60 to 64 Years | 4 (1.9%) | 21 (10.9%) |
| 65 to 69 Years | 31 (15.0%) | 37 (19.3%) |
| 70 to 74 Years | 51 (24.6%) | 20 (10.4%) |
| 75 to 79 Years | 23 (11.1%) | 15 (7.8%) |
| 80 to 84 Years | 0 (0.0%) | 40 (20.8%) |
| 85 Years and over | 0 (0.0%) | 14 (7.3%) |
| Total | 207 (100.0%) | 192 (100.0%) |
Families and Households in Bangor
Median Family Size in Bangor
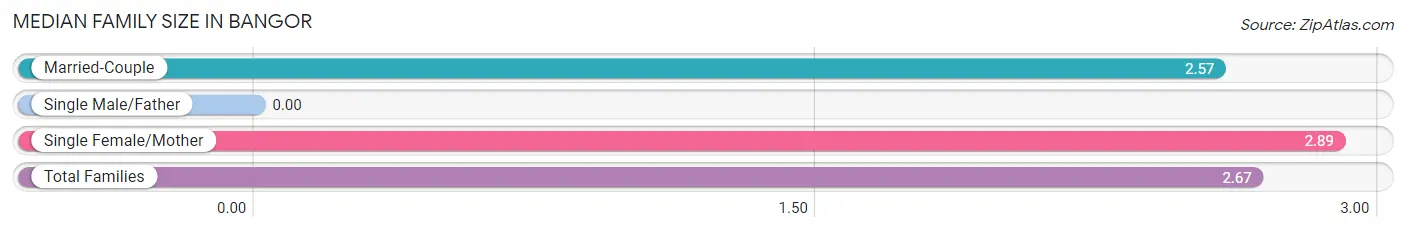
| Family Type | # Families | Family Size |
| Married-Couple | 82 (69.5%) | 2.57 |
| Single Male/Father | 0 (0.0%) | - |
| Single Female/Mother | 36 (30.5%) | 2.89 |
| Total Families | 118 (100.0%) | 2.67 |
Median Household Size in Bangor
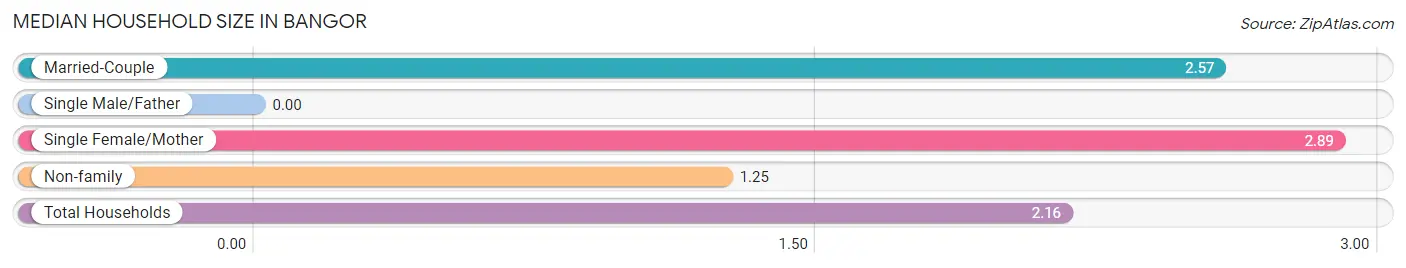
| Household Type | # Households | Household Size |
| Married-Couple | 82 (44.3%) | 2.57 |
| Single Male/Father | 0 (0.0%) | - |
| Single Female/Mother | 36 (19.5%) | 2.89 |
| Non-family | 67 (36.2%) | 1.25 |
| Total Households | 185 (100.0%) | 2.16 |
Household Size by Marriage Status in Bangor
Out of a total of 185 households in Bangor, 118 (63.8%) are family households, while 67 (36.2%) are nonfamily households. The most numerous type of family households are 3-person households, comprising 51, and the most common type of nonfamily households are 1-person households, comprising 53.
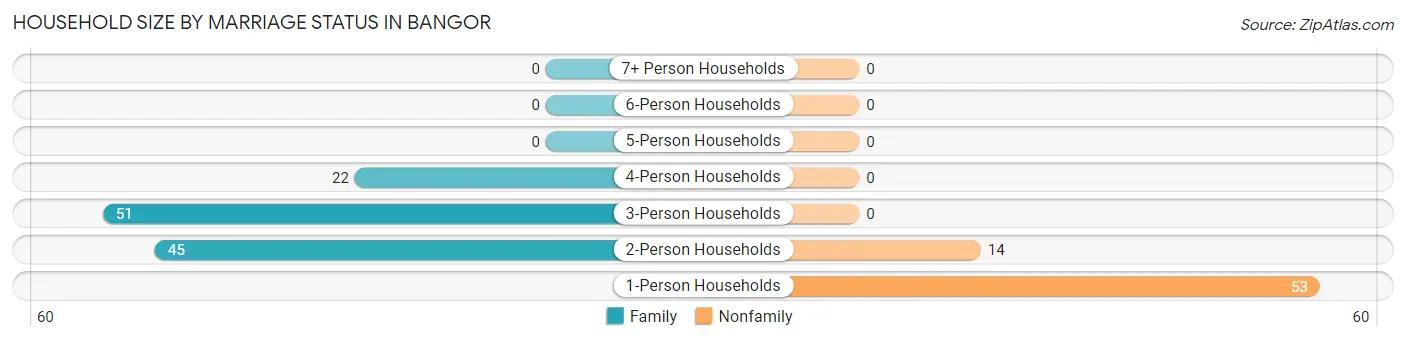
| Household Size | Family Households | Nonfamily Households |
| 1-Person Households | - | 53 (28.6%) |
| 2-Person Households | 45 (24.3%) | 14 (7.6%) |
| 3-Person Households | 51 (27.6%) | 0 (0.0%) |
| 4-Person Households | 22 (11.9%) | 0 (0.0%) |
| 5-Person Households | 0 (0.0%) | 0 (0.0%) |
| 6-Person Households | 0 (0.0%) | 0 (0.0%) |
| 7+ Person Households | 0 (0.0%) | 0 (0.0%) |
| Total | 118 (63.8%) | 67 (36.2%) |
Female Fertility in Bangor
Fertility by Age in Bangor
Average fertility rate in Bangor is 286.0 births per 1,000 women. Women in the age bracket of 35 to 50 years have the highest fertility rate with 471.0 births per 1,000 women. Women in the age bracket of 35 to 50 years acount for 100.0% of all women with births.
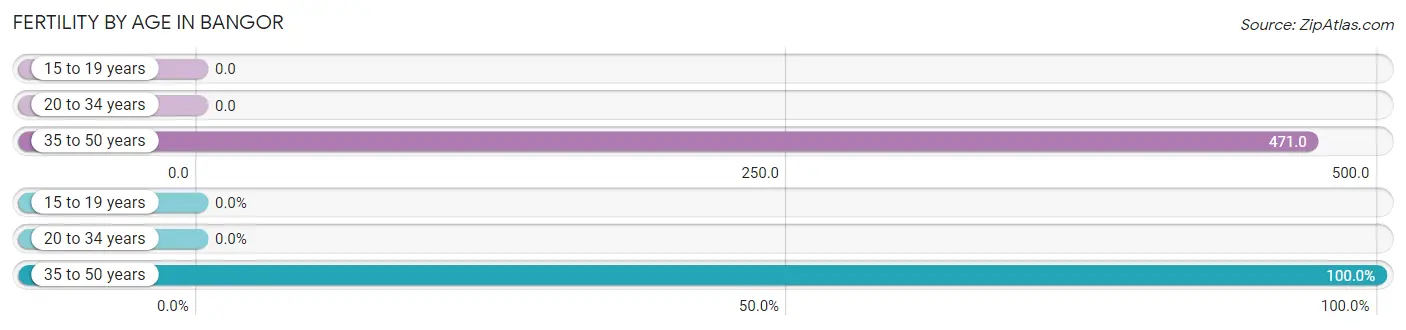
| Age Bracket | Women with Births | Births / 1,000 Women |
| 15 to 19 years | 0 (0.0%) | 0.0 |
| 20 to 34 years | 0 (0.0%) | 0.0 |
| 35 to 50 years | 8 (100.0%) | 471.0 |
| Total | 8 (100.0%) | 286.0 |
Fertility by Age by Marriage Status in Bangor
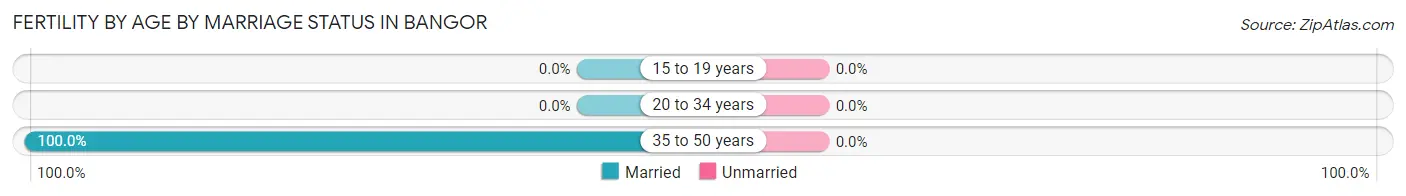
| Age Bracket | Married | Unmarried |
| 15 to 19 years | 0 (0.0%) | 0 (0.0%) |
| 20 to 34 years | 0 (0.0%) | 0 (0.0%) |
| 35 to 50 years | 8 (100.0%) | 0 (0.0%) |
| Total | 8 (100.0%) | 0 (0.0%) |
Fertility by Education in Bangor
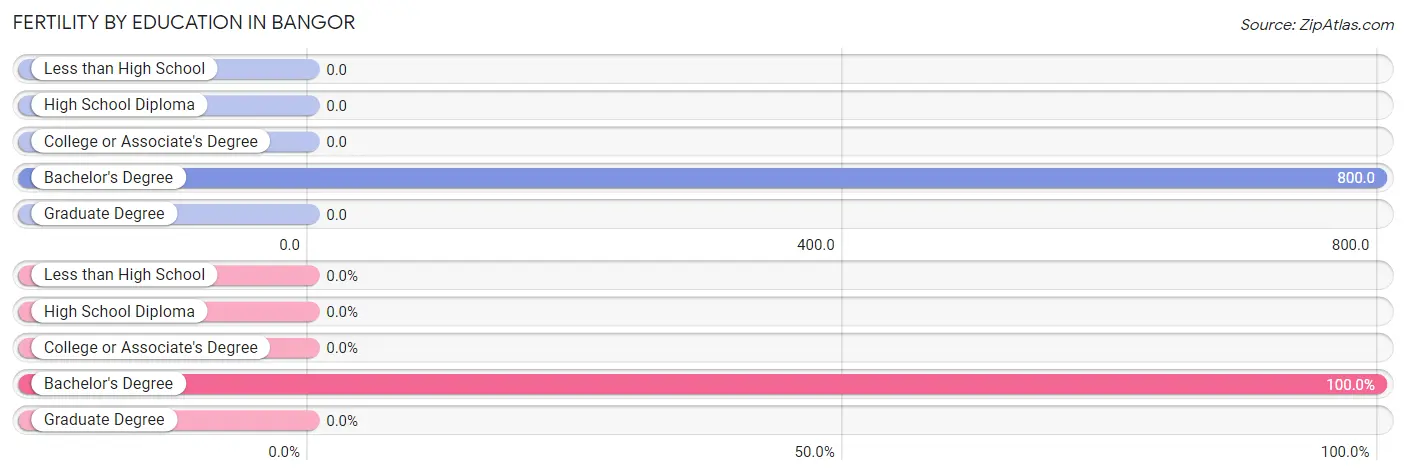
| Educational Attainment | Women with Births | Births / 1,000 Women |
| Less than High School | 0 (0.0%) | 0.0 |
| High School Diploma | 0 (0.0%) | 0.0 |
| College or Associate's Degree | 0 (0.0%) | 0.0 |
| Bachelor's Degree | 8 (100.0%) | 800.0 |
| Graduate Degree | 0 (0.0%) | 0.0 |
| Total | 8 (100.0%) | 286.0 |
Fertility by Education by Marriage Status in Bangor
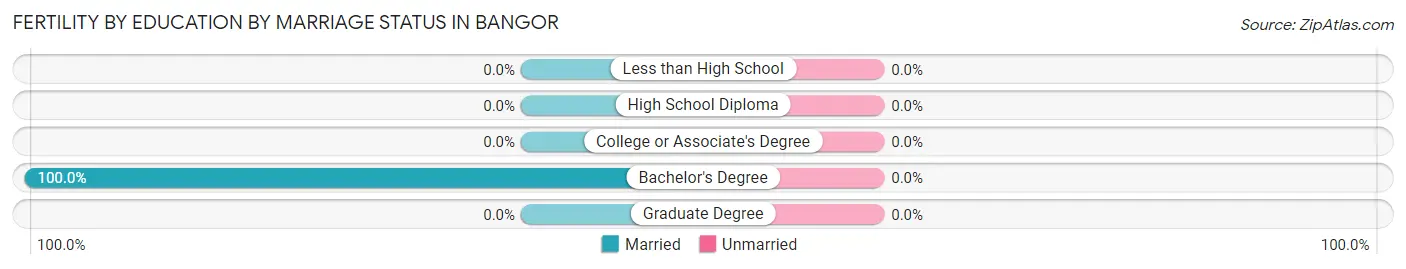
| Educational Attainment | Married | Unmarried |
| Less than High School | 0 (0.0%) | 0 (0.0%) |
| High School Diploma | 0 (0.0%) | 0 (0.0%) |
| College or Associate's Degree | 0 (0.0%) | 0 (0.0%) |
| Bachelor's Degree | 8 (100.0%) | 0 (0.0%) |
| Graduate Degree | 0 (0.0%) | 0 (0.0%) |
| Total | 8 (100.0%) | 0 (0.0%) |
Employment Characteristics in Bangor
Employment by Class of Employer in Bangor
Among the 95 employed individuals in Bangor, private company employees (41 | 43.2%), self-employed (not incorporated) (27 | 28.4%), and not-for-profit organizations (12 | 12.6%) make up the most common classes of employment.
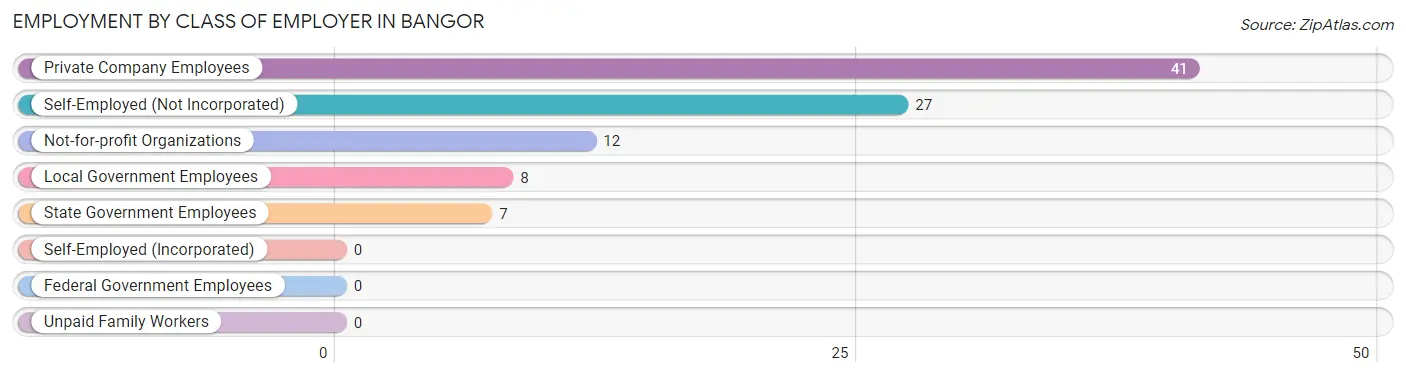
| Employer Class | # Employees | % Employees |
| Private Company Employees | 41 | 43.2% |
| Self-Employed (Incorporated) | 0 | 0.0% |
| Self-Employed (Not Incorporated) | 27 | 28.4% |
| Not-for-profit Organizations | 12 | 12.6% |
| Local Government Employees | 8 | 8.4% |
| State Government Employees | 7 | 7.4% |
| Federal Government Employees | 0 | 0.0% |
| Unpaid Family Workers | 0 | 0.0% |
| Total | 95 | 100.0% |
Employment Status by Age in Bangor
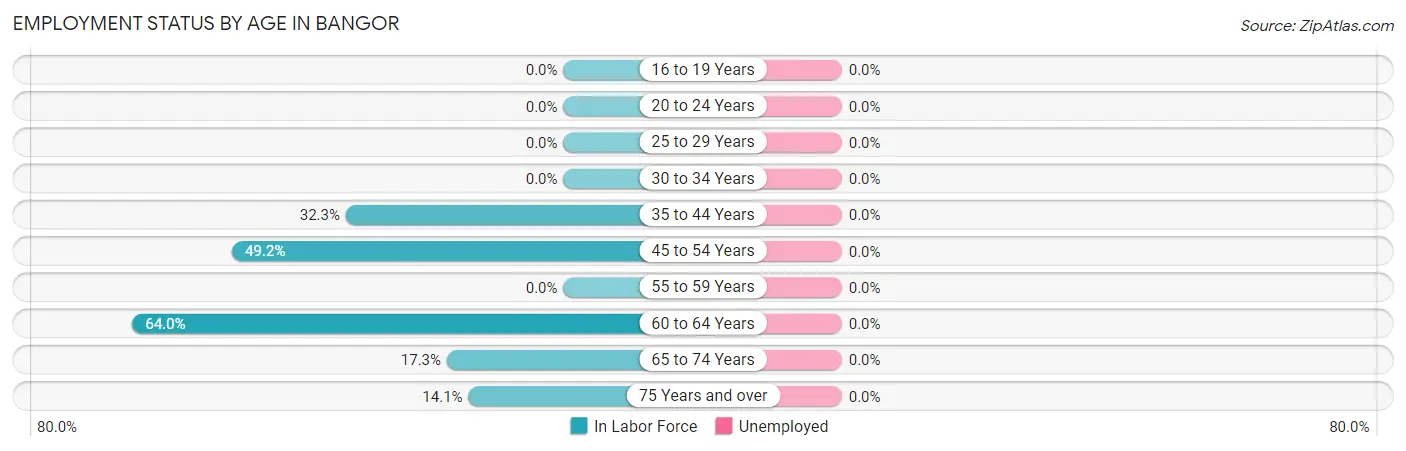
| Age Bracket | In Labor Force | Unemployed |
| 16 to 19 Years | 0 (0.0%) | 0 (0.0%) |
| 20 to 24 Years | 0 (0.0%) | 0 (0.0%) |
| 25 to 29 Years | 0 (0.0%) | 0 (0.0%) |
| 30 to 34 Years | 0 (0.0%) | 0 (0.0%) |
| 35 to 44 Years | 10 (32.3%) | 0 (0.0%) |
| 45 to 54 Years | 32 (49.2%) | 0 (0.0%) |
| 55 to 59 Years | 0 (0.0%) | 0 (0.0%) |
| 60 to 64 Years | 16 (64.0%) | 0 (0.0%) |
| 65 to 74 Years | 24 (17.3%) | 0 (0.0%) |
| 75 Years and over | 13 (14.1%) | 0 (0.0%) |
| Total | 95 (26.2%) | 0 (0.0%) |
Employment Status by Educational Attainment in Bangor
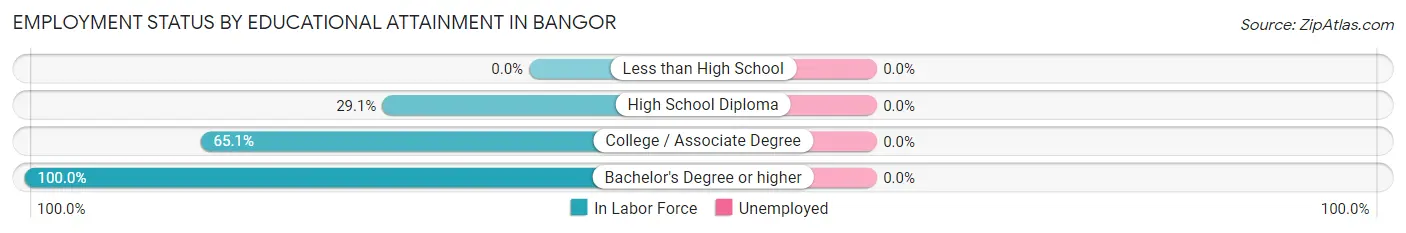
| Educational Attainment | In Labor Force | Unemployed |
| Less than High School | 0 (0.0%) | 0 (0.0%) |
| High School Diploma | 16 (29.1%) | 0 (0.0%) |
| College / Associate Degree | 28 (65.1%) | 0 (0.0%) |
| Bachelor's Degree or higher | 14 (100.0%) | 0 (0.0%) |
| Total | 58 (44.3%) | 0 (0.0%) |
Employment Occupations by Sex in Bangor
Management, Business, Science and Arts Occupations
The most common Management, Business, Science and Arts occupations in Bangor are Community & Social Service (20 | 21.0%), Education Instruction & Library (8 | 8.4%), Arts, Media & Entertainment (8 | 8.4%), Education, Arts & Media (4 | 4.2%), and Computers, Engineering & Science (3 | 3.2%).
Management, Business, Science and Arts Occupations by Sex
Within the Management, Business, Science and Arts occupations in Bangor, the most male-oriented occupations are Computers, Engineering & Science (100.0%), Architecture & Engineering (100.0%), and Arts, Media & Entertainment (100.0%), while the most female-oriented occupations are Education, Arts & Media (100.0%), Education Instruction & Library (100.0%), and Health Diagnosing & Treating (100.0%).
| Occupation | Male | Female |
| Management | 0 (0.0%) | 0 (0.0%) |
| Business & Financial | 0 (0.0%) | 0 (0.0%) |
| Computers, Engineering & Science | 3 (100.0%) | 0 (0.0%) |
| Computers & Mathematics | 0 (0.0%) | 0 (0.0%) |
| Architecture & Engineering | 3 (100.0%) | 0 (0.0%) |
| Life, Physical & Social Science | 0 (0.0%) | 0 (0.0%) |
| Community & Social Service | 8 (40.0%) | 12 (60.0%) |
| Education, Arts & Media | 0 (0.0%) | 4 (100.0%) |
| Legal Services & Support | 0 (0.0%) | 0 (0.0%) |
| Education Instruction & Library | 0 (0.0%) | 8 (100.0%) |
| Arts, Media & Entertainment | 8 (100.0%) | 0 (0.0%) |
| Health Diagnosing & Treating | 0 (0.0%) | 2 (100.0%) |
| Health Technologists | 0 (0.0%) | 2 (100.0%) |
| Total (Category) | 11 (44.0%) | 14 (56.0%) |
| Total (Overall) | 41 (43.2%) | 54 (56.8%) |
Services Occupations
The most common Services occupations in Bangor are Healthcare Support (4 | 4.2%), and Food Preparation & Serving (4 | 4.2%).
Services Occupations by Sex
| Occupation | Male | Female |
| Healthcare Support | 0 (0.0%) | 4 (100.0%) |
| Security & Protection | 0 (0.0%) | 0 (0.0%) |
| Firefighting & Prevention | 0 (0.0%) | 0 (0.0%) |
| Law Enforcement | 0 (0.0%) | 0 (0.0%) |
| Food Preparation & Serving | 0 (0.0%) | 4 (100.0%) |
| Cleaning & Maintenance | 0 (0.0%) | 0 (0.0%) |
| Personal Care & Service | 0 (0.0%) | 0 (0.0%) |
| Total (Category) | 0 (0.0%) | 8 (100.0%) |
| Total (Overall) | 41 (43.2%) | 54 (56.8%) |
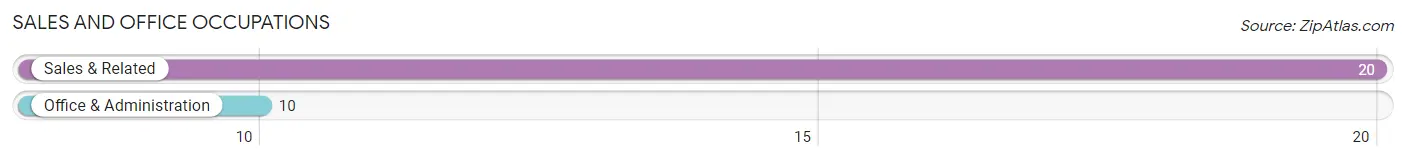
Sales and Office Occupations
The most common Sales and Office occupations in Bangor are Sales & Related (20 | 21.0%), and Office & Administration (10 | 10.5%).
Sales and Office Occupations by Sex
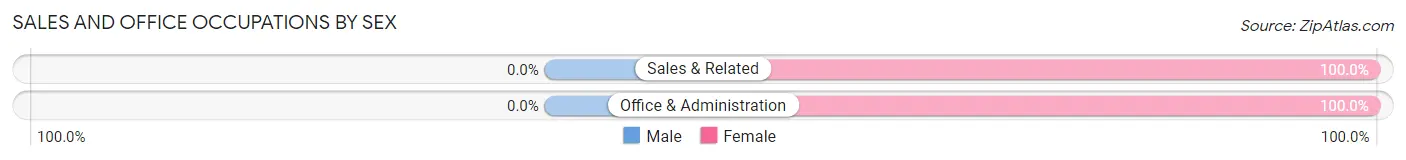
| Occupation | Male | Female |
| Sales & Related | 0 (0.0%) | 20 (100.0%) |
| Office & Administration | 0 (0.0%) | 10 (100.0%) |
| Total (Category) | 0 (0.0%) | 30 (100.0%) |
| Total (Overall) | 41 (43.2%) | 54 (56.8%) |
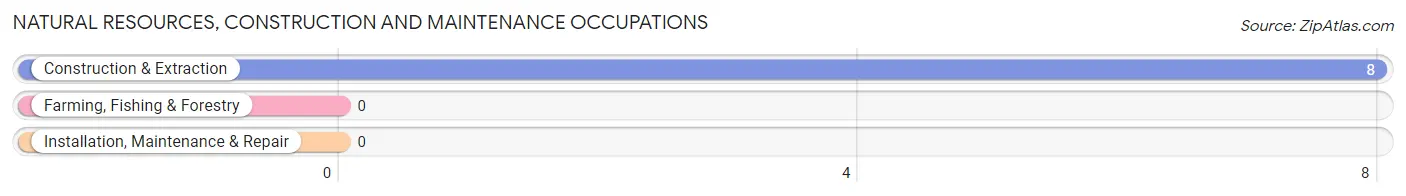
Natural Resources, Construction and Maintenance Occupations
The most common Natural Resources, Construction and Maintenance occupations in Bangor are , and Construction & Extraction (8 | 8.4%).
Natural Resources, Construction and Maintenance Occupations by Sex
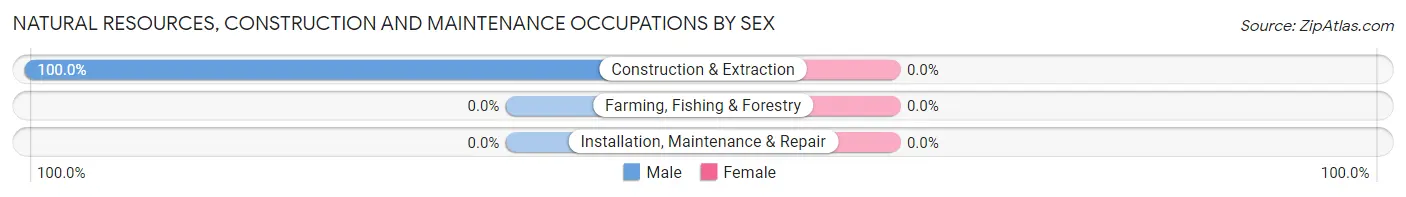
| Occupation | Male | Female |
| Farming, Fishing & Forestry | 0 (0.0%) | 0 (0.0%) |
| Construction & Extraction | 8 (100.0%) | 0 (0.0%) |
| Installation, Maintenance & Repair | 0 (0.0%) | 0 (0.0%) |
| Total (Category) | 8 (100.0%) | 0 (0.0%) |
| Total (Overall) | 41 (43.2%) | 54 (56.8%) |
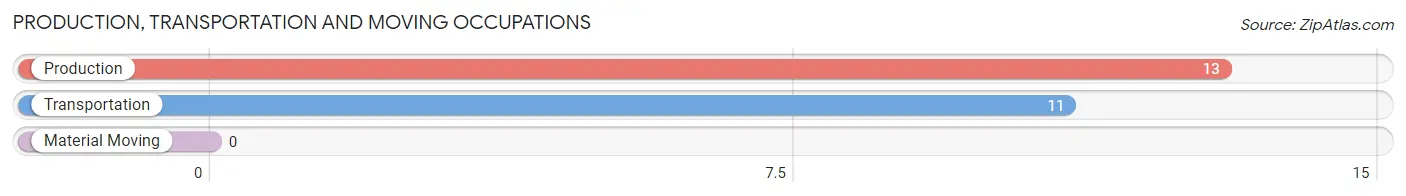
Production, Transportation and Moving Occupations
The most common Production, Transportation and Moving occupations in Bangor are Production (13 | 13.7%), and Transportation (11 | 11.6%).
Production, Transportation and Moving Occupations by Sex
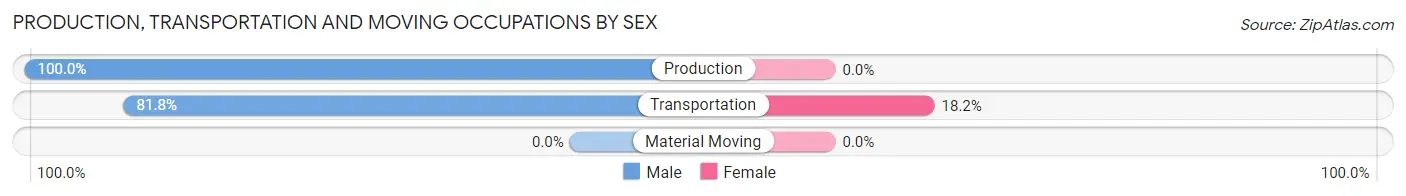
| Occupation | Male | Female |
| Production | 13 (100.0%) | 0 (0.0%) |
| Transportation | 9 (81.8%) | 2 (18.2%) |
| Material Moving | 0 (0.0%) | 0 (0.0%) |
| Total (Category) | 22 (91.7%) | 2 (8.3%) |
| Total (Overall) | 41 (43.2%) | 54 (56.8%) |
Employment Industries by Sex in Bangor
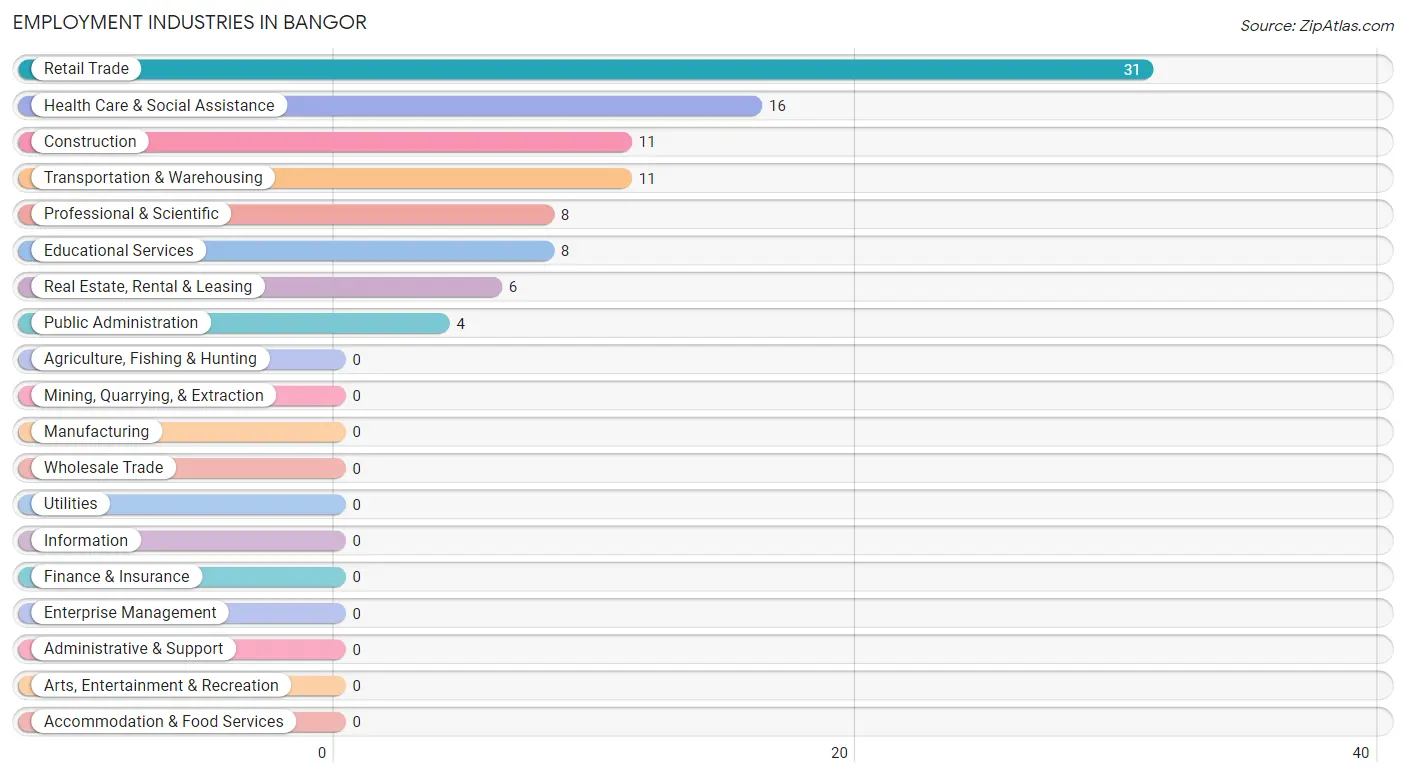
Employment Industries in Bangor
The major employment industries in Bangor include Retail Trade (31 | 32.6%), Health Care & Social Assistance (16 | 16.8%), Construction (11 | 11.6%), Transportation & Warehousing (11 | 11.6%), and Professional & Scientific (8 | 8.4%).
Employment Industries by Sex in Bangor
The Bangor industries that see more men than women are Construction (100.0%), Professional & Scientific (100.0%), and Transportation & Warehousing (81.8%), whereas the industries that tend to have a higher number of women are Real Estate, Rental & Leasing (100.0%), Educational Services (100.0%), and Health Care & Social Assistance (100.0%).
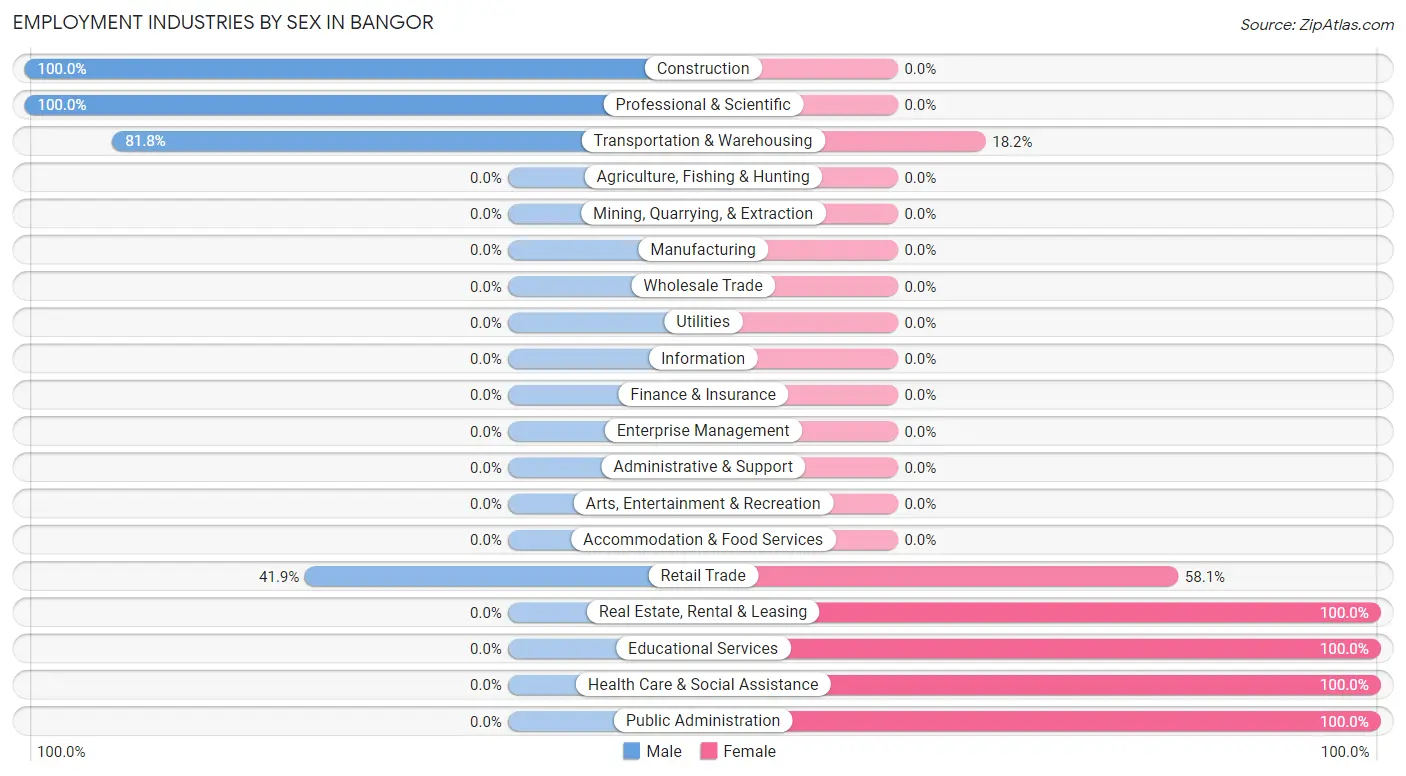
| Industry | Male | Female |
| Agriculture, Fishing & Hunting | 0 (0.0%) | 0 (0.0%) |
| Mining, Quarrying, & Extraction | 0 (0.0%) | 0 (0.0%) |
| Construction | 11 (100.0%) | 0 (0.0%) |
| Manufacturing | 0 (0.0%) | 0 (0.0%) |
| Wholesale Trade | 0 (0.0%) | 0 (0.0%) |
| Retail Trade | 13 (41.9%) | 18 (58.1%) |
| Transportation & Warehousing | 9 (81.8%) | 2 (18.2%) |
| Utilities | 0 (0.0%) | 0 (0.0%) |
| Information | 0 (0.0%) | 0 (0.0%) |
| Finance & Insurance | 0 (0.0%) | 0 (0.0%) |
| Real Estate, Rental & Leasing | 0 (0.0%) | 6 (100.0%) |
| Professional & Scientific | 8 (100.0%) | 0 (0.0%) |
| Enterprise Management | 0 (0.0%) | 0 (0.0%) |
| Administrative & Support | 0 (0.0%) | 0 (0.0%) |
| Educational Services | 0 (0.0%) | 8 (100.0%) |
| Health Care & Social Assistance | 0 (0.0%) | 16 (100.0%) |
| Arts, Entertainment & Recreation | 0 (0.0%) | 0 (0.0%) |
| Accommodation & Food Services | 0 (0.0%) | 0 (0.0%) |
| Public Administration | 0 (0.0%) | 4 (100.0%) |
| Total | 41 (43.2%) | 54 (56.8%) |
Education in Bangor
School Enrollment in Bangor
The most common levels of schooling among the 43 students in Bangor are middle school (24 | 55.8%), nursery / preschool (7 | 16.3%), and high school (6 | 14.0%).
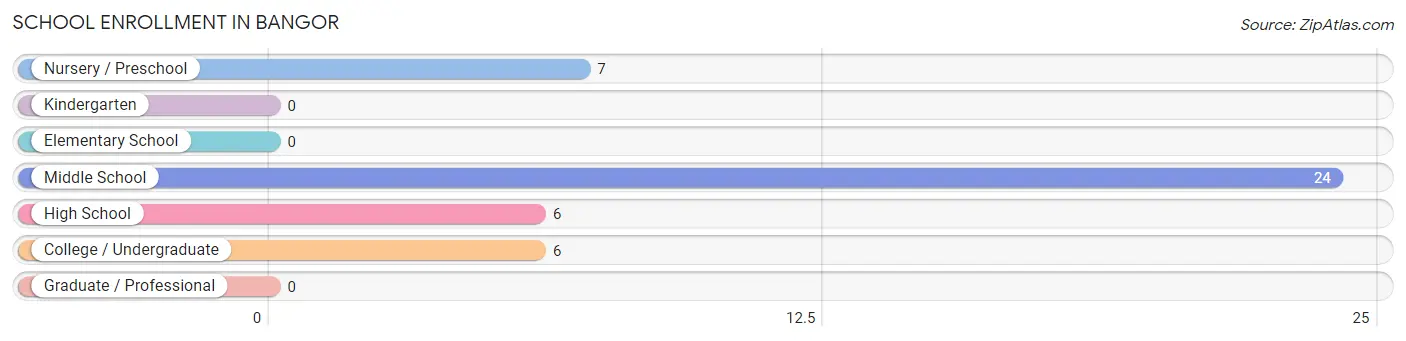
| School Level | # Students | % Students |
| Nursery / Preschool | 7 | 16.3% |
| Kindergarten | 0 | 0.0% |
| Elementary School | 0 | 0.0% |
| Middle School | 24 | 55.8% |
| High School | 6 | 14.0% |
| College / Undergraduate | 6 | 14.0% |
| Graduate / Professional | 0 | 0.0% |
| Total | 43 | 100.0% |
School Enrollment by Age by Funding Source in Bangor
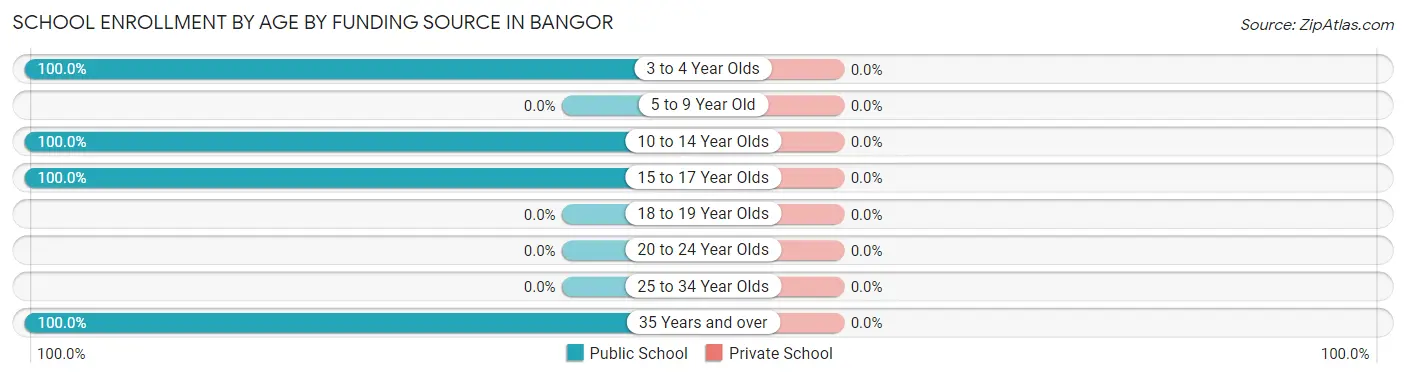
| Age Bracket | Public School | Private School |
| 3 to 4 Year Olds | 7 (100.0%) | 0 (0.0%) |
| 5 to 9 Year Old | 0 (0.0%) | 0 (0.0%) |
| 10 to 14 Year Olds | 24 (100.0%) | 0 (0.0%) |
| 15 to 17 Year Olds | 6 (100.0%) | 0 (0.0%) |
| 18 to 19 Year Olds | 0 (0.0%) | 0 (0.0%) |
| 20 to 24 Year Olds | 0 (0.0%) | 0 (0.0%) |
| 25 to 34 Year Olds | 0 (0.0%) | 0 (0.0%) |
| 35 Years and over | 6 (100.0%) | 0 (0.0%) |
| Total | 43 (100.0%) | 0 (0.0%) |
Educational Attainment by Field of Study in Bangor
Education (23 | 44.2%), computers & mathematics (13 | 25.0%), bio, nature & agricultural (9 | 17.3%), liberal arts & history (5 | 9.6%), and science & technology (2 | 3.8%) are the most common fields of study among 52 individuals in Bangor who have obtained a bachelor's degree or higher.
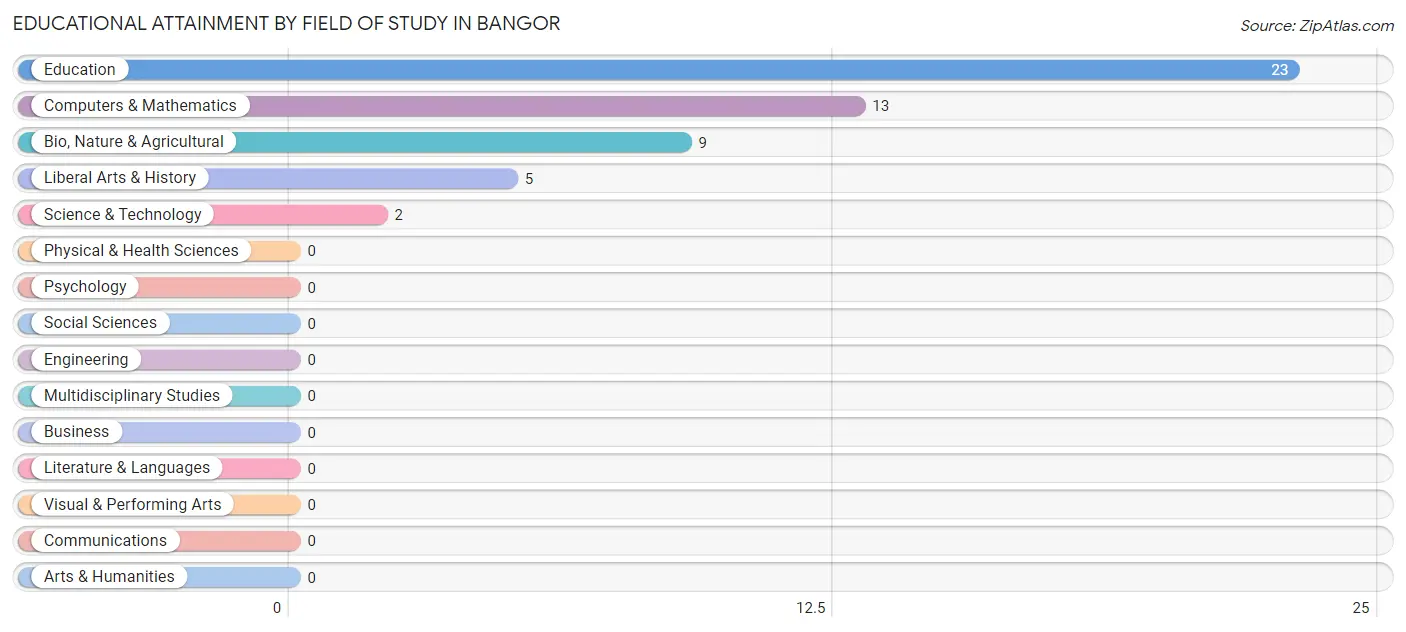
| Field of Study | # Graduates | % Graduates |
| Computers & Mathematics | 13 | 25.0% |
| Bio, Nature & Agricultural | 9 | 17.3% |
| Physical & Health Sciences | 0 | 0.0% |
| Psychology | 0 | 0.0% |
| Social Sciences | 0 | 0.0% |
| Engineering | 0 | 0.0% |
| Multidisciplinary Studies | 0 | 0.0% |
| Science & Technology | 2 | 3.8% |
| Business | 0 | 0.0% |
| Education | 23 | 44.2% |
| Literature & Languages | 0 | 0.0% |
| Liberal Arts & History | 5 | 9.6% |
| Visual & Performing Arts | 0 | 0.0% |
| Communications | 0 | 0.0% |
| Arts & Humanities | 0 | 0.0% |
| Total | 52 | 100.0% |
Transportation & Commute in Bangor
Vehicle Availability by Sex in Bangor
The most prevalent vehicle ownership categories in Bangor are males with 2 vehicles (24, accounting for 58.5%) and females with 2 vehicles (10, making up 44.4%).
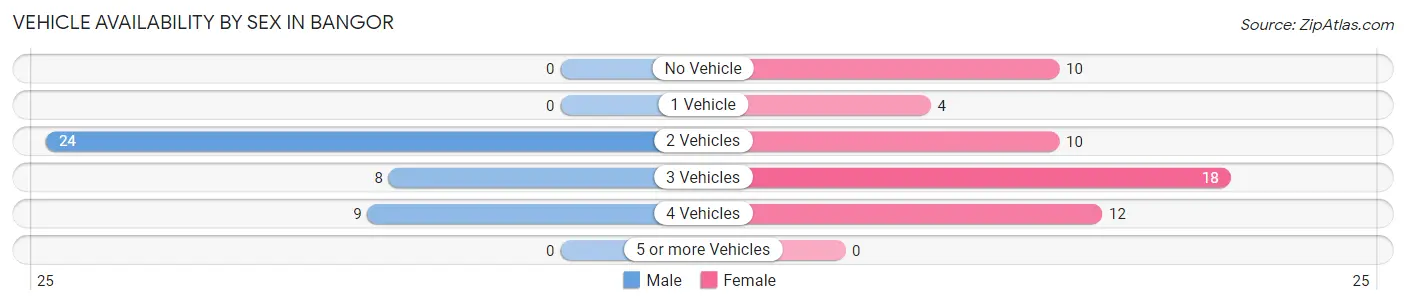
| Vehicles Available | Male | Female |
| No Vehicle | 0 (0.0%) | 10 (18.5%) |
| 1 Vehicle | 0 (0.0%) | 4 (7.4%) |
| 2 Vehicles | 24 (58.5%) | 10 (18.5%) |
| 3 Vehicles | 8 (19.5%) | 18 (33.3%) |
| 4 Vehicles | 9 (22.0%) | 12 (22.2%) |
| 5 or more Vehicles | 0 (0.0%) | 0 (0.0%) |
| Total | 41 (100.0%) | 54 (100.0%) |
Commute Time in Bangor
The most frequently occuring commute durations in Bangor are 30 to 34 minutes (32 commuters, 42.7%), less than 5 minutes (14 commuters, 18.7%), and 45 to 59 minutes (13 commuters, 17.3%).
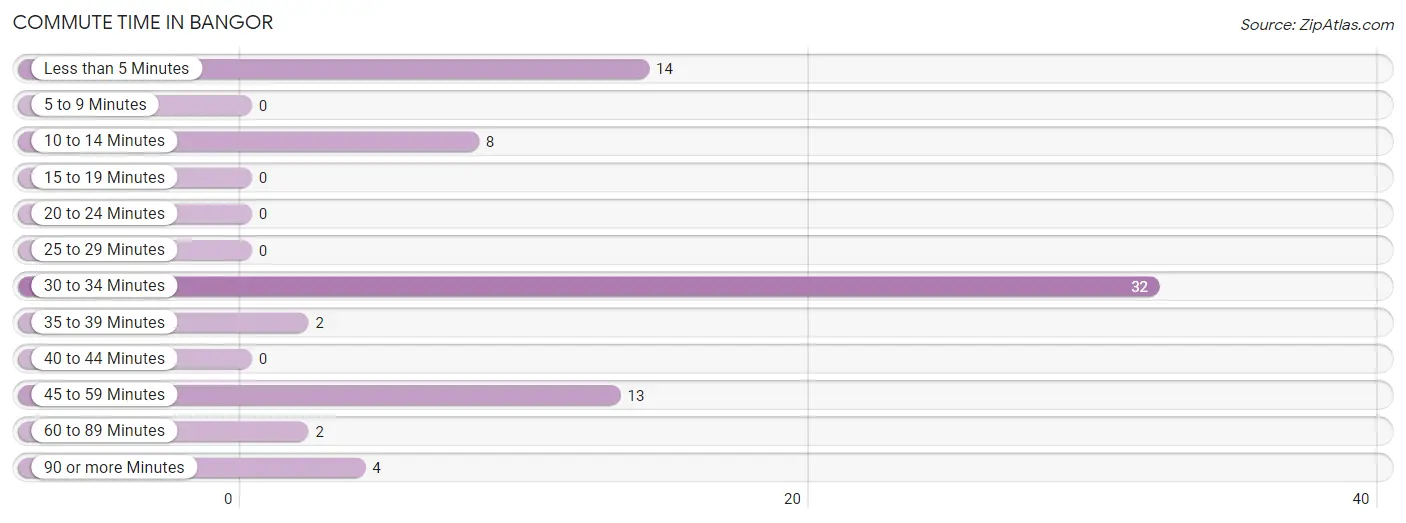
| Commute Time | # Commuters | % Commuters |
| Less than 5 Minutes | 14 | 18.7% |
| 5 to 9 Minutes | 0 | 0.0% |
| 10 to 14 Minutes | 8 | 10.7% |
| 15 to 19 Minutes | 0 | 0.0% |
| 20 to 24 Minutes | 0 | 0.0% |
| 25 to 29 Minutes | 0 | 0.0% |
| 30 to 34 Minutes | 32 | 42.7% |
| 35 to 39 Minutes | 2 | 2.7% |
| 40 to 44 Minutes | 0 | 0.0% |
| 45 to 59 Minutes | 13 | 17.3% |
| 60 to 89 Minutes | 2 | 2.7% |
| 90 or more Minutes | 4 | 5.3% |
Commute Time by Sex in Bangor
The most common commute times in Bangor are 30 to 34 minutes (16 commuters, 64.0%) for males and 30 to 34 minutes (16 commuters, 32.0%) for females.
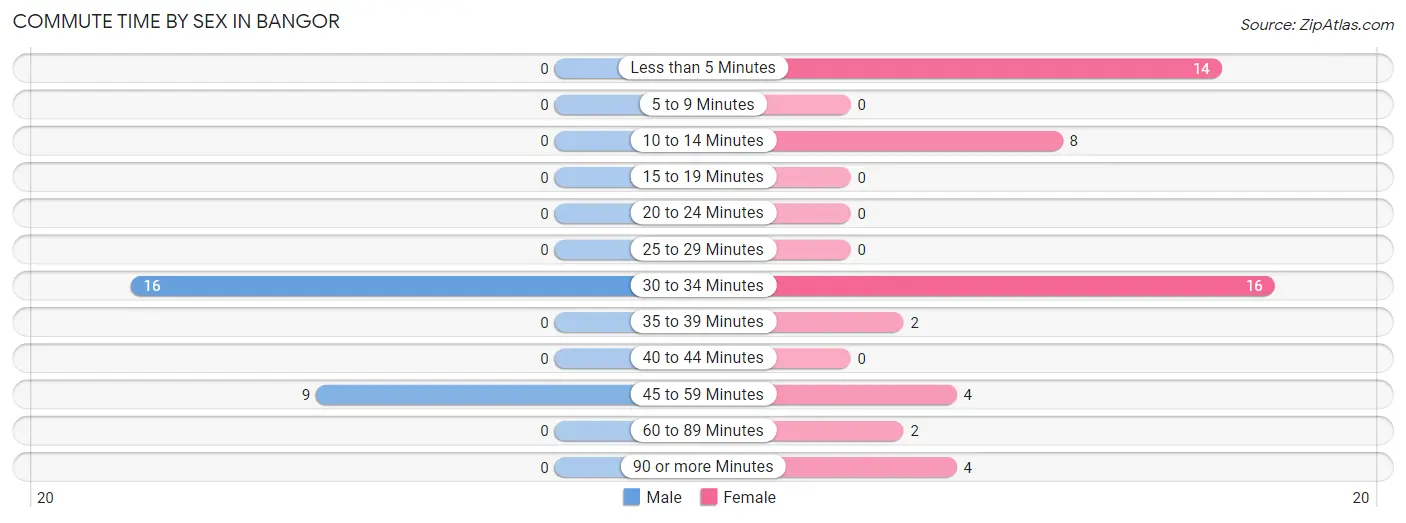
| Commute Time | Male | Female |
| Less than 5 Minutes | 0 (0.0%) | 14 (28.0%) |
| 5 to 9 Minutes | 0 (0.0%) | 0 (0.0%) |
| 10 to 14 Minutes | 0 (0.0%) | 8 (16.0%) |
| 15 to 19 Minutes | 0 (0.0%) | 0 (0.0%) |
| 20 to 24 Minutes | 0 (0.0%) | 0 (0.0%) |
| 25 to 29 Minutes | 0 (0.0%) | 0 (0.0%) |
| 30 to 34 Minutes | 16 (64.0%) | 16 (32.0%) |
| 35 to 39 Minutes | 0 (0.0%) | 2 (4.0%) |
| 40 to 44 Minutes | 0 (0.0%) | 0 (0.0%) |
| 45 to 59 Minutes | 9 (36.0%) | 4 (8.0%) |
| 60 to 89 Minutes | 0 (0.0%) | 2 (4.0%) |
| 90 or more Minutes | 0 (0.0%) | 4 (8.0%) |
Time of Departure to Work by Sex in Bangor
The most frequent times of departure to work in Bangor are 6:30 AM to 6:59 AM (9, 36.0%) for males and 5:00 AM to 5:29 AM (18, 36.0%) for females.
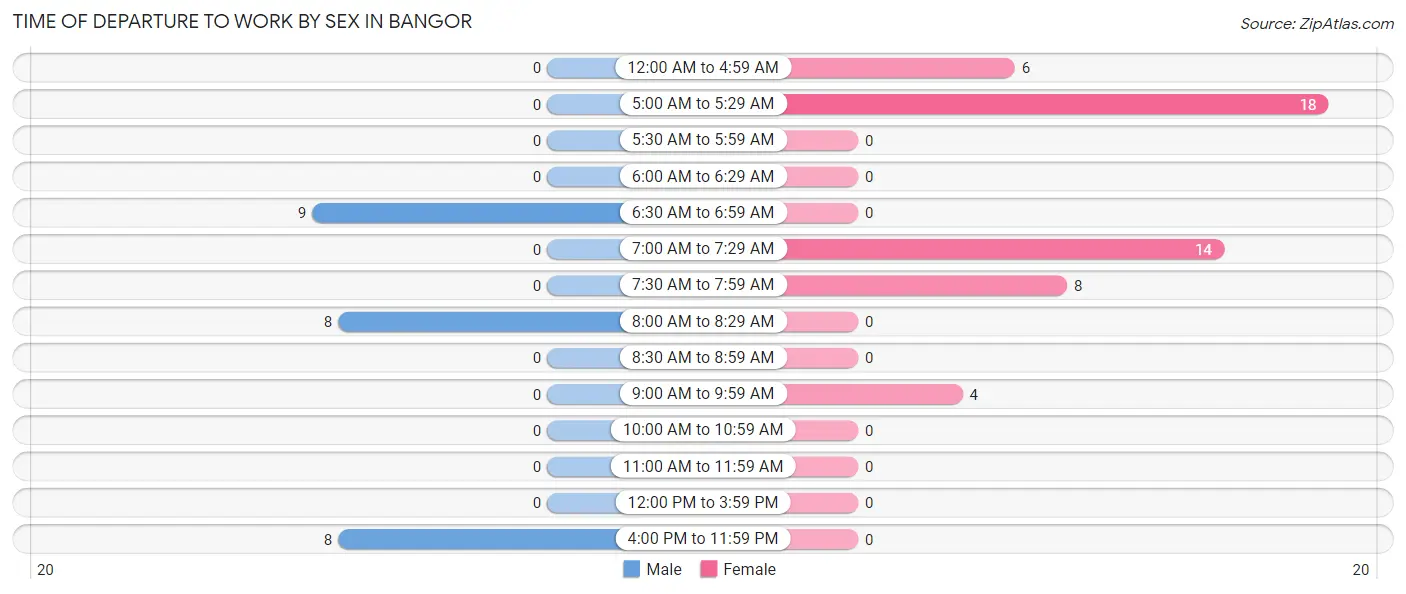
| Time of Departure | Male | Female |
| 12:00 AM to 4:59 AM | 0 (0.0%) | 6 (12.0%) |
| 5:00 AM to 5:29 AM | 0 (0.0%) | 18 (36.0%) |
| 5:30 AM to 5:59 AM | 0 (0.0%) | 0 (0.0%) |
| 6:00 AM to 6:29 AM | 0 (0.0%) | 0 (0.0%) |
| 6:30 AM to 6:59 AM | 9 (36.0%) | 0 (0.0%) |
| 7:00 AM to 7:29 AM | 0 (0.0%) | 14 (28.0%) |
| 7:30 AM to 7:59 AM | 0 (0.0%) | 8 (16.0%) |
| 8:00 AM to 8:29 AM | 8 (32.0%) | 0 (0.0%) |
| 8:30 AM to 8:59 AM | 0 (0.0%) | 0 (0.0%) |
| 9:00 AM to 9:59 AM | 0 (0.0%) | 4 (8.0%) |
| 10:00 AM to 10:59 AM | 0 (0.0%) | 0 (0.0%) |
| 11:00 AM to 11:59 AM | 0 (0.0%) | 0 (0.0%) |
| 12:00 PM to 3:59 PM | 0 (0.0%) | 0 (0.0%) |
| 4:00 PM to 11:59 PM | 8 (32.0%) | 0 (0.0%) |
| Total | 25 (100.0%) | 50 (100.0%) |
Housing Occupancy in Bangor
Occupancy by Ownership in Bangor
Of the total 185 dwellings in Bangor, owner-occupied units account for 185 (100.0%), while renter-occupied units make up 0 (0.0%).
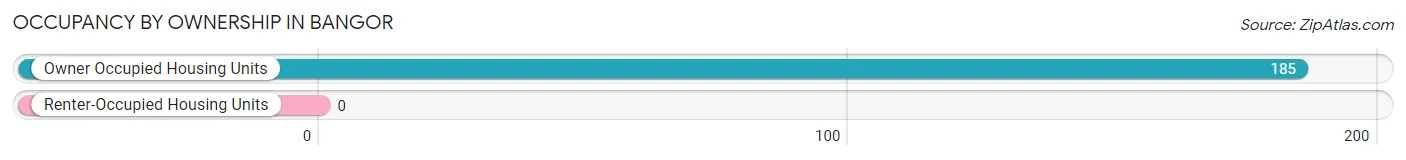
| Occupancy | # Housing Units | % Housing Units |
| Owner Occupied Housing Units | 185 | 100.0% |
| Renter-Occupied Housing Units | 0 | 0.0% |
| Total Occupied Housing Units | 185 | 100.0% |
Occupancy by Household Size in Bangor
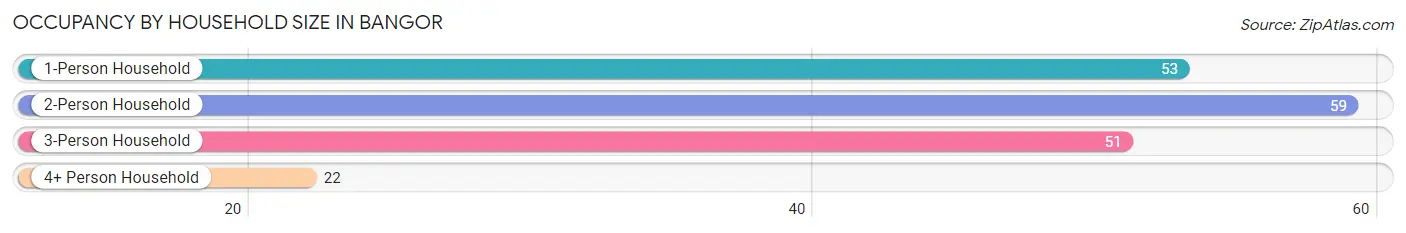
| Household Size | # Housing Units | % Housing Units |
| 1-Person Household | 53 | 28.6% |
| 2-Person Household | 59 | 31.9% |
| 3-Person Household | 51 | 27.6% |
| 4+ Person Household | 22 | 11.9% |
| Total Housing Units | 185 | 100.0% |
Occupancy by Ownership by Household Size in Bangor
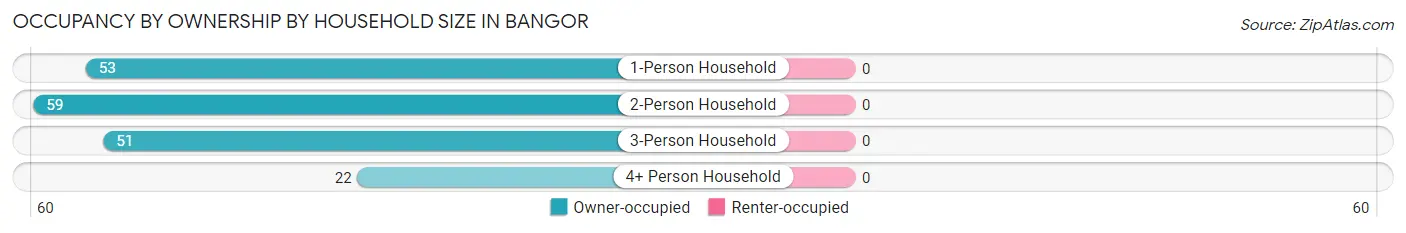
| Household Size | Owner-occupied | Renter-occupied |
| 1-Person Household | 53 (100.0%) | 0 (0.0%) |
| 2-Person Household | 59 (100.0%) | 0 (0.0%) |
| 3-Person Household | 51 (100.0%) | 0 (0.0%) |
| 4+ Person Household | 22 (100.0%) | 0 (0.0%) |
| Total Housing Units | 185 (100.0%) | 0 (0.0%) |
Occupancy by Educational Attainment in Bangor
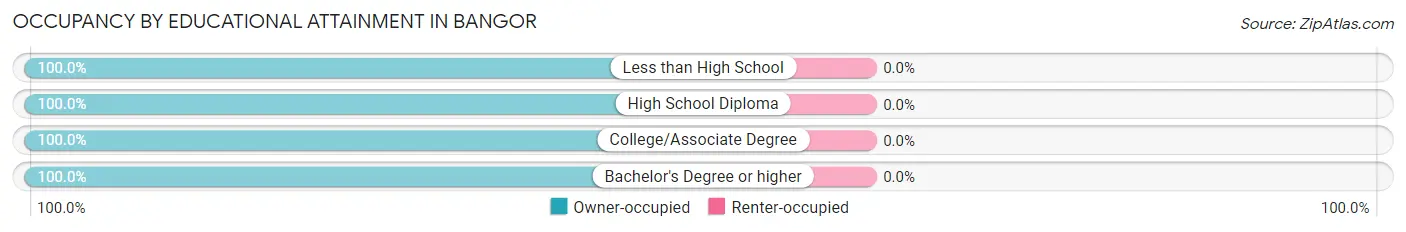
| Household Size | Owner-occupied | Renter-occupied |
| Less than High School | 38 (100.0%) | 0 (0.0%) |
| High School Diploma | 60 (100.0%) | 0 (0.0%) |
| College/Associate Degree | 45 (100.0%) | 0 (0.0%) |
| Bachelor's Degree or higher | 42 (100.0%) | 0 (0.0%) |
Occupancy by Age of Householder in Bangor
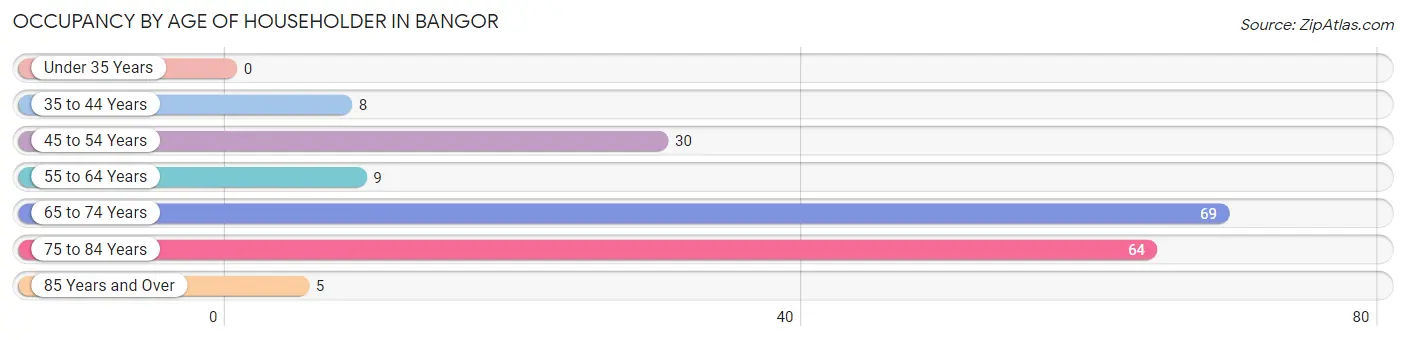
| Age Bracket | # Households | % Households |
| Under 35 Years | 0 | 0.0% |
| 35 to 44 Years | 8 | 4.3% |
| 45 to 54 Years | 30 | 16.2% |
| 55 to 64 Years | 9 | 4.9% |
| 65 to 74 Years | 69 | 37.3% |
| 75 to 84 Years | 64 | 34.6% |
| 85 Years and Over | 5 | 2.7% |
| Total | 185 | 100.0% |
Housing Finances in Bangor
Median Income by Occupancy in Bangor
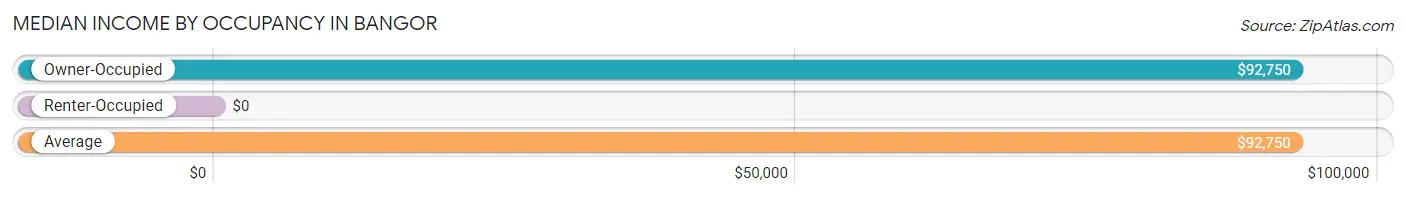
| Occupancy Type | # Households | Median Income |
| Owner-Occupied | 185 (100.0%) | $92,750 |
| Renter-Occupied | 0 (0.0%) | $0 |
| Average | 185 (100.0%) | $92,750 |
Occupancy by Householder Income Bracket in Bangor
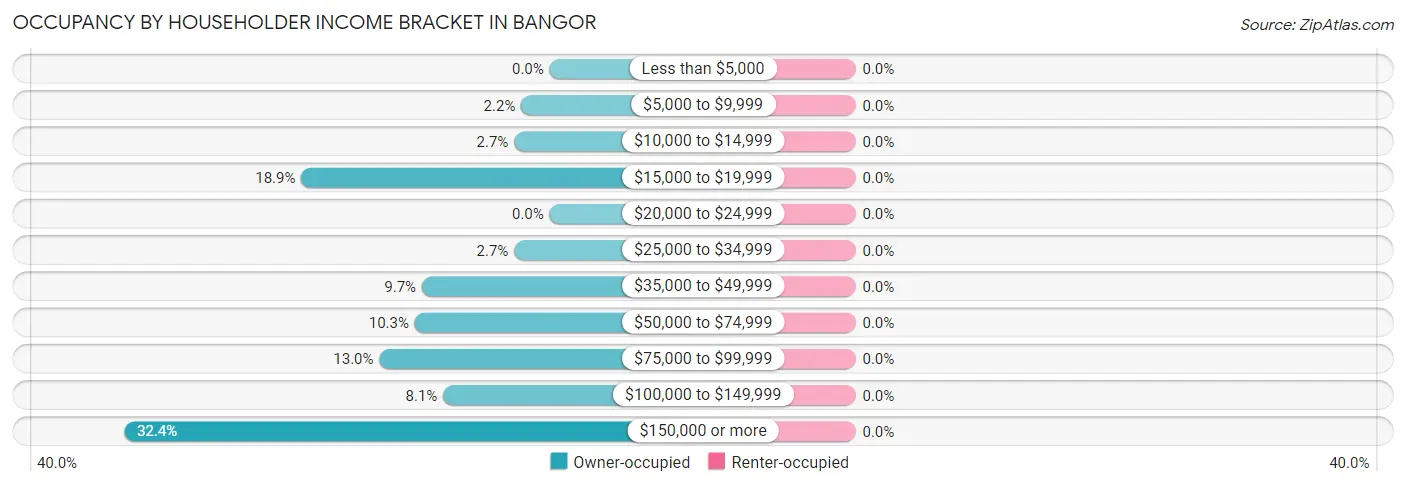
| Income Bracket | Owner-occupied | Renter-occupied |
| Less than $5,000 | 0 (0.0%) | 0 (0.0%) |
| $5,000 to $9,999 | 4 (2.2%) | 0 (0.0%) |
| $10,000 to $14,999 | 5 (2.7%) | 0 (0.0%) |
| $15,000 to $19,999 | 35 (18.9%) | 0 (0.0%) |
| $20,000 to $24,999 | 0 (0.0%) | 0 (0.0%) |
| $25,000 to $34,999 | 5 (2.7%) | 0 (0.0%) |
| $35,000 to $49,999 | 18 (9.7%) | 0 (0.0%) |
| $50,000 to $74,999 | 19 (10.3%) | 0 (0.0%) |
| $75,000 to $99,999 | 24 (13.0%) | 0 (0.0%) |
| $100,000 to $149,999 | 15 (8.1%) | 0 (0.0%) |
| $150,000 or more | 60 (32.4%) | 0 (0.0%) |
| Total | 185 (100.0%) | 0 (0.0%) |
Monthly Housing Cost Tiers in Bangor
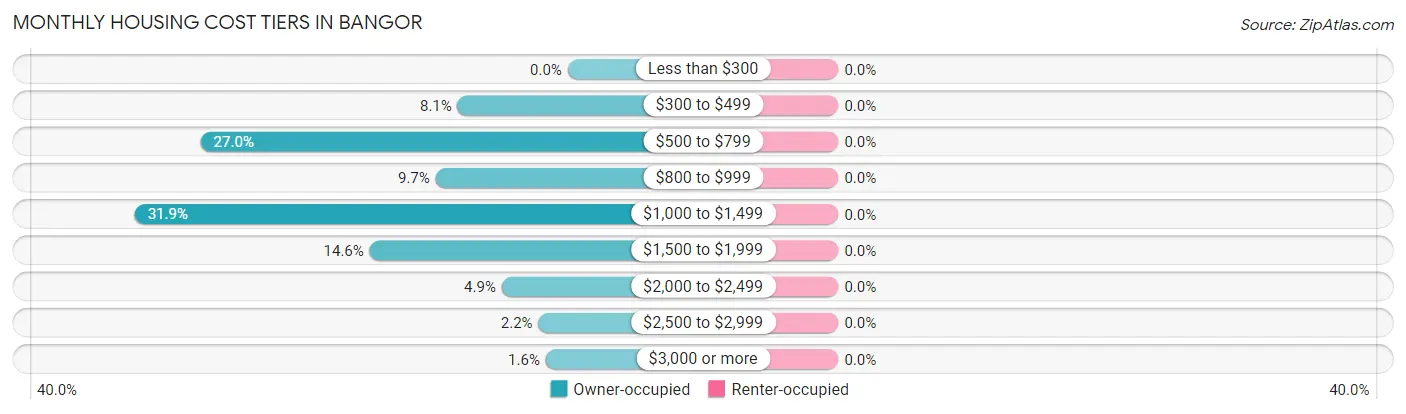
| Monthly Cost | Owner-occupied | Renter-occupied |
| Less than $300 | 0 (0.0%) | 0 (0.0%) |
| $300 to $499 | 15 (8.1%) | 0 (0.0%) |
| $500 to $799 | 50 (27.0%) | 0 (0.0%) |
| $800 to $999 | 18 (9.7%) | 0 (0.0%) |
| $1,000 to $1,499 | 59 (31.9%) | 0 (0.0%) |
| $1,500 to $1,999 | 27 (14.6%) | 0 (0.0%) |
| $2,000 to $2,499 | 9 (4.9%) | 0 (0.0%) |
| $2,500 to $2,999 | 4 (2.2%) | 0 (0.0%) |
| $3,000 or more | 3 (1.6%) | 0 (0.0%) |
| Total | 185 (100.0%) | 0 (0.0%) |
Physical Housing Characteristics in Bangor
Housing Structures in Bangor
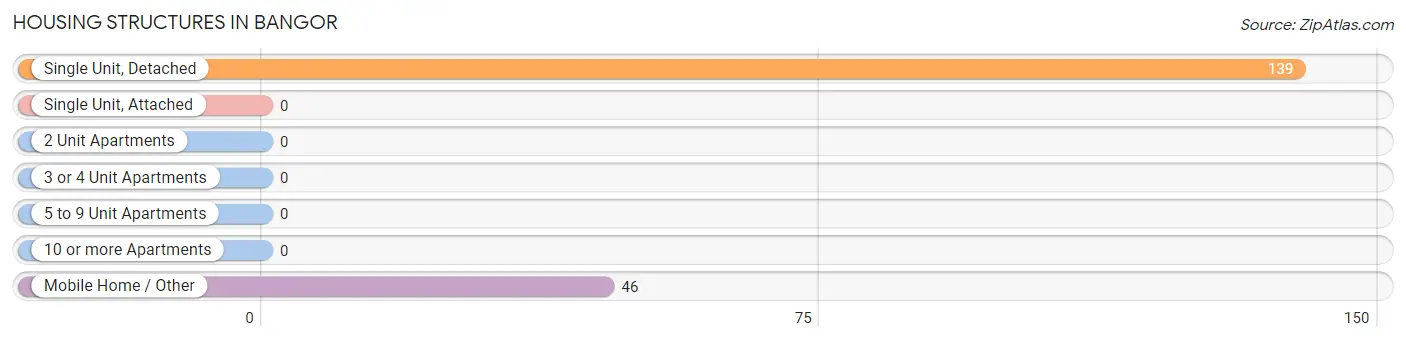
| Structure Type | # Housing Units | % Housing Units |
| Single Unit, Detached | 139 | 75.1% |
| Single Unit, Attached | 0 | 0.0% |
| 2 Unit Apartments | 0 | 0.0% |
| 3 or 4 Unit Apartments | 0 | 0.0% |
| 5 to 9 Unit Apartments | 0 | 0.0% |
| 10 or more Apartments | 0 | 0.0% |
| Mobile Home / Other | 46 | 24.9% |
| Total | 185 | 100.0% |
Housing Structures by Occupancy in Bangor
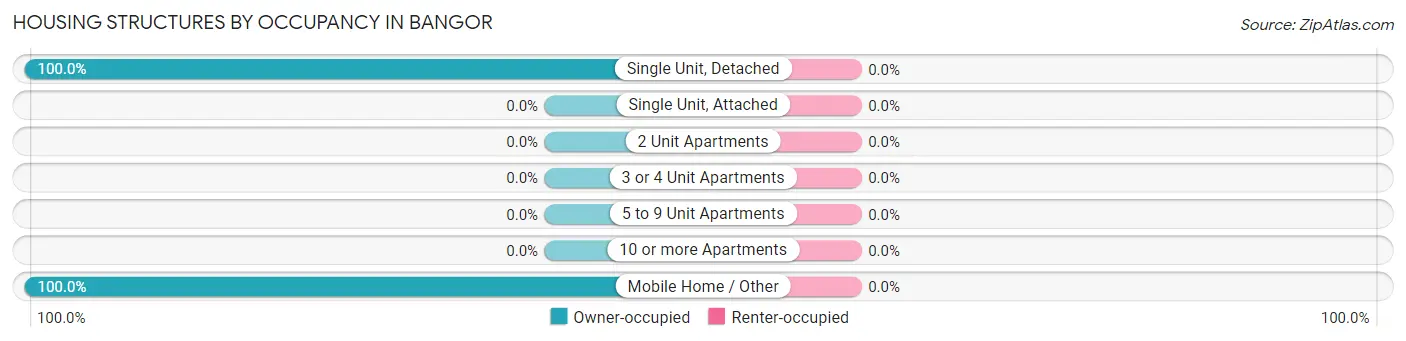
| Structure Type | Owner-occupied | Renter-occupied |
| Single Unit, Detached | 139 (100.0%) | 0 (0.0%) |
| Single Unit, Attached | 0 (0.0%) | 0 (0.0%) |
| 2 Unit Apartments | 0 (0.0%) | 0 (0.0%) |
| 3 or 4 Unit Apartments | 0 (0.0%) | 0 (0.0%) |
| 5 to 9 Unit Apartments | 0 (0.0%) | 0 (0.0%) |
| 10 or more Apartments | 0 (0.0%) | 0 (0.0%) |
| Mobile Home / Other | 46 (100.0%) | 0 (0.0%) |
| Total | 185 (100.0%) | 0 (0.0%) |
Housing Structures by Number of Rooms in Bangor
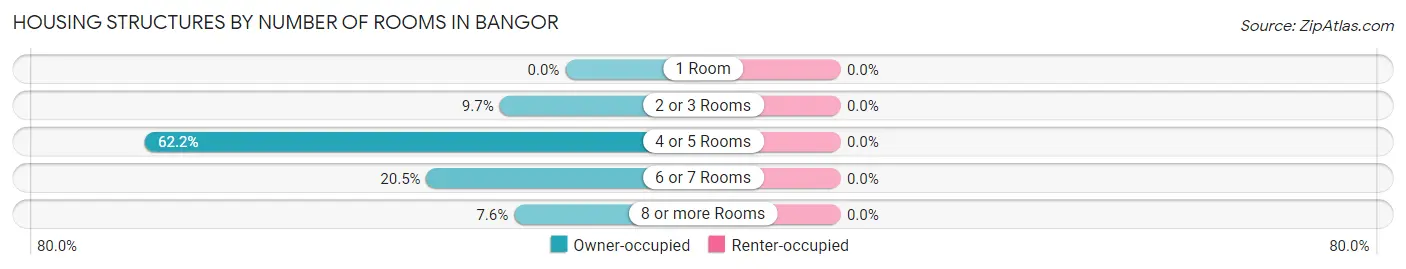
| Number of Rooms | Owner-occupied | Renter-occupied |
| 1 Room | 0 (0.0%) | 0 (0.0%) |
| 2 or 3 Rooms | 18 (9.7%) | 0 (0.0%) |
| 4 or 5 Rooms | 115 (62.2%) | 0 (0.0%) |
| 6 or 7 Rooms | 38 (20.5%) | 0 (0.0%) |
| 8 or more Rooms | 14 (7.6%) | 0 (0.0%) |
| Total | 185 (100.0%) | 0 (0.0%) |
Housing Structure by Heating Type in Bangor
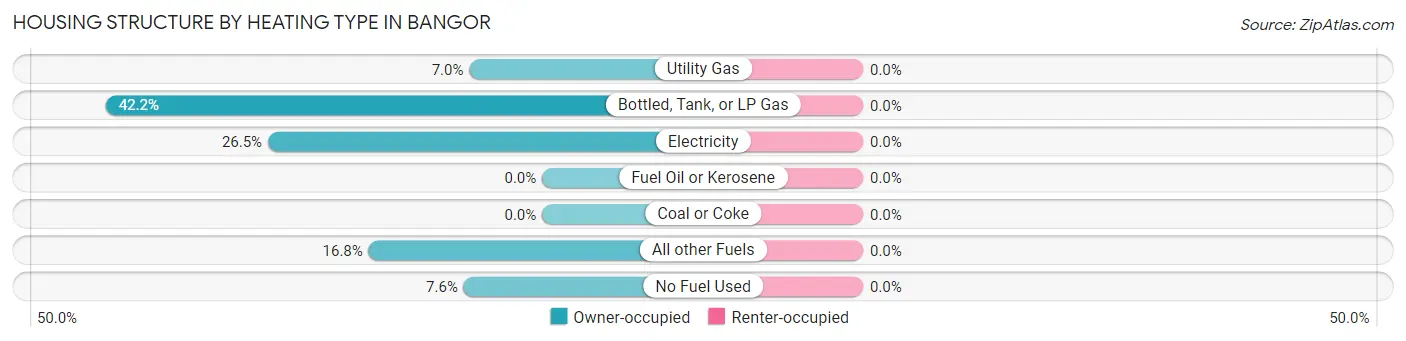
| Heating Type | Owner-occupied | Renter-occupied |
| Utility Gas | 13 (7.0%) | 0 (0.0%) |
| Bottled, Tank, or LP Gas | 78 (42.2%) | 0 (0.0%) |
| Electricity | 49 (26.5%) | 0 (0.0%) |
| Fuel Oil or Kerosene | 0 (0.0%) | 0 (0.0%) |
| Coal or Coke | 0 (0.0%) | 0 (0.0%) |
| All other Fuels | 31 (16.8%) | 0 (0.0%) |
| No Fuel Used | 14 (7.6%) | 0 (0.0%) |
| Total | 185 (100.0%) | 0 (0.0%) |
Household Vehicle Usage in Bangor
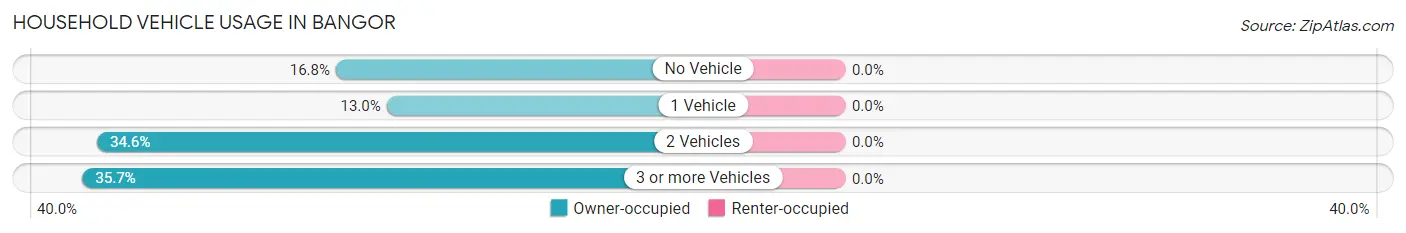
| Vehicles per Household | Owner-occupied | Renter-occupied |
| No Vehicle | 31 (16.8%) | 0 (0.0%) |
| 1 Vehicle | 24 (13.0%) | 0 (0.0%) |
| 2 Vehicles | 64 (34.6%) | 0 (0.0%) |
| 3 or more Vehicles | 66 (35.7%) | 0 (0.0%) |
| Total | 185 (100.0%) | 0 (0.0%) |
Real Estate & Mortgages in Bangor
Real Estate and Mortgage Overview in Bangor
| Characteristic | Without Mortgage | With Mortgage |
| Housing Units | 86 | 99 |
| Median Property Value | $340,000 | $346,800 |
| Median Household Income | $69,583 | $47 |
| Monthly Housing Costs | $652 | $3 |
| Real Estate Taxes | $2,000 | $4 |
Property Value by Mortgage Status in Bangor
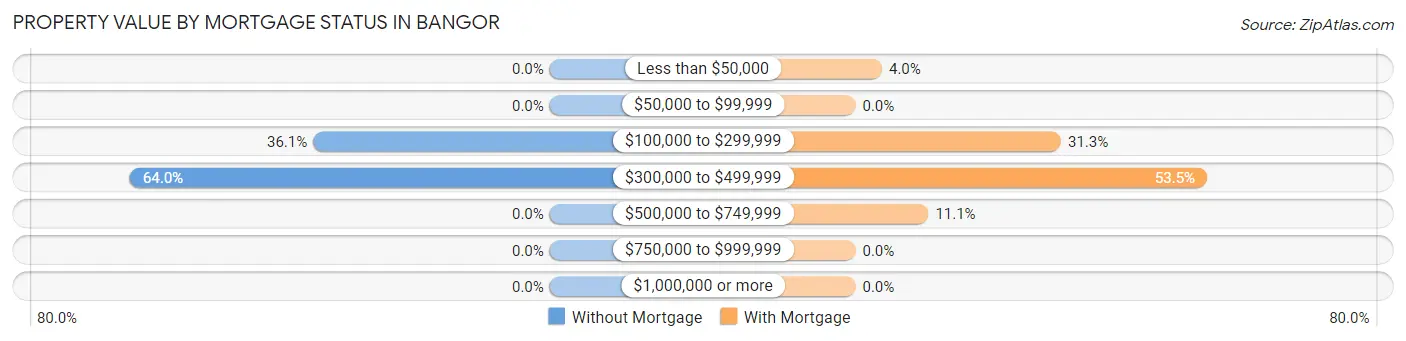
| Property Value | Without Mortgage | With Mortgage |
| Less than $50,000 | 0 (0.0%) | 4 (4.0%) |
| $50,000 to $99,999 | 0 (0.0%) | 0 (0.0%) |
| $100,000 to $299,999 | 31 (36.0%) | 31 (31.3%) |
| $300,000 to $499,999 | 55 (63.9%) | 53 (53.5%) |
| $500,000 to $749,999 | 0 (0.0%) | 11 (11.1%) |
| $750,000 to $999,999 | 0 (0.0%) | 0 (0.0%) |
| $1,000,000 or more | 0 (0.0%) | 0 (0.0%) |
| Total | 86 (100.0%) | 99 (100.0%) |
Household Income by Mortgage Status in Bangor
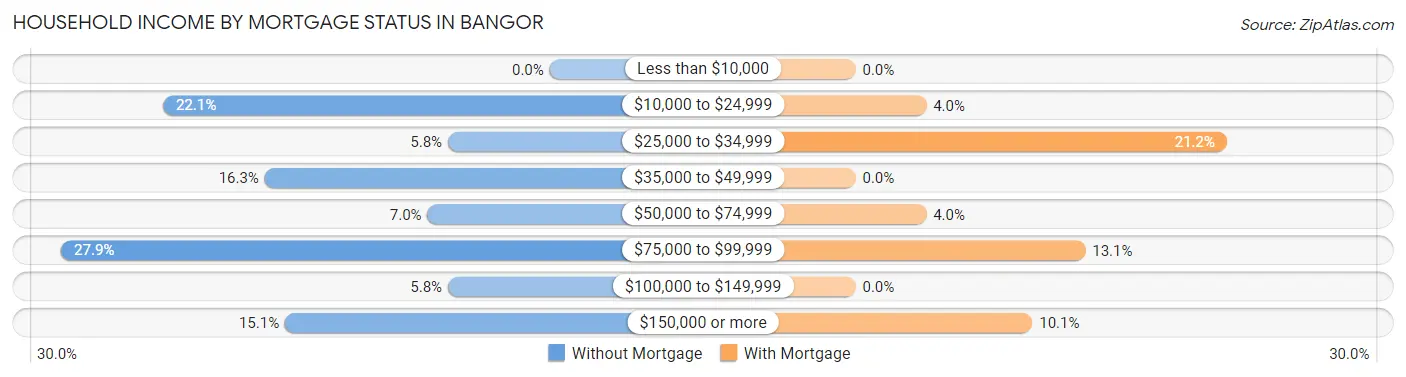
| Household Income | Without Mortgage | With Mortgage |
| Less than $10,000 | 0 (0.0%) | 0 (0.0%) |
| $10,000 to $24,999 | 19 (22.1%) | 4 (4.0%) |
| $25,000 to $34,999 | 5 (5.8%) | 21 (21.2%) |
| $35,000 to $49,999 | 14 (16.3%) | 0 (0.0%) |
| $50,000 to $74,999 | 6 (7.0%) | 4 (4.0%) |
| $75,000 to $99,999 | 24 (27.9%) | 13 (13.1%) |
| $100,000 to $149,999 | 5 (5.8%) | 0 (0.0%) |
| $150,000 or more | 13 (15.1%) | 10 (10.1%) |
| Total | 86 (100.0%) | 99 (100.0%) |
Property Value to Household Income Ratio in Bangor
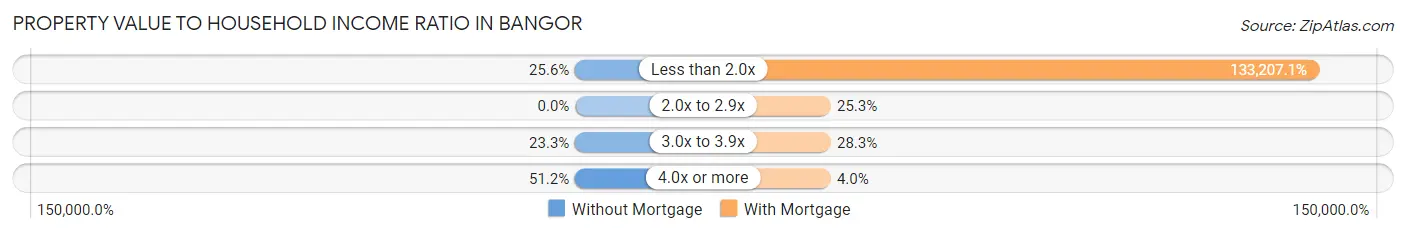
| Value-to-Income Ratio | Without Mortgage | With Mortgage |
| Less than 2.0x | 22 (25.6%) | 131,875 (133,207.1%) |
| 2.0x to 2.9x | 0 (0.0%) | 25 (25.3%) |
| 3.0x to 3.9x | 20 (23.3%) | 28 (28.3%) |
| 4.0x or more | 44 (51.2%) | 4 (4.0%) |
| Total | 86 (100.0%) | 99 (100.0%) |
Real Estate Taxes by Mortgage Status in Bangor
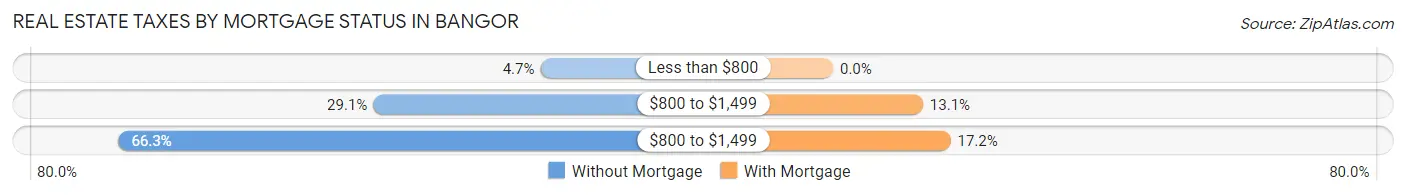
| Property Taxes | Without Mortgage | With Mortgage |
| Less than $800 | 4 (4.6%) | 0 (0.0%) |
| $800 to $1,499 | 25 (29.1%) | 13 (13.1%) |
| $800 to $1,499 | 57 (66.3%) | 17 (17.2%) |
| Total | 86 (100.0%) | 99 (100.0%) |
Health & Disability in Bangor
Health Insurance Coverage by Age in Bangor
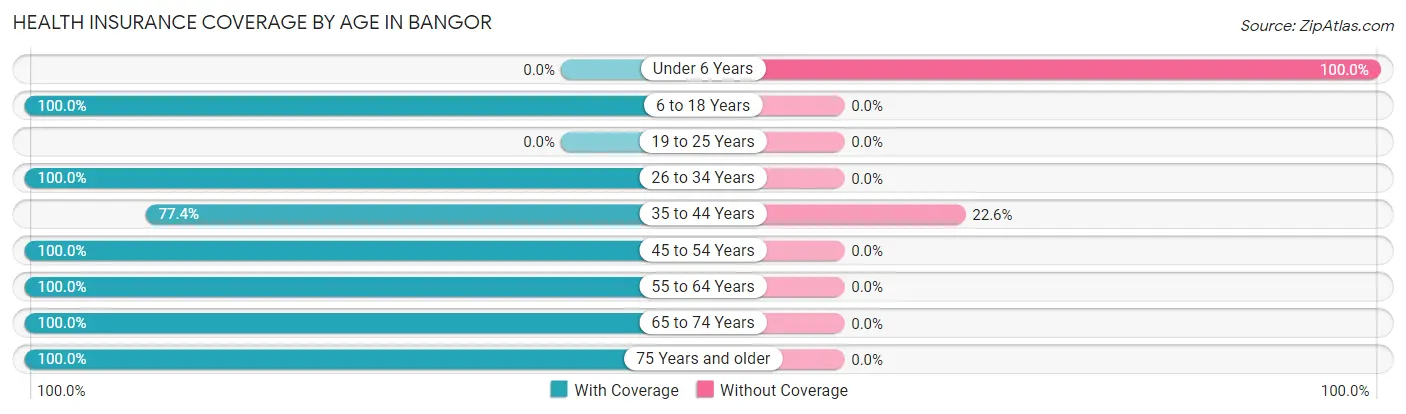
| Age Bracket | With Coverage | Without Coverage |
| Under 6 Years | 0 (0.0%) | 7 (100.0%) |
| 6 to 18 Years | 30 (100.0%) | 0 (0.0%) |
| 19 to 25 Years | 0 (0.0%) | 0 (0.0%) |
| 26 to 34 Years | 5 (100.0%) | 0 (0.0%) |
| 35 to 44 Years | 24 (77.4%) | 7 (22.6%) |
| 45 to 54 Years | 65 (100.0%) | 0 (0.0%) |
| 55 to 64 Years | 30 (100.0%) | 0 (0.0%) |
| 65 to 74 Years | 139 (100.0%) | 0 (0.0%) |
| 75 Years and older | 92 (100.0%) | 0 (0.0%) |
| Total | 385 (96.5%) | 14 (3.5%) |
Health Insurance Coverage by Citizenship Status in Bangor
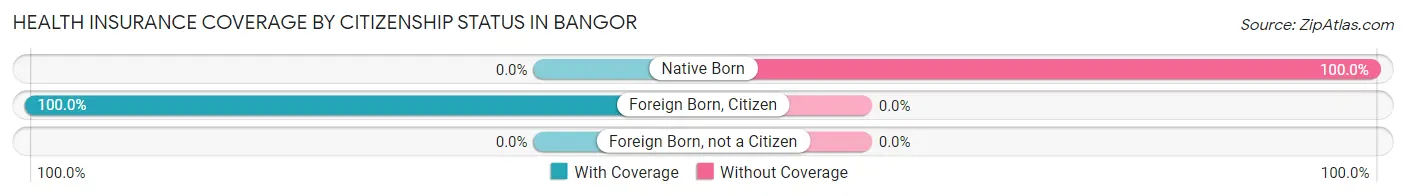
| Citizenship Status | With Coverage | Without Coverage |
| Native Born | 0 (0.0%) | 7 (100.0%) |
| Foreign Born, Citizen | 30 (100.0%) | 0 (0.0%) |
| Foreign Born, not a Citizen | 0 (0.0%) | 0 (0.0%) |
Health Insurance Coverage by Household Income in Bangor
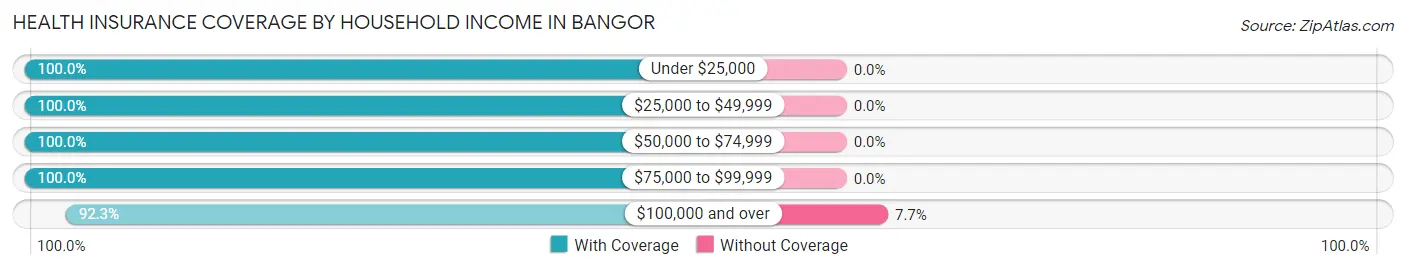
| Household Income | With Coverage | Without Coverage |
| Under $25,000 | 48 (100.0%) | 0 (0.0%) |
| $25,000 to $49,999 | 62 (100.0%) | 0 (0.0%) |
| $50,000 to $74,999 | 55 (100.0%) | 0 (0.0%) |
| $75,000 to $99,999 | 53 (100.0%) | 0 (0.0%) |
| $100,000 and over | 167 (92.3%) | 14 (7.7%) |
Public vs Private Health Insurance Coverage by Age in Bangor
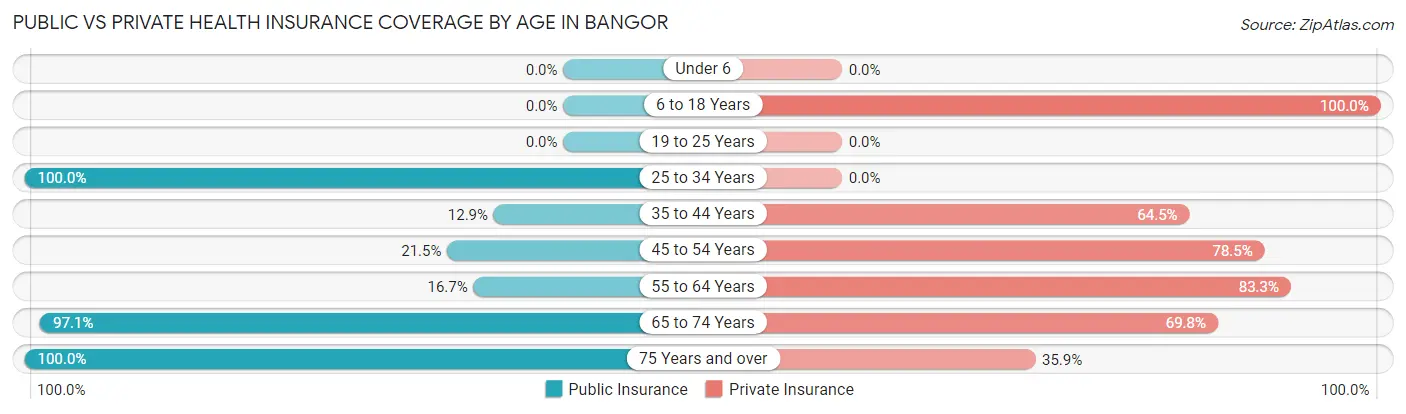
| Age Bracket | Public Insurance | Private Insurance |
| Under 6 | 0 (0.0%) | 0 (0.0%) |
| 6 to 18 Years | 0 (0.0%) | 30 (100.0%) |
| 19 to 25 Years | 0 (0.0%) | 0 (0.0%) |
| 25 to 34 Years | 5 (100.0%) | 0 (0.0%) |
| 35 to 44 Years | 4 (12.9%) | 20 (64.5%) |
| 45 to 54 Years | 14 (21.5%) | 51 (78.5%) |
| 55 to 64 Years | 5 (16.7%) | 25 (83.3%) |
| 65 to 74 Years | 135 (97.1%) | 97 (69.8%) |
| 75 Years and over | 92 (100.0%) | 33 (35.9%) |
| Total | 255 (63.9%) | 256 (64.2%) |
Disability Status by Sex by Age in Bangor
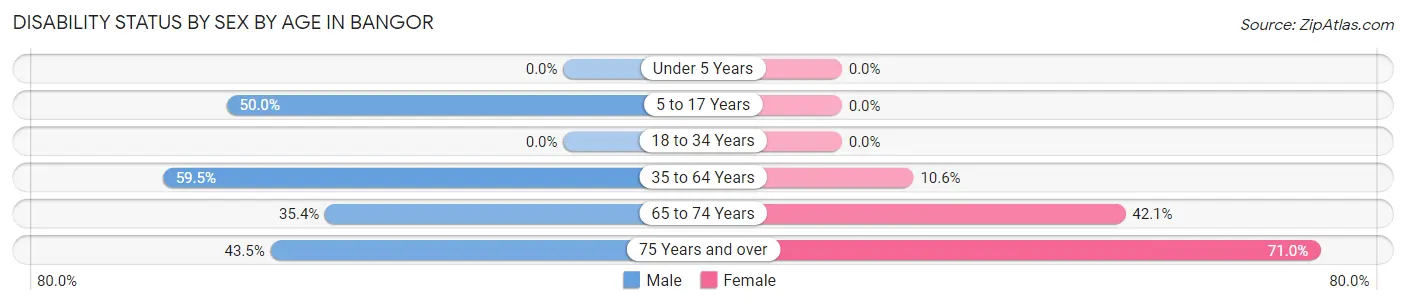
| Age Bracket | Male | Female |
| Under 5 Years | 0 (0.0%) | 0 (0.0%) |
| 5 to 17 Years | 8 (50.0%) | 0 (0.0%) |
| 18 to 34 Years | 0 (0.0%) | 0 (0.0%) |
| 35 to 64 Years | 47 (59.5%) | 5 (10.6%) |
| 65 to 74 Years | 29 (35.4%) | 24 (42.1%) |
| 75 Years and over | 10 (43.5%) | 49 (71.0%) |
Disability Class by Sex by Age in Bangor
Disability Class: Hearing Difficulty
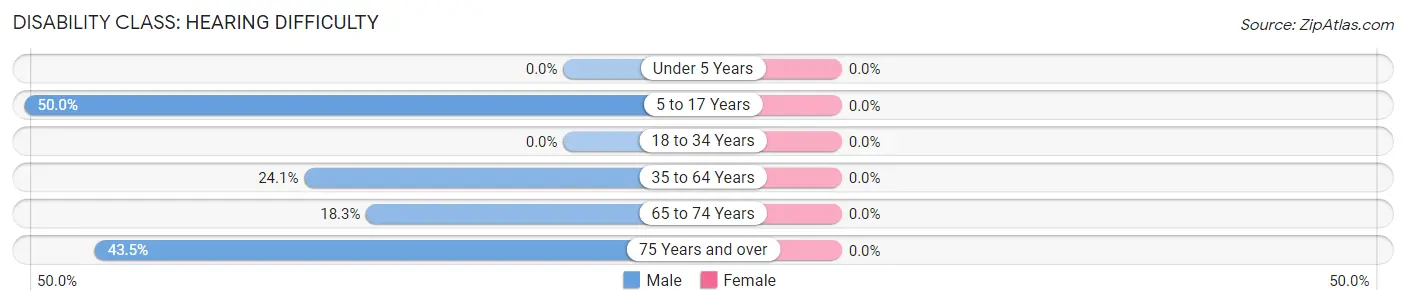
| Age Bracket | Male | Female |
| Under 5 Years | 0 (0.0%) | 0 (0.0%) |
| 5 to 17 Years | 8 (50.0%) | 0 (0.0%) |
| 18 to 34 Years | 0 (0.0%) | 0 (0.0%) |
| 35 to 64 Years | 19 (24.0%) | 0 (0.0%) |
| 65 to 74 Years | 15 (18.3%) | 0 (0.0%) |
| 75 Years and over | 10 (43.5%) | 0 (0.0%) |
Disability Class: Vision Difficulty
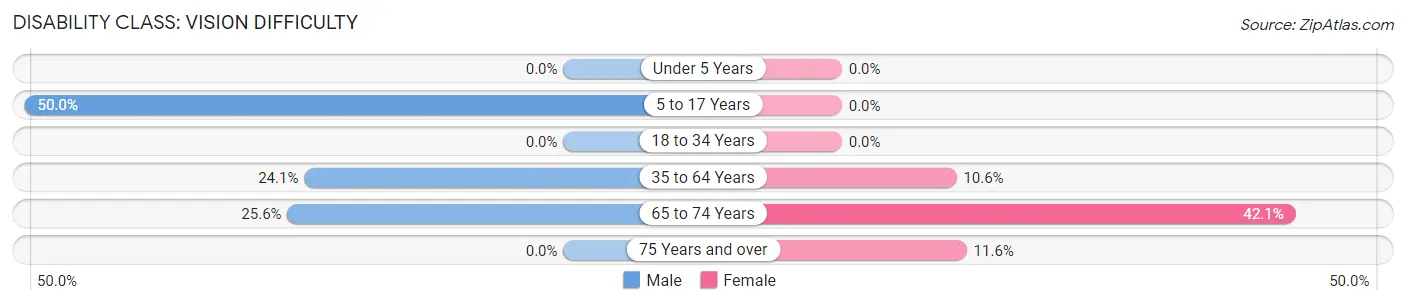
| Age Bracket | Male | Female |
| Under 5 Years | 0 (0.0%) | 0 (0.0%) |
| 5 to 17 Years | 8 (50.0%) | 0 (0.0%) |
| 18 to 34 Years | 0 (0.0%) | 0 (0.0%) |
| 35 to 64 Years | 19 (24.0%) | 5 (10.6%) |
| 65 to 74 Years | 21 (25.6%) | 24 (42.1%) |
| 75 Years and over | 0 (0.0%) | 8 (11.6%) |
Disability Class: Cognitive Difficulty
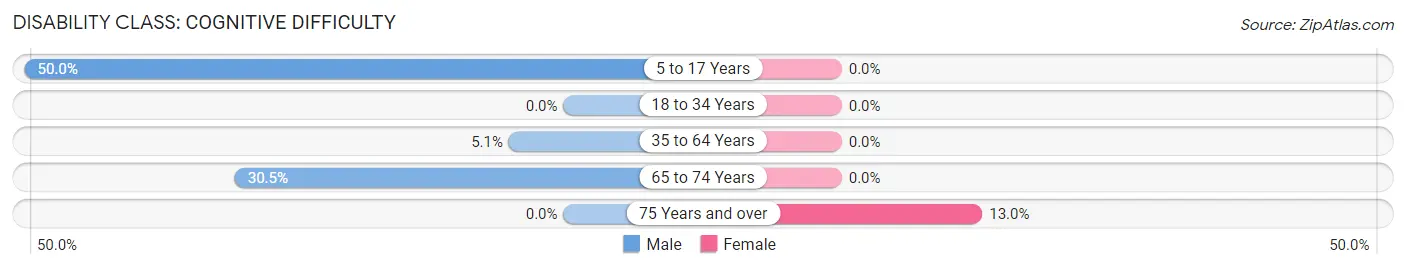
| Age Bracket | Male | Female |
| 5 to 17 Years | 8 (50.0%) | 0 (0.0%) |
| 18 to 34 Years | 0 (0.0%) | 0 (0.0%) |
| 35 to 64 Years | 4 (5.1%) | 0 (0.0%) |
| 65 to 74 Years | 25 (30.5%) | 0 (0.0%) |
| 75 Years and over | 0 (0.0%) | 9 (13.0%) |
Disability Class: Ambulatory Difficulty
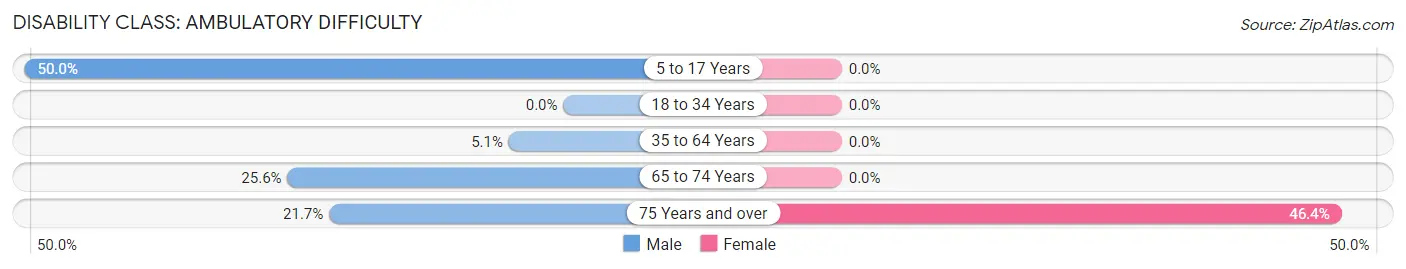
| Age Bracket | Male | Female |
| 5 to 17 Years | 8 (50.0%) | 0 (0.0%) |
| 18 to 34 Years | 0 (0.0%) | 0 (0.0%) |
| 35 to 64 Years | 4 (5.1%) | 0 (0.0%) |
| 65 to 74 Years | 21 (25.6%) | 0 (0.0%) |
| 75 Years and over | 5 (21.7%) | 32 (46.4%) |
Disability Class: Self-Care Difficulty
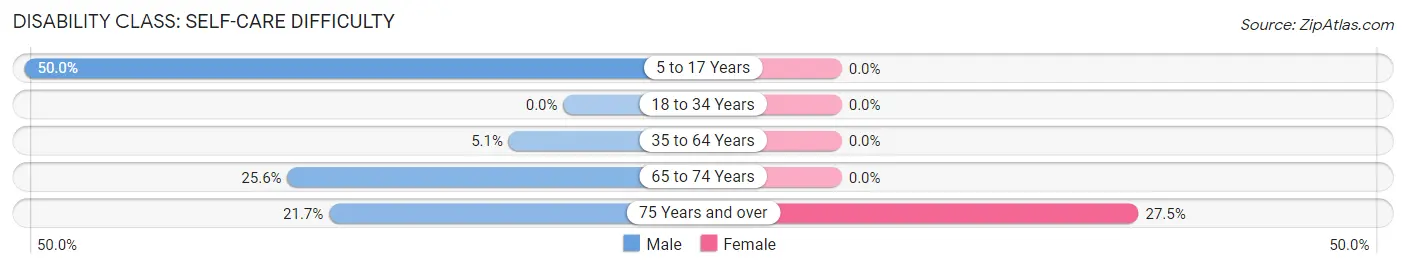
| Age Bracket | Male | Female |
| 5 to 17 Years | 8 (50.0%) | 0 (0.0%) |
| 18 to 34 Years | 0 (0.0%) | 0 (0.0%) |
| 35 to 64 Years | 4 (5.1%) | 0 (0.0%) |
| 65 to 74 Years | 21 (25.6%) | 0 (0.0%) |
| 75 Years and over | 5 (21.7%) | 19 (27.5%) |
Technology Access in Bangor
Computing Device Access in Bangor
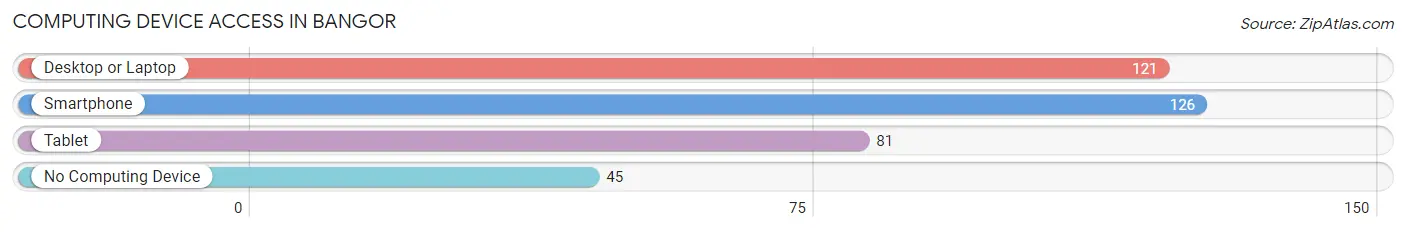
| Device Type | # Households | % Households |
| Desktop or Laptop | 121 | 65.4% |
| Smartphone | 126 | 68.1% |
| Tablet | 81 | 43.8% |
| No Computing Device | 45 | 24.3% |
| Total | 185 | 100.0% |
Internet Access in Bangor
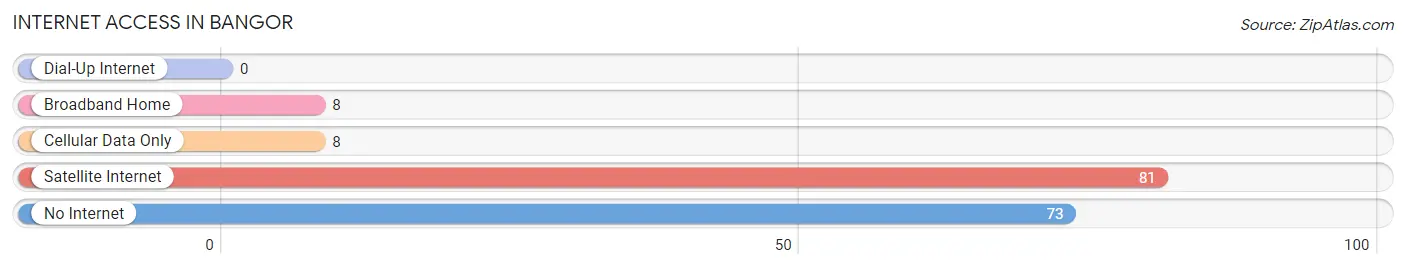
| Internet Type | # Households | % Households |
| Dial-Up Internet | 0 | 0.0% |
| Broadband Home | 8 | 4.3% |
| Cellular Data Only | 8 | 4.3% |
| Satellite Internet | 81 | 43.8% |
| No Internet | 73 | 39.5% |
| Total | 185 | 100.0% |
Bangor Summary
Bangor is a small unincorporated community located in Butte County, California. It is situated in the foothills of the Sierra Nevada Mountains, approximately 10 miles east of Oroville. The population of Bangor was estimated to be 1,845 in 2019.
History
Bangor was founded in 1849 by a group of miners who were searching for gold in the area. The town was named after Bangor, Maine, the hometown of one of the miners. The town quickly grew and by 1852, it had a population of over 1,000 people. The town was home to several businesses, including a hotel, saloon, and general store.
In 1855, the town was destroyed by a fire. The town was rebuilt and continued to grow, but it was never able to regain its former glory. By the late 1800s, the population had declined to around 500 people.
In the early 1900s, the town began to decline further as the gold rush ended and the population moved away. By the 1950s, the population had dropped to around 200 people.
Geography
Bangor is located in the foothills of the Sierra Nevada Mountains, approximately 10 miles east of Oroville. The town is situated at an elevation of 1,845 feet above sea level. The town is surrounded by rolling hills and is located near the Feather River.
The climate in Bangor is hot and dry in the summer and cold and wet in the winter. The average high temperature in the summer is around 90 degrees Fahrenheit and the average low temperature in the winter is around 40 degrees Fahrenheit.
Economy
The economy of Bangor is largely based on agriculture. The town is home to several farms that produce a variety of crops, including almonds, walnuts, and olives. The town is also home to several wineries and vineyards.
The town is also home to several small businesses, including a gas station, a grocery store, and a hardware store.
Demographics
The population of Bangor was estimated to be 1,845 in 2019. The town is predominantly white, with around 90% of the population identifying as white. The remaining 10% of the population is made up of African Americans, Hispanics, and Asians.
The median household income in Bangor is around $50,000 per year. The median home value is around $200,000. The town has a high rate of homeownership, with around 75% of the population owning their own homes.
Conclusion
Bangor is a small unincorporated community located in Butte County, California. It is situated in the foothills of the Sierra Nevada Mountains, approximately 10 miles east of Oroville. The population of Bangor was estimated to be 1,845 in 2019. The town is predominantly white, with around 90% of the population identifying as white. The economy of Bangor is largely based on agriculture, with several farms producing a variety of crops. The town is also home to several small businesses, including a gas station, a grocery store, and a hardware store.
Common Questions
What is Per Capita Income in Bangor?
Per Capita income in Bangor is $55,705.
What is the Median Family Income in Bangor?
Median Family Income in Bangor is $96,250.
What is the Median Household income in Bangor?
Median Household Income in Bangor is $92,750.
What is Income or Wage Gap in Bangor?
Income or Wage Gap in Bangor is 73.4%.
Women in Bangor earn 26.6 cents for every dollar earned by a man.
What is Inequality or Gini Index in Bangor?
Inequality or Gini Index in Bangor is 0.49.
What is the Total Population of Bangor?
Total Population of Bangor is 399.
What is the Total Male Population of Bangor?
Total Male Population of Bangor is 207.
What is the Total Female Population of Bangor?
Total Female Population of Bangor is 192.
What is the Ratio of Males per 100 Females in Bangor?
There are 107.81 Males per 100 Females in Bangor.
What is the Ratio of Females per 100 Males in Bangor?
There are 92.75 Females per 100 Males in Bangor.
What is the Median Population Age in Bangor?
Median Population Age in Bangor is 66.7 Years.
What is the Average Family Size in Bangor
Average Family Size in Bangor is 2.7 People.
What is the Average Household Size in Bangor
Average Household Size in Bangor is 2.2 People.
How Large is the Labor Force in Bangor?
There are 95 People in the Labor Forcein in Bangor.
What is the Percentage of People in the Labor Force in Bangor?
26.2% of People are in the Labor Force in Bangor.