Cities with the Highest Percentage of Population with a Degree in Computers and Mathematics in Texas
RELATED REPORTS & OPTIONS
Computers and Mathematics
Texas
Compare Cities
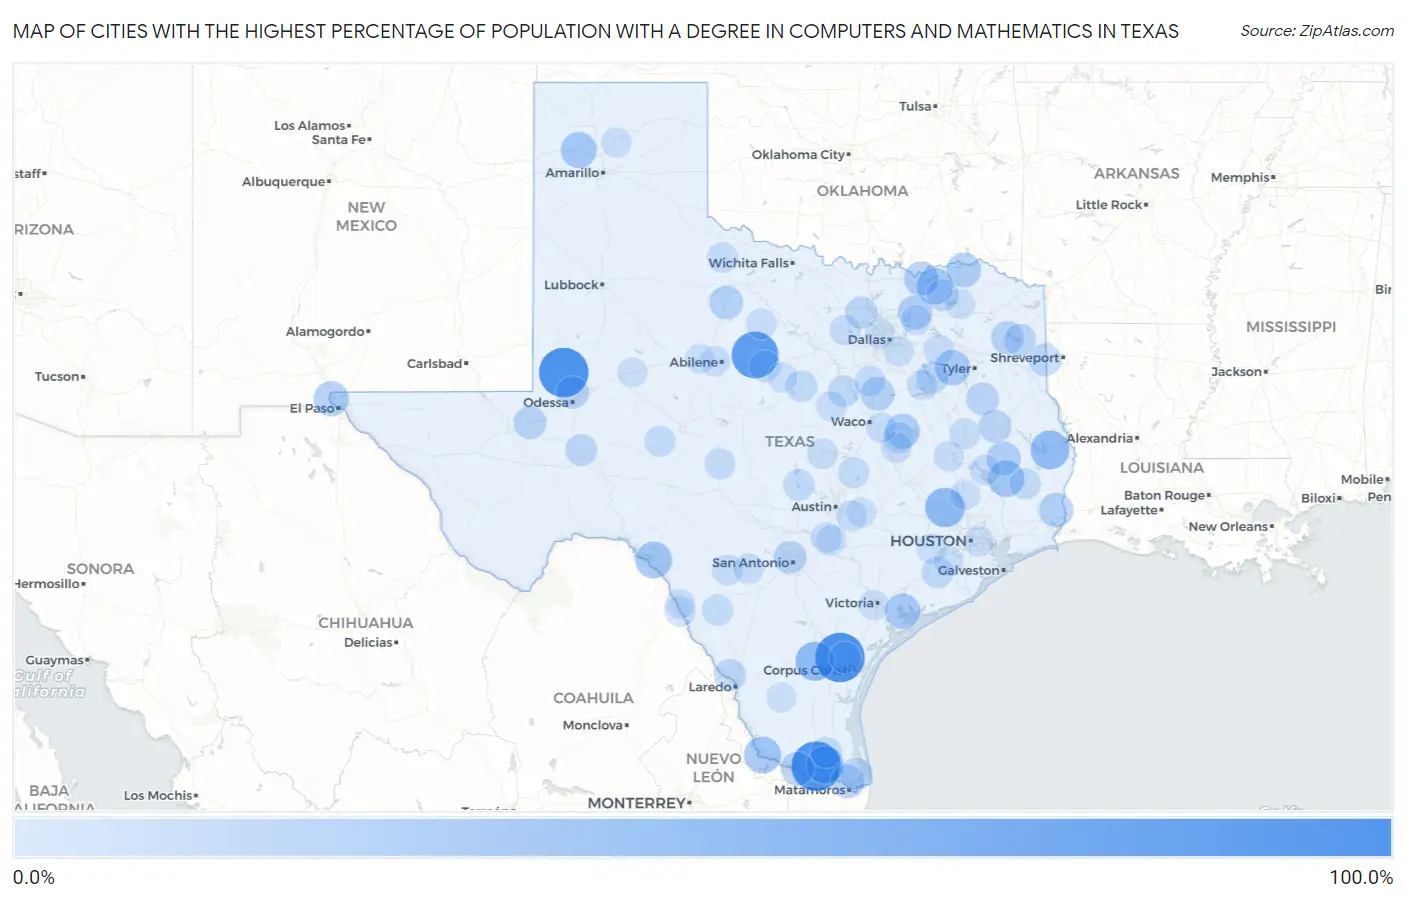
Map of Cities with the Highest Percentage of Population with a Degree in Computers and Mathematics in Texas
0.0%
100.0%
Cities with the Highest Percentage of Population with a Degree in Computers and Mathematics in Texas
| City | % Graduates | vs State | vs National | |
| 1. | Mckinney Acres | 100.0% | 5.2%(+94.8)#1 | 4.9%(+95.1)#2 |
| 2. | Muniz | 100.0% | 5.2%(+94.8)#2 | 4.9%(+95.1)#3 |
| 3. | Edroy | 100.0% | 5.2%(+94.8)#3 | 4.9%(+95.1)#9 |
| 4. | Moran | 87.1% | 5.2%(+81.9)#4 | 4.9%(+82.2)#40 |
| 5. | Mound | 74.4% | 5.2%(+69.2)#5 | 4.9%(+69.5)#49 |
| 6. | Todd Mission | 53.8% | 5.2%(+48.7)#6 | 4.9%(+49.0)#89 |
| 7. | Amargosa | 51.9% | 5.2%(+46.7)#7 | 4.9%(+47.0)#95 |
| 8. | Browndell | 50.0% | 5.2%(+44.8)#8 | 4.9%(+45.1)#111 |
| 9. | Laguna Seca | 45.2% | 5.2%(+40.0)#9 | 4.9%(+40.3)#134 |
| 10. | Evergreen | 42.3% | 5.2%(+37.1)#10 | 4.9%(+37.4)#150 |
| 11. | Lake View | 42.0% | 5.2%(+36.9)#11 | 4.9%(+37.1)#151 |
| 12. | Indian Springs | 40.0% | 5.2%(+34.8)#12 | 4.9%(+35.1)#161 |
| 13. | Windom | 40.0% | 5.2%(+34.8)#13 | 4.9%(+35.1)#166 |
| 14. | Boys Ranch | 38.2% | 5.2%(+33.1)#14 | 4.9%(+33.3)#186 |
| 15. | Point Comfort | 36.0% | 5.2%(+30.8)#15 | 4.9%(+31.1)#211 |
| 16. | Callender Lake | 35.5% | 5.2%(+30.3)#16 | 4.9%(+30.6)#216 |
| 17. | Prado Verde | 34.2% | 5.2%(+29.0)#17 | 4.9%(+29.3)#226 |
| 18. | Thornton | 33.3% | 5.2%(+28.2)#18 | 4.9%(+28.4)#233 |
| 19. | Powderly | 32.7% | 5.2%(+27.5)#19 | 4.9%(+27.8)#260 |
| 20. | Ravenna | 32.4% | 5.2%(+27.3)#20 | 4.9%(+27.5)#261 |
| 21. | Farmersville | 31.0% | 5.2%(+25.8)#21 | 4.9%(+26.1)#279 |
| 22. | Paige | 31.0% | 5.2%(+25.8)#22 | 4.9%(+26.1)#280 |
| 23. | Mauriceville | 30.8% | 5.2%(+25.6)#23 | 4.9%(+25.9)#281 |
| 24. | Pleasant Hill | 30.7% | 5.2%(+25.5)#24 | 4.9%(+25.8)#282 |
| 25. | Bynum | 28.6% | 5.2%(+23.4)#25 | 4.9%(+23.7)#311 |
| 26. | Weinert | 28.6% | 5.2%(+23.4)#26 | 4.9%(+23.7)#313 |
| 27. | Olmito | 28.1% | 5.2%(+22.9)#27 | 4.9%(+23.2)#322 |
| 28. | Abram | 28.1% | 5.2%(+22.9)#28 | 4.9%(+23.2)#325 |
| 29. | East Columbia | 26.9% | 5.2%(+21.7)#29 | 4.9%(+22.0)#359 |
| 30. | Center Point | 26.2% | 5.2%(+21.0)#30 | 4.9%(+21.3)#379 |
| 31. | Ore City | 25.8% | 5.2%(+20.6)#31 | 4.9%(+20.9)#390 |
| 32. | Balcones Heights | 25.5% | 5.2%(+20.3)#32 | 4.9%(+20.6)#396 |
| 33. | Pyote | 25.4% | 5.2%(+20.2)#33 | 4.9%(+20.5)#399 |
| 34. | Wells | 25.0% | 5.2%(+19.8)#34 | 4.9%(+20.1)#403 |
| 35. | Gallatin | 25.0% | 5.2%(+19.8)#35 | 4.9%(+20.1)#408 |
| 36. | Gardendale | 24.5% | 5.2%(+19.4)#36 | 4.9%(+19.6)#437 |
| 37. | Waskom | 23.3% | 5.2%(+18.2)#37 | 4.9%(+18.4)#466 |
| 38. | Harrold | 22.9% | 5.2%(+17.7)#38 | 4.9%(+18.0)#489 |
| 39. | Pine Harbor | 22.8% | 5.2%(+17.6)#39 | 4.9%(+17.9)#491 |
| 40. | Ponder | 22.7% | 5.2%(+17.5)#40 | 4.9%(+17.8)#494 |
| 41. | Caney City | 22.2% | 5.2%(+17.0)#41 | 4.9%(+17.3)#512 |
| 42. | Bayview | 21.9% | 5.2%(+16.7)#42 | 4.9%(+17.0)#523 |
| 43. | Garner | 21.7% | 5.2%(+16.6)#43 | 4.9%(+16.8)#527 |
| 44. | Pecan Gap | 21.7% | 5.2%(+16.6)#44 | 4.9%(+16.8)#529 |
| 45. | Bear Creek Ranch | 20.9% | 5.2%(+15.8)#45 | 4.9%(+16.0)#563 |
| 46. | Mccamey | 20.8% | 5.2%(+15.7)#46 | 4.9%(+15.9)#565 |
| 47. | Ranchos Penitas West | 20.8% | 5.2%(+15.7)#47 | 4.9%(+15.9)#566 |
| 48. | Morgan | 20.0% | 5.2%(+14.8)#48 | 4.9%(+15.1)#595 |
| 49. | Priddy | 20.0% | 5.2%(+14.8)#49 | 4.9%(+15.1)#616 |
| 50. | Boling | 19.7% | 5.2%(+14.5)#50 | 4.9%(+14.8)#633 |
| 51. | Dublin | 19.3% | 5.2%(+14.1)#51 | 4.9%(+14.4)#657 |
| 52. | Cisco | 19.2% | 5.2%(+14.1)#52 | 4.9%(+14.3)#660 |
| 53. | Odem | 19.1% | 5.2%(+13.9)#53 | 4.9%(+14.2)#668 |
| 54. | Alamo Beach | 18.9% | 5.2%(+13.7)#54 | 4.9%(+14.0)#679 |
| 55. | Highland Haven | 18.7% | 5.2%(+13.5)#55 | 4.9%(+13.8)#694 |
| 56. | Lasara | 18.6% | 5.2%(+13.5)#56 | 4.9%(+13.8)#698 |
| 57. | Kosse | 18.5% | 5.2%(+13.3)#57 | 4.9%(+13.6)#707 |
| 58. | Mcleod | 18.5% | 5.2%(+13.3)#58 | 4.9%(+13.6)#711 |
| 59. | Warren | 18.1% | 5.2%(+12.9)#59 | 4.9%(+13.2)#741 |
| 60. | Mertzon | 17.8% | 5.2%(+12.6)#60 | 4.9%(+12.9)#767 |
| 61. | Bartlett | 17.7% | 5.2%(+12.5)#61 | 4.9%(+12.8)#775 |
| 62. | Crystal City | 17.5% | 5.2%(+12.3)#62 | 4.9%(+12.6)#790 |
| 63. | Itasca | 17.0% | 5.2%(+11.8)#63 | 4.9%(+12.1)#837 |
| 64. | Menard | 16.7% | 5.2%(+11.5)#64 | 4.9%(+11.8)#853 |
| 65. | Rockwell Place | 16.4% | 5.2%(+11.3)#65 | 4.9%(+11.5)#888 |
| 66. | Woodson | 16.4% | 5.2%(+11.2)#66 | 4.9%(+11.5)#893 |
| 67. | Eidson Road | 16.1% | 5.2%(+10.9)#67 | 4.9%(+11.2)#917 |
| 68. | Kempner | 16.1% | 5.2%(+10.9)#68 | 4.9%(+11.2)#922 |
| 69. | Knippa | 16.1% | 5.2%(+10.9)#69 | 4.9%(+11.2)#925 |
| 70. | Redwood | 16.0% | 5.2%(+10.9)#70 | 4.9%(+11.1)#927 |
| 71. | Crowell | 16.0% | 5.2%(+10.8)#71 | 4.9%(+11.1)#931 |
| 72. | Latexo | 16.0% | 5.2%(+10.8)#72 | 4.9%(+11.1)#932 |
| 73. | Sanctuary | 16.0% | 5.2%(+10.8)#73 | 4.9%(+11.1)#933 |
| 74. | Myrtle Springs | 15.8% | 5.2%(+10.6)#74 | 4.9%(+10.9)#950 |
| 75. | Bremond | 15.6% | 5.2%(+10.4)#75 | 4.9%(+10.7)#972 |
| 76. | Onalaska | 15.3% | 5.2%(+10.1)#76 | 4.9%(+10.4)#1,010 |
| 77. | D Hanis | 15.2% | 5.2%(+10.0)#77 | 4.9%(+10.3)#1,020 |
| 78. | Midway | 15.1% | 5.2%(+9.92)#78 | 4.9%(+10.2)#1,035 |
| 79. | Wyldwood | 15.1% | 5.2%(+9.89)#79 | 4.9%(+10.2)#1,038 |
| 80. | Tira | 14.6% | 5.2%(+9.46)#80 | 4.9%(+9.74)#1,073 |
| 81. | Staples | 14.5% | 5.2%(+9.37)#81 | 4.9%(+9.65)#1,079 |
| 82. | Galena Park | 14.3% | 5.2%(+9.14)#82 | 4.9%(+9.43)#1,105 |
| 83. | Riesel | 14.3% | 5.2%(+9.11)#83 | 4.9%(+9.39)#1,107 |
| 84. | Fritch | 14.2% | 5.2%(+9.00)#84 | 4.9%(+9.28)#1,145 |
| 85. | Josephine | 13.9% | 5.2%(+8.73)#85 | 4.9%(+9.02)#1,173 |
| 86. | Wilmer | 13.8% | 5.2%(+8.59)#86 | 4.9%(+8.87)#1,194 |
| 87. | Tye | 13.7% | 5.2%(+8.55)#87 | 4.9%(+8.83)#1,200 |
| 88. | Willis | 13.6% | 5.2%(+8.47)#88 | 4.9%(+8.75)#1,210 |
| 89. | Cranfills Gap | 13.6% | 5.2%(+8.46)#89 | 4.9%(+8.74)#1,215 |
| 90. | Goodlow | 13.6% | 5.2%(+8.46)#90 | 4.9%(+8.74)#1,217 |
| 91. | Irving | 13.5% | 5.2%(+8.28)#91 | 4.9%(+8.56)#1,248 |
| 92. | Gorman | 13.3% | 5.2%(+8.16)#92 | 4.9%(+8.44)#1,261 |
| 93. | Coahoma | 13.3% | 5.2%(+8.16)#93 | 4.9%(+8.44)#1,262 |
| 94. | Trent | 13.3% | 5.2%(+8.16)#94 | 4.9%(+8.44)#1,269 |
| 95. | Camp Swift | 13.3% | 5.2%(+8.10)#95 | 4.9%(+8.38)#1,283 |
| 96. | Wallis | 13.3% | 5.2%(+8.09)#96 | 4.9%(+8.37)#1,285 |
| 97. | Quail Creek | 13.1% | 5.2%(+7.91)#97 | 4.9%(+8.19)#1,320 |
| 98. | Hebbronville | 13.0% | 5.2%(+7.87)#98 | 4.9%(+8.15)#1,326 |
| 99. | Fairchilds | 13.0% | 5.2%(+7.78)#99 | 4.9%(+8.07)#1,347 |
| 100. | Elm Creek | 12.8% | 5.2%(+7.59)#100 | 4.9%(+7.87)#1,378 |
Common Questions
What are the Top 10 Cities with the Highest Percentage of Population with a Degree in Computers and Mathematics in Texas?
Top 10 Cities with the Highest Percentage of Population with a Degree in Computers and Mathematics in Texas are:
#1
100.0%
#2
100.0%
#3
100.0%
#4
87.1%
#5
53.8%
#6
51.9%
#7
50.0%
#8
45.2%
#9
42.3%
#10
42.0%
What city has the Highest Percentage of Population with a Degree in Computers and Mathematics in Texas?
McKinney Acres has the Highest Percentage of Population with a Degree in Computers and Mathematics in Texas with 100.0%.
What is the Percentage of Population with a Degree in Computers and Mathematics in the State of Texas?
Percentage of Population with a Degree in Computers and Mathematics in Texas is 5.2%.
What is the Percentage of Population with a Degree in Computers and Mathematics in the United States?
Percentage of Population with a Degree in Computers and Mathematics in the United States is 4.9%.