Cities with the Highest Percentage of Population with a Degree in Computers and Mathematics in Arizona
RELATED REPORTS & OPTIONS
Computers and Mathematics
Arizona
Compare Cities
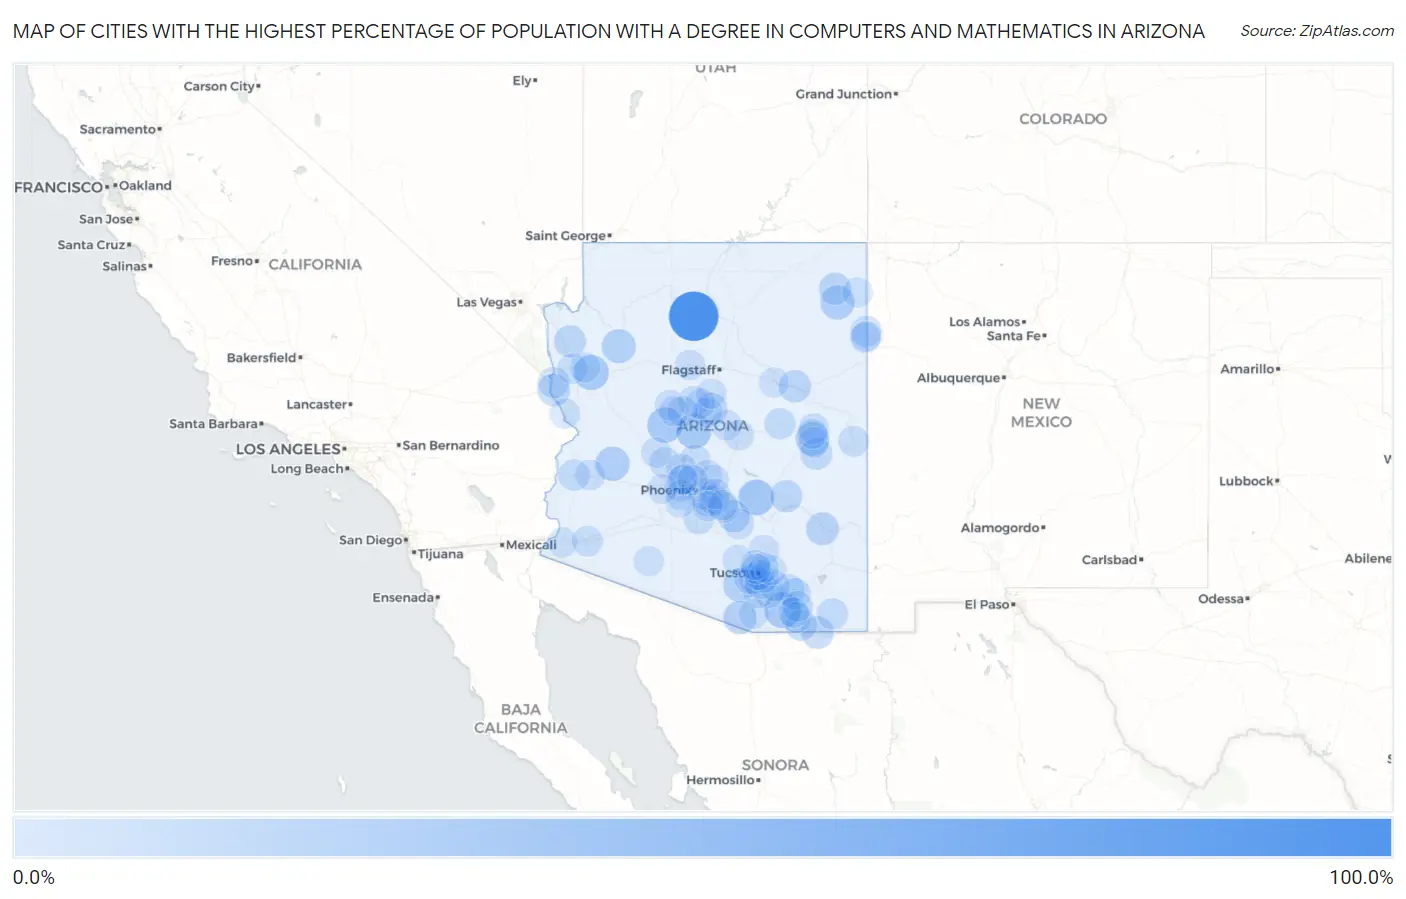
Map of Cities with the Highest Percentage of Population with a Degree in Computers and Mathematics in Arizona
0.0%
100.0%
Cities with the Highest Percentage of Population with a Degree in Computers and Mathematics in Arizona
| City | % Graduates | vs State | vs National | |
| 1. | Tusayan | 100.0% | 4.5%(+95.5)#1 | 4.9%(+95.1)#10 |
| 2. | Mormon Lake | 100.0% | 4.5%(+95.5)#2 | 4.9%(+95.1)#17 |
| 3. | Elgin | 31.6% | 4.5%(+27.1)#3 | 4.9%(+26.7)#273 |
| 4. | Top Of The World | 30.4% | 4.5%(+26.0)#4 | 4.9%(+25.5)#284 |
| 5. | Wilhoit | 28.4% | 4.5%(+24.0)#5 | 4.9%(+23.5)#319 |
| 6. | Pinion Pines | 27.0% | 4.5%(+22.5)#6 | 4.9%(+22.1)#356 |
| 7. | Cordes Lakes | 26.9% | 4.5%(+22.4)#7 | 4.9%(+22.0)#360 |
| 8. | Wenden | 23.2% | 4.5%(+18.7)#8 | 4.9%(+18.3)#472 |
| 9. | Chinle | 22.2% | 4.5%(+17.7)#9 | 4.9%(+17.3)#502 |
| 10. | Peach Springs | 21.7% | 4.5%(+17.3)#10 | 4.9%(+16.8)#526 |
| 11. | Three Points | 20.5% | 4.5%(+16.0)#11 | 4.9%(+15.6)#577 |
| 12. | Wagon Wheel | 20.2% | 4.5%(+15.7)#12 | 4.9%(+15.3)#591 |
| 13. | Arivaca | 19.0% | 4.5%(+14.5)#13 | 4.9%(+14.1)#672 |
| 14. | Pima | 16.6% | 4.5%(+12.1)#14 | 4.9%(+11.7)#876 |
| 15. | Naco | 15.2% | 4.5%(+10.7)#15 | 4.9%(+10.3)#1,019 |
| 16. | Mohave Valley | 14.4% | 4.5%(+9.96)#16 | 4.9%(+9.54)#1,095 |
| 17. | Many Farms | 13.8% | 4.5%(+9.29)#17 | 4.9%(+8.87)#1,195 |
| 18. | San Carlos | 13.6% | 4.5%(+9.11)#18 | 4.9%(+8.69)#1,225 |
| 19. | Joseph City | 13.1% | 4.5%(+8.60)#19 | 4.9%(+8.18)#1,322 |
| 20. | Florence | 12.9% | 4.5%(+8.38)#20 | 4.9%(+7.97)#1,362 |
| 21. | Dolan Springs | 12.7% | 4.5%(+8.21)#21 | 4.9%(+7.79)#1,394 |
| 22. | Lake Montezuma | 12.5% | 4.5%(+8.06)#22 | 4.9%(+7.64)#1,417 |
| 23. | North Fork | 11.6% | 4.5%(+7.14)#23 | 4.9%(+6.72)#1,623 |
| 24. | Mescal | 10.4% | 4.5%(+5.97)#24 | 4.9%(+5.55)#1,967 |
| 25. | Sierra Vista Southeast | 9.8% | 4.5%(+5.36)#25 | 4.9%(+4.94)#2,213 |
| 26. | Benson | 9.8% | 4.5%(+5.28)#26 | 4.9%(+4.86)#2,247 |
| 27. | Red Rock Cdp Pinal County | 9.5% | 4.5%(+5.06)#27 | 4.9%(+4.64)#2,348 |
| 28. | Sahuarita | 9.1% | 4.5%(+4.59)#28 | 4.9%(+4.17)#2,598 |
| 29. | Quartzsite | 9.1% | 4.5%(+4.58)#29 | 4.9%(+4.16)#2,603 |
| 30. | Timberline-Fernwood | 8.8% | 4.5%(+4.31)#30 | 4.9%(+3.89)#2,731 |
| 31. | Mcneal | 8.6% | 4.5%(+4.10)#31 | 4.9%(+3.68)#2,857 |
| 32. | Fort Mohave | 8.5% | 4.5%(+4.01)#32 | 4.9%(+3.59)#2,898 |
| 33. | Fort Defiance | 8.3% | 4.5%(+3.79)#33 | 4.9%(+3.37)#3,052 |
| 34. | Litchfield Park | 7.7% | 4.5%(+3.19)#34 | 4.9%(+2.78)#3,486 |
| 35. | Heber Overgaard | 7.5% | 4.5%(+3.07)#35 | 4.9%(+2.65)#3,564 |
| 36. | Valencia West | 7.4% | 4.5%(+2.89)#36 | 4.9%(+2.47)#3,703 |
| 37. | Morristown | 7.0% | 4.5%(+2.54)#37 | 4.9%(+2.12)#4,014 |
| 38. | Springerville | 7.0% | 4.5%(+2.52)#38 | 4.9%(+2.10)#4,031 |
| 39. | Maricopa | 6.9% | 4.5%(+2.47)#39 | 4.9%(+2.05)#4,092 |
| 40. | Jerome | 6.7% | 4.5%(+2.27)#40 | 4.9%(+1.85)#4,276 |
| 41. | Tempe | 6.7% | 4.5%(+2.19)#41 | 4.9%(+1.77)#4,384 |
| 42. | New River | 6.4% | 4.5%(+1.92)#42 | 4.9%(+1.50)#4,684 |
| 43. | Sierra Vista | 6.4% | 4.5%(+1.88)#43 | 4.9%(+1.46)#4,725 |
| 44. | Whetstone | 6.2% | 4.5%(+1.71)#44 | 4.9%(+1.29)#4,912 |
| 45. | White Mountain Lake | 6.1% | 4.5%(+1.66)#45 | 4.9%(+1.24)#4,979 |
| 46. | Drexel Heights | 6.1% | 4.5%(+1.60)#46 | 4.9%(+1.18)#5,046 |
| 47. | Chandler | 6.1% | 4.5%(+1.58)#47 | 4.9%(+1.16)#5,083 |
| 48. | Cactus Forest | 6.0% | 4.5%(+1.50)#48 | 4.9%(+1.08)#5,197 |
| 49. | Tacna | 6.0% | 4.5%(+1.50)#49 | 4.9%(+1.08)#5,199 |
| 50. | Saddlebrooke | 5.9% | 4.5%(+1.38)#50 | 4.9%(+0.959)#5,354 |
| 51. | Summit | 5.8% | 4.5%(+1.28)#51 | 4.9%(+0.861)#5,476 |
| 52. | Brenda | 5.7% | 4.5%(+1.19)#52 | 4.9%(+0.766)#5,582 |
| 53. | Gilbert | 5.6% | 4.5%(+1.14)#53 | 4.9%(+0.717)#5,662 |
| 54. | Corona De Tucson | 5.5% | 4.5%(+0.980)#54 | 4.9%(+0.561)#5,919 |
| 55. | Williams | 5.3% | 4.5%(+0.779)#55 | 4.9%(+0.360)#6,254 |
| 56. | St Michaels | 5.2% | 4.5%(+0.680)#56 | 4.9%(+0.261)#6,422 |
| 57. | Strawberry | 5.1% | 4.5%(+0.653)#57 | 4.9%(+0.234)#6,456 |
| 58. | Lake Of The Woods | 5.1% | 4.5%(+0.610)#58 | 4.9%(+0.191)#6,532 |
| 59. | Williamson | 4.9% | 4.5%(+0.475)#59 | 4.9%(+0.055)#6,758 |
| 60. | Camp Verde | 4.9% | 4.5%(+0.426)#60 | 4.9%(+0.007)#6,850 |
| 61. | Wickenburg | 4.9% | 4.5%(+0.399)#61 | 4.9%(-0.020)#6,927 |
| 62. | Prescott Valley | 4.9% | 4.5%(+0.398)#62 | 4.9%(-0.021)#6,929 |
| 63. | Peoria | 4.9% | 4.5%(+0.396)#63 | 4.9%(-0.023)#6,936 |
| 64. | Cottonwood | 4.8% | 4.5%(+0.341)#64 | 4.9%(-0.078)#7,032 |
| 65. | Vail | 4.8% | 4.5%(+0.322)#65 | 4.9%(-0.097)#7,071 |
| 66. | Fountain Hills | 4.8% | 4.5%(+0.310)#66 | 4.9%(-0.110)#7,092 |
| 67. | Golden Valley | 4.7% | 4.5%(+0.274)#67 | 4.9%(-0.145)#7,171 |
| 68. | San Tan Valley | 4.7% | 4.5%(+0.230)#68 | 4.9%(-0.189)#7,262 |
| 69. | Scottsdale | 4.7% | 4.5%(+0.189)#69 | 4.9%(-0.230)#7,348 |
| 70. | Avra Valley | 4.6% | 4.5%(+0.144)#70 | 4.9%(-0.275)#7,433 |
| 71. | Window Rock | 4.5% | 4.5%(+0.071)#71 | 4.9%(-0.349)#7,569 |
| 72. | Mesa | 4.5% | 4.5%(+0.065)#72 | 4.9%(-0.354)#7,607 |
| 73. | Payson | 4.5% | 4.5%(+0.063)#73 | 4.9%(-0.356)#7,610 |
| 74. | Phoenix | 4.5% | 4.5%(+0.056)#74 | 4.9%(-0.363)#7,625 |
| 75. | Tucson | 4.4% | 4.5%(-0.064)#75 | 4.9%(-0.483)#7,858 |
| 76. | Queen Creek | 4.3% | 4.5%(-0.155)#76 | 4.9%(-0.574)#8,057 |
| 77. | South Tucson | 4.3% | 4.5%(-0.158)#77 | 4.9%(-0.577)#8,068 |
| 78. | Avondale | 4.3% | 4.5%(-0.161)#78 | 4.9%(-0.580)#8,080 |
| 79. | Desert Hills | 4.2% | 4.5%(-0.268)#79 | 4.9%(-0.687)#8,303 |
| 80. | Fortuna Foothills | 4.2% | 4.5%(-0.273)#80 | 4.9%(-0.693)#8,318 |
| 81. | Goodyear | 4.1% | 4.5%(-0.328)#81 | 4.9%(-0.747)#8,440 |
| 82. | Tanque Verde | 4.1% | 4.5%(-0.336)#82 | 4.9%(-0.755)#8,461 |
| 83. | Casas Adobes | 4.1% | 4.5%(-0.375)#83 | 4.9%(-0.794)#8,531 |
| 84. | Prescott | 4.1% | 4.5%(-0.397)#84 | 4.9%(-0.816)#8,577 |
| 85. | Bellemont | 4.0% | 4.5%(-0.427)#85 | 4.9%(-0.846)#8,649 |
| 86. | Tsaile | 4.0% | 4.5%(-0.435)#86 | 4.9%(-0.854)#8,666 |
| 87. | Winslow | 4.0% | 4.5%(-0.475)#87 | 4.9%(-0.894)#8,733 |
| 88. | Glendale | 4.0% | 4.5%(-0.518)#88 | 4.9%(-0.937)#8,849 |
| 89. | Kingman | 3.9% | 4.5%(-0.538)#89 | 4.9%(-0.957)#8,899 |
| 90. | Tubac | 3.9% | 4.5%(-0.567)#90 | 4.9%(-0.986)#8,974 |
| 91. | Catalina Foothills | 3.8% | 4.5%(-0.629)#91 | 4.9%(-1.05)#9,137 |
| 92. | Sun City | 3.8% | 4.5%(-0.657)#92 | 4.9%(-1.08)#9,194 |
| 93. | Huachuca City | 3.8% | 4.5%(-0.671)#93 | 4.9%(-1.09)#9,226 |
| 94. | Sedona | 3.7% | 4.5%(-0.741)#94 | 4.9%(-1.16)#9,384 |
| 95. | Ajo | 3.5% | 4.5%(-0.925)#95 | 4.9%(-1.34)#9,820 |
| 96. | Buckeye | 3.5% | 4.5%(-0.941)#96 | 4.9%(-1.36)#9,858 |
| 97. | Tucson Mountains | 3.5% | 4.5%(-0.943)#97 | 4.9%(-1.36)#9,863 |
| 98. | Flowing Wells | 3.5% | 4.5%(-0.957)#98 | 4.9%(-1.38)#9,898 |
| 99. | Sun Lakes | 3.5% | 4.5%(-0.972)#99 | 4.9%(-1.39)#9,935 |
| 100. | Show Low | 3.5% | 4.5%(-0.979)#100 | 4.9%(-1.40)#9,949 |
Common Questions
What are the Top 10 Cities with the Highest Percentage of Population with a Degree in Computers and Mathematics in Arizona?
Top 10 Cities with the Highest Percentage of Population with a Degree in Computers and Mathematics in Arizona are:
#1
100.0%
#2
31.6%
#3
30.4%
#4
28.4%
#5
27.0%
#6
26.9%
#7
23.2%
#8
22.2%
#9
21.7%
#10
20.5%
What city has the Highest Percentage of Population with a Degree in Computers and Mathematics in Arizona?
Tusayan has the Highest Percentage of Population with a Degree in Computers and Mathematics in Arizona with 100.0%.
What is the Percentage of Population with a Degree in Computers and Mathematics in the State of Arizona?
Percentage of Population with a Degree in Computers and Mathematics in Arizona is 4.5%.
What is the Percentage of Population with a Degree in Computers and Mathematics in the United States?
Percentage of Population with a Degree in Computers and Mathematics in the United States is 4.9%.