Cities with the Highest Percentage of Population with a Degree in Computers and Mathematics in New York
RELATED REPORTS & OPTIONS
Computers and Mathematics
New York
Compare Cities
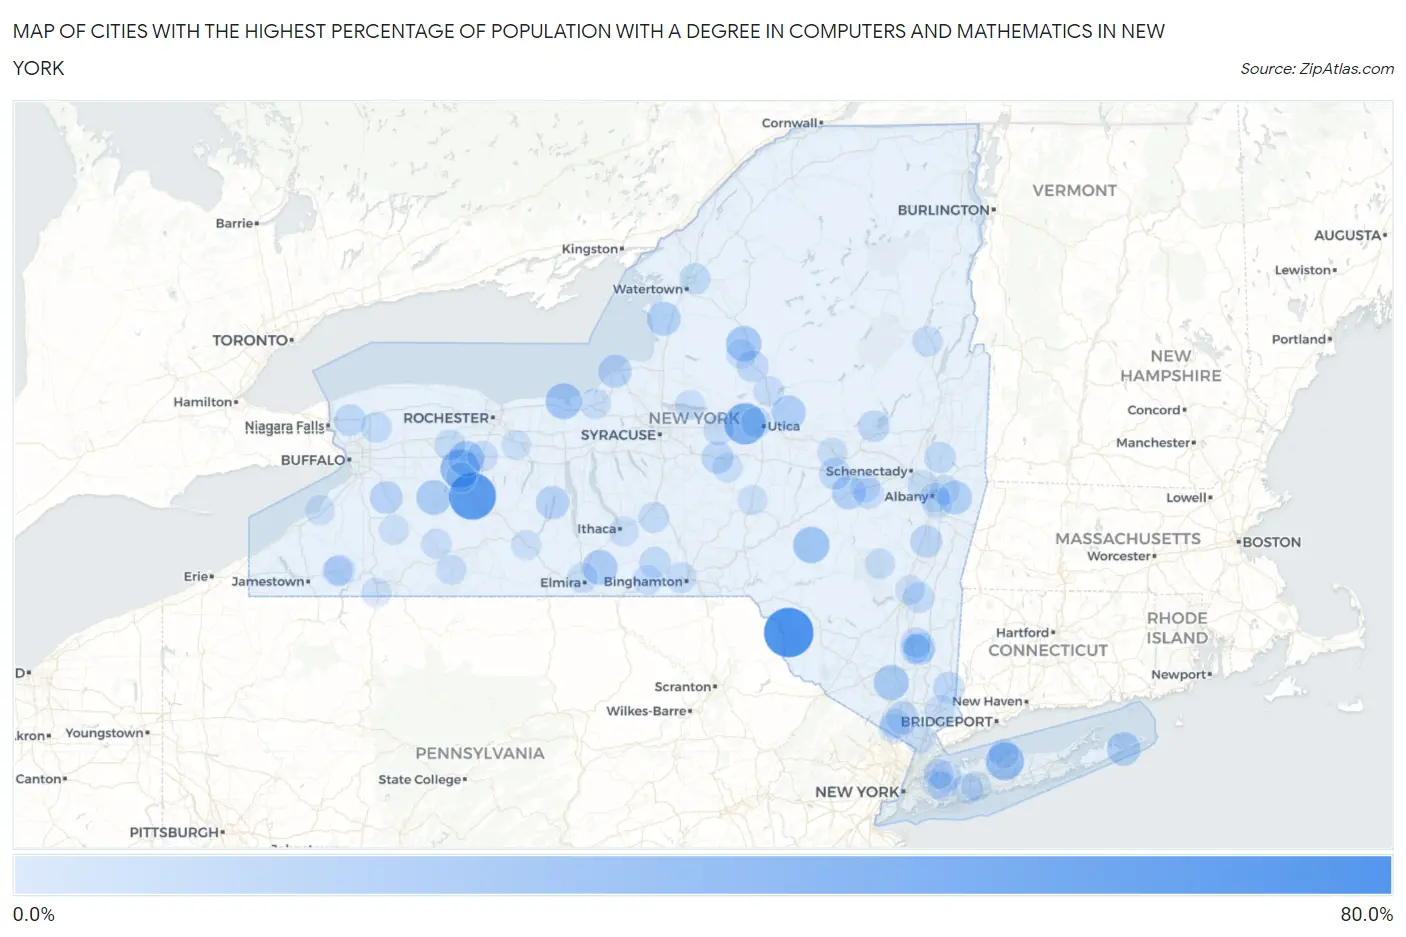
Map of Cities with the Highest Percentage of Population with a Degree in Computers and Mathematics in New York
0.0%
80.0%
Cities with the Highest Percentage of Population with a Degree in Computers and Mathematics in New York
| City | % Graduates | vs State | vs National | |
| 1. | Hortonville | 75.9% | 4.7%(+71.2)#1 | 4.9%(+71.0)#44 |
| 2. | Kysorville | 66.7% | 4.7%(+61.9)#2 | 4.9%(+61.8)#60 |
| 3. | North Bay | 50.0% | 4.7%(+45.3)#3 | 4.9%(+45.1)#107 |
| 4. | Westmoreland | 47.4% | 4.7%(+42.6)#4 | 4.9%(+42.5)#126 |
| 5. | Greigsville | 39.5% | 4.7%(+34.8)#5 | 4.9%(+34.6)#173 |
| 6. | Stony Brook University | 35.4% | 4.7%(+30.7)#6 | 4.9%(+30.5)#217 |
| 7. | Bloomville | 30.0% | 4.7%(+25.3)#7 | 4.9%(+25.1)#288 |
| 8. | Sodus Point | 29.2% | 4.7%(+24.5)#8 | 4.9%(+24.3)#301 |
| 9. | Fowlerville | 27.3% | 4.7%(+22.5)#9 | 4.9%(+22.4)#346 |
| 10. | Turin | 26.8% | 4.7%(+22.1)#10 | 4.9%(+21.9)#361 |
| 11. | Salisbury Mills | 25.8% | 4.7%(+21.0)#11 | 4.9%(+20.9)#391 |
| 12. | Erin | 25.0% | 4.7%(+20.3)#12 | 4.9%(+20.1)#405 |
| 13. | Hartwick Seminary | 25.0% | 4.7%(+20.3)#13 | 4.9%(+20.1)#413 |
| 14. | Gainesville | 25.0% | 4.7%(+20.3)#14 | 4.9%(+20.1)#415 |
| 15. | Newport | 22.0% | 4.7%(+17.3)#15 | 4.9%(+17.1)#519 |
| 16. | Cobleskill | 21.7% | 4.7%(+17.0)#16 | 4.9%(+16.8)#532 |
| 17. | Napeague | 21.7% | 4.7%(+16.9)#17 | 4.9%(+16.8)#534 |
| 18. | Averill Park | 21.6% | 4.7%(+16.9)#18 | 4.9%(+16.7)#535 |
| 19. | Belleville | 21.5% | 4.7%(+16.8)#19 | 4.9%(+16.6)#544 |
| 20. | Upper Red Hook | 21.4% | 4.7%(+16.7)#20 | 4.9%(+16.5)#547 |
| 21. | North Blenheim | 20.0% | 4.7%(+15.3)#21 | 4.9%(+15.1)#620 |
| 22. | Suny Oswego | 19.6% | 4.7%(+14.9)#22 | 4.9%(+14.7)#636 |
| 23. | Lake Huntington | 19.6% | 4.7%(+14.9)#23 | 4.9%(+14.7)#639 |
| 24. | Keuka Park | 19.5% | 4.7%(+14.7)#24 | 4.9%(+14.6)#647 |
| 25. | Newfield | 18.4% | 4.7%(+13.7)#25 | 4.9%(+13.6)#717 |
| 26. | Holland | 18.2% | 4.7%(+13.5)#26 | 4.9%(+13.3)#730 |
| 27. | Fairview Cdp Dutchess County | 17.0% | 4.7%(+12.3)#27 | 4.9%(+12.1)#832 |
| 28. | Morrisville | 16.3% | 4.7%(+11.5)#28 | 4.9%(+11.4)#904 |
| 29. | Coxsackie | 16.2% | 4.7%(+11.5)#29 | 4.9%(+11.3)#905 |
| 30. | Thiells | 16.1% | 4.7%(+11.4)#30 | 4.9%(+11.2)#921 |
| 31. | Boonville | 15.1% | 4.7%(+10.3)#31 | 4.9%(+10.2)#1,039 |
| 32. | Sharon Springs | 14.9% | 4.7%(+10.2)#32 | 4.9%(+10.0)#1,049 |
| 33. | Sanborn | 14.7% | 4.7%(+9.96)#33 | 4.9%(+9.78)#1,067 |
| 34. | Round Top | 14.7% | 4.7%(+9.96)#34 | 4.9%(+9.78)#1,068 |
| 35. | Brewster | 14.7% | 4.7%(+9.94)#35 | 4.9%(+9.77)#1,070 |
| 36. | Mayfield | 14.5% | 4.7%(+9.82)#36 | 4.9%(+9.65)#1,078 |
| 37. | Titusville | 14.0% | 4.7%(+9.27)#37 | 4.9%(+9.10)#1,165 |
| 38. | Newark Valley | 13.9% | 4.7%(+9.22)#38 | 4.9%(+9.05)#1,167 |
| 39. | Jacksonville | 13.8% | 4.7%(+9.07)#39 | 4.9%(+8.90)#1,189 |
| 40. | Rochester Institute Of Technology | 13.8% | 4.7%(+9.03)#40 | 4.9%(+8.86)#1,197 |
| 41. | Mechanicville | 13.7% | 4.7%(+8.97)#41 | 4.9%(+8.80)#1,205 |
| 42. | Red Oaks Mill | 13.4% | 4.7%(+8.67)#42 | 4.9%(+8.50)#1,255 |
| 43. | Calcium | 13.2% | 4.7%(+8.46)#43 | 4.9%(+8.29)#1,302 |
| 44. | Le Roy | 12.7% | 4.7%(+8.01)#44 | 4.9%(+7.84)#1,382 |
| 45. | Red Hook | 12.6% | 4.7%(+7.86)#45 | 4.9%(+7.69)#1,408 |
| 46. | Lake Delta | 12.5% | 4.7%(+7.80)#46 | 4.9%(+7.63)#1,418 |
| 47. | Virgil | 12.5% | 4.7%(+7.78)#47 | 4.9%(+7.61)#1,446 |
| 48. | Rapids | 12.4% | 4.7%(+7.63)#48 | 4.9%(+7.46)#1,467 |
| 49. | Whitesboro | 12.1% | 4.7%(+7.42)#49 | 4.9%(+7.25)#1,499 |
| 50. | Remsen | 12.0% | 4.7%(+7.28)#50 | 4.9%(+7.11)#1,527 |
| 51. | East Randolph | 11.8% | 4.7%(+7.10)#51 | 4.9%(+6.93)#1,562 |
| 52. | Red Creek | 11.6% | 4.7%(+6.90)#52 | 4.9%(+6.73)#1,618 |
| 53. | Farmingdale | 11.4% | 4.7%(+6.66)#53 | 4.9%(+6.49)#1,677 |
| 54. | Greenvale | 11.3% | 4.7%(+6.62)#54 | 4.9%(+6.44)#1,688 |
| 55. | Wassaic | 11.3% | 4.7%(+6.57)#55 | 4.9%(+6.40)#1,700 |
| 56. | Tioga Terrace | 11.2% | 4.7%(+6.43)#56 | 4.9%(+6.26)#1,721 |
| 57. | Johnson City | 11.2% | 4.7%(+6.43)#57 | 4.9%(+6.26)#1,723 |
| 58. | Arlington | 11.1% | 4.7%(+6.39)#58 | 4.9%(+6.22)#1,731 |
| 59. | Oneida Castle | 11.1% | 4.7%(+6.39)#59 | 4.9%(+6.22)#1,734 |
| 60. | Chestertown | 11.1% | 4.7%(+6.39)#60 | 4.9%(+6.22)#1,741 |
| 61. | East Avon | 11.0% | 4.7%(+6.27)#61 | 4.9%(+6.10)#1,788 |
| 62. | Elmira Heights | 10.9% | 4.7%(+6.14)#62 | 4.9%(+5.96)#1,835 |
| 63. | Viola | 10.8% | 4.7%(+6.12)#63 | 4.9%(+5.95)#1,839 |
| 64. | Katonah | 10.8% | 4.7%(+6.10)#64 | 4.9%(+5.93)#1,842 |
| 65. | Macdonnell Heights | 10.8% | 4.7%(+6.04)#65 | 4.9%(+5.87)#1,856 |
| 66. | Belfast | 10.7% | 4.7%(+5.99)#66 | 4.9%(+5.82)#1,870 |
| 67. | Colonie | 10.7% | 4.7%(+5.94)#67 | 4.9%(+5.77)#1,890 |
| 68. | Schoharie | 10.6% | 4.7%(+5.88)#68 | 4.9%(+5.71)#1,912 |
| 69. | Wesley Hills | 10.3% | 4.7%(+5.62)#69 | 4.9%(+5.45)#2,010 |
| 70. | Hurleyville | 10.3% | 4.7%(+5.60)#70 | 4.9%(+5.43)#2,015 |
| 71. | Randolph | 10.3% | 4.7%(+5.58)#71 | 4.9%(+5.41)#2,018 |
| 72. | Owego | 10.2% | 4.7%(+5.47)#72 | 4.9%(+5.30)#2,062 |
| 73. | Hunter | 10.0% | 4.7%(+5.28)#73 | 4.9%(+5.11)#2,145 |
| 74. | Hankins | 10.0% | 4.7%(+5.28)#74 | 4.9%(+5.11)#2,155 |
| 75. | East Greenbush | 9.9% | 4.7%(+5.20)#75 | 4.9%(+5.03)#2,185 |
| 76. | Leicester | 9.9% | 4.7%(+5.18)#76 | 4.9%(+5.01)#2,191 |
| 77. | Fort Plain | 9.8% | 4.7%(+5.10)#77 | 4.9%(+4.93)#2,217 |
| 78. | Lake Success | 9.8% | 4.7%(+5.09)#78 | 4.9%(+4.92)#2,223 |
| 79. | Scio | 9.8% | 4.7%(+5.08)#79 | 4.9%(+4.91)#2,230 |
| 80. | Glasco | 9.8% | 4.7%(+5.04)#80 | 4.9%(+4.87)#2,241 |
| 81. | Hamilton | 9.7% | 4.7%(+5.01)#81 | 4.9%(+4.84)#2,254 |
| 82. | Sunset Bay | 9.7% | 4.7%(+5.00)#82 | 4.9%(+4.83)#2,257 |
| 83. | Wynantskill | 9.7% | 4.7%(+4.96)#83 | 4.9%(+4.79)#2,266 |
| 84. | Spackenkill | 9.7% | 4.7%(+4.94)#84 | 4.9%(+4.77)#2,289 |
| 85. | Garden City Park | 9.7% | 4.7%(+4.93)#85 | 4.9%(+4.76)#2,294 |
| 86. | Bath | 9.6% | 4.7%(+4.84)#86 | 4.9%(+4.67)#2,331 |
| 87. | East Ithaca | 9.6% | 4.7%(+4.83)#87 | 4.9%(+4.66)#2,336 |
| 88. | Victor | 9.6% | 4.7%(+4.83)#88 | 4.9%(+4.66)#2,337 |
| 89. | Cleveland | 9.5% | 4.7%(+4.80)#89 | 4.9%(+4.63)#2,353 |
| 90. | Baxter Estates | 9.5% | 4.7%(+4.75)#90 | 4.9%(+4.58)#2,387 |
| 91. | Rensselaer | 9.5% | 4.7%(+4.73)#91 | 4.9%(+4.56)#2,394 |
| 92. | Limestone | 9.4% | 4.7%(+4.71)#92 | 4.9%(+4.54)#2,400 |
| 93. | New Berlin | 9.4% | 4.7%(+4.70)#93 | 4.9%(+4.53)#2,409 |
| 94. | Tarrytown | 9.4% | 4.7%(+4.67)#94 | 4.9%(+4.50)#2,423 |
| 95. | Constableville | 9.4% | 4.7%(+4.65)#95 | 4.9%(+4.48)#2,436 |
| 96. | Lime Lake | 9.3% | 4.7%(+4.56)#96 | 4.9%(+4.39)#2,474 |
| 97. | Mountain Dale | 9.3% | 4.7%(+4.56)#97 | 4.9%(+4.38)#2,479 |
| 98. | Central Bridge | 9.2% | 4.7%(+4.52)#98 | 4.9%(+4.35)#2,494 |
| 99. | Old Field | 9.2% | 4.7%(+4.51)#99 | 4.9%(+4.34)#2,498 |
| 100. | Wyandanch | 9.2% | 4.7%(+4.50)#100 | 4.9%(+4.33)#2,503 |
Common Questions
What are the Top 10 Cities with the Highest Percentage of Population with a Degree in Computers and Mathematics in New York?
Top 10 Cities with the Highest Percentage of Population with a Degree in Computers and Mathematics in New York are:
#1
75.9%
#2
66.7%
#3
47.4%
#4
39.5%
#5
35.4%
#6
30.0%
#7
29.2%
#8
27.3%
#9
26.8%
#10
25.8%
What city has the Highest Percentage of Population with a Degree in Computers and Mathematics in New York?
Hortonville has the Highest Percentage of Population with a Degree in Computers and Mathematics in New York with 75.9%.
What is the Percentage of Population with a Degree in Computers and Mathematics in the State of New York?
Percentage of Population with a Degree in Computers and Mathematics in New York is 4.7%.
What is the Percentage of Population with a Degree in Computers and Mathematics in the United States?
Percentage of Population with a Degree in Computers and Mathematics in the United States is 4.9%.