Cities with the Highest Percentage of Population with a Degree in Computers and Mathematics in Vermont
RELATED REPORTS & OPTIONS
Computers and Mathematics
Vermont
Compare Cities
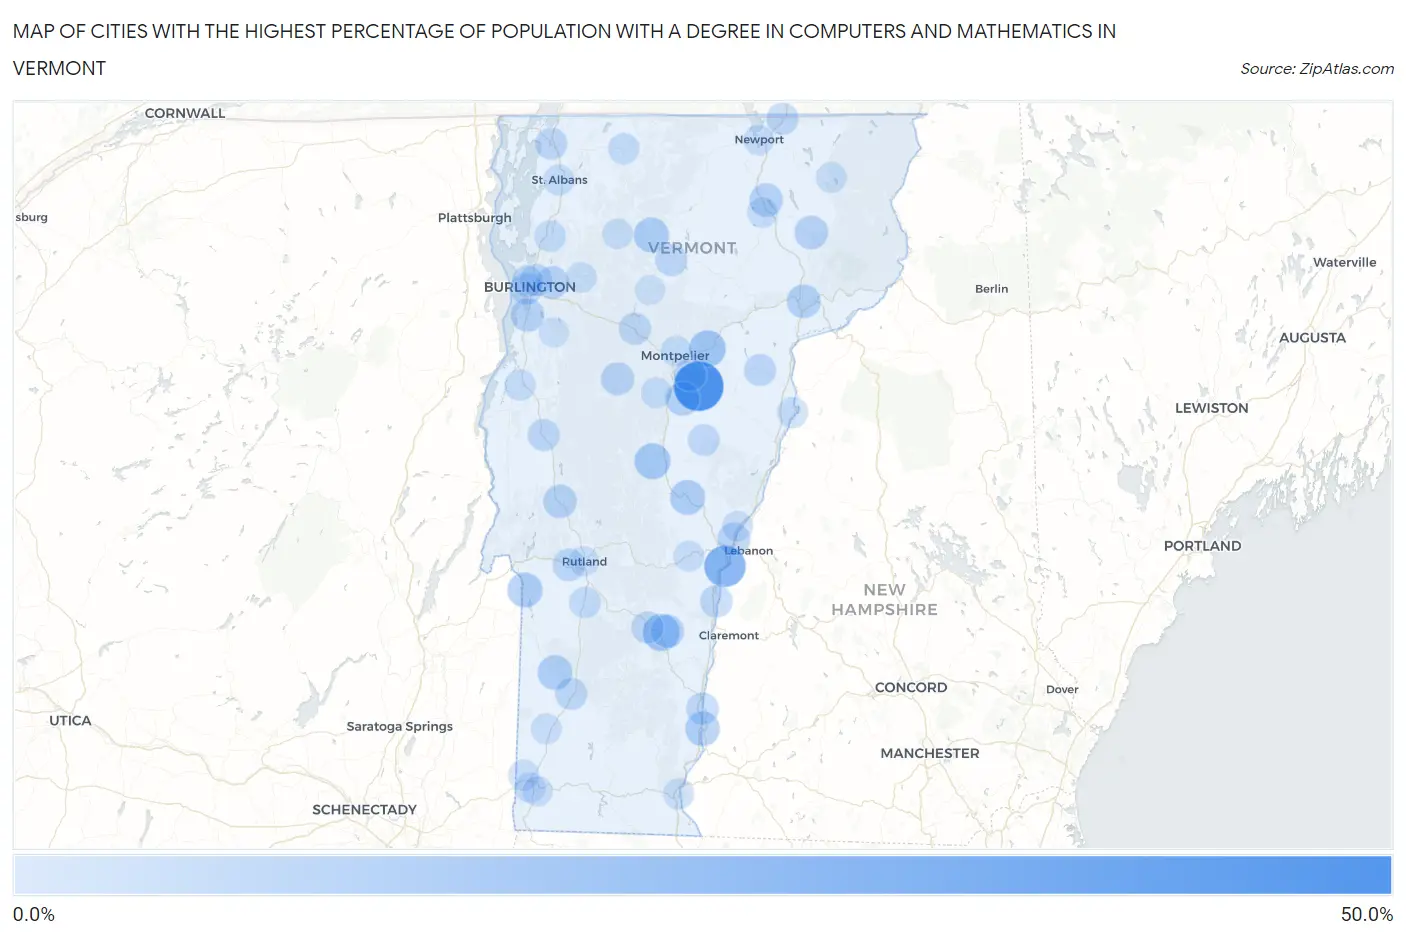
Map of Cities with the Highest Percentage of Population with a Degree in Computers and Mathematics in Vermont
0.0%
50.0%
Cities with the Highest Percentage of Population with a Degree in Computers and Mathematics in Vermont
| City | % Graduates | vs State | vs National | |
| 1. | Websterville | 40.3% | 3.5%(+36.8)#1 | 4.9%(+35.4)#160 |
| 2. | Underhill Flats | 38.4% | 3.5%(+34.9)#2 | 4.9%(+33.5)#182 |
| 3. | Highgate Center | 31.0% | 3.5%(+27.6)#3 | 4.9%(+26.1)#278 |
| 4. | Hartford | 25.7% | 3.5%(+22.2)#4 | 4.9%(+20.8)#392 |
| 5. | North Hartland | 23.0% | 3.5%(+19.5)#5 | 4.9%(+18.1)#485 |
| 6. | Peacham | 21.1% | 3.5%(+17.7)#6 | 4.9%(+16.2)#553 |
| 7. | Waterbury Center | 18.9% | 3.5%(+15.5)#7 | 4.9%(+14.1)#677 |
| 8. | Proctorsville | 13.7% | 3.5%(+10.3)#8 | 4.9%(+8.83)#1,202 |
| 9. | Plainfield | 13.2% | 3.5%(+9.73)#9 | 4.9%(+8.29)#1,300 |
| 10. | West Pawlet | 11.8% | 3.5%(+8.31)#10 | 4.9%(+6.87)#1,583 |
| 11. | Randolph | 11.7% | 3.5%(+8.19)#11 | 4.9%(+6.76)#1,614 |
| 12. | Lyndon Center | 11.1% | 3.5%(+7.65)#12 | 4.9%(+6.22)#1,749 |
| 13. | Johnson | 9.7% | 3.5%(+6.22)#13 | 4.9%(+4.78)#2,271 |
| 14. | Poultney | 9.7% | 3.5%(+6.20)#14 | 4.9%(+4.76)#2,290 |
| 15. | South Royalton | 9.6% | 3.5%(+6.10)#15 | 4.9%(+4.66)#2,335 |
| 16. | Dorset | 9.1% | 3.5%(+5.60)#16 | 4.9%(+4.17)#2,600 |
| 17. | Westminster | 8.9% | 3.5%(+5.43)#17 | 4.9%(+3.99)#2,689 |
| 18. | Williamstown | 7.9% | 3.5%(+4.40)#18 | 4.9%(+2.96)#3,321 |
| 19. | St Johnsbury | 7.2% | 3.5%(+3.76)#19 | 4.9%(+2.33)#3,813 |
| 20. | Shelburne | 6.9% | 3.5%(+3.42)#20 | 4.9%(+1.98)#4,151 |
| 21. | Middletown Springs | 6.8% | 3.5%(+3.36)#21 | 4.9%(+1.92)#4,203 |
| 22. | Brandon | 6.7% | 3.5%(+3.28)#22 | 4.9%(+1.85)#4,267 |
| 23. | Barton | 6.7% | 3.5%(+3.21)#23 | 4.9%(+1.77)#4,352 |
| 24. | Danby | 6.7% | 3.5%(+3.21)#24 | 4.9%(+1.77)#4,374 |
| 25. | West Burke | 6.7% | 3.5%(+3.21)#25 | 4.9%(+1.77)#4,375 |
| 26. | Cavendish | 6.2% | 3.5%(+2.79)#26 | 4.9%(+1.36)#4,857 |
| 27. | South Hero | 6.0% | 3.5%(+2.54)#27 | 4.9%(+1.11)#5,166 |
| 28. | Waitsfield | 6.0% | 3.5%(+2.53)#28 | 4.9%(+1.09)#5,178 |
| 29. | South Lincoln | 5.7% | 3.5%(+2.20)#29 | 4.9%(+0.766)#5,590 |
| 30. | St. George | 5.6% | 3.5%(+2.10)#30 | 4.9%(+0.662)#5,759 |
| 31. | Essex Junction | 5.5% | 3.5%(+2.02)#31 | 4.9%(+0.589)#5,878 |
| 32. | Wilder | 5.2% | 3.5%(+1.75)#32 | 4.9%(+0.313)#6,334 |
| 33. | West Rutland | 5.0% | 3.5%(+1.57)#33 | 4.9%(+0.133)#6,625 |
| 34. | Barre | 4.8% | 3.5%(+1.35)#34 | 4.9%(-0.085)#7,047 |
| 35. | Bellows Falls | 4.7% | 3.5%(+1.28)#35 | 4.9%(-0.155)#7,190 |
| 36. | Windsor | 4.7% | 3.5%(+1.25)#36 | 4.9%(-0.185)#7,251 |
| 37. | Waterbury | 4.5% | 3.5%(+1.03)#37 | 4.9%(-0.408)#7,703 |
| 38. | Ludlow | 4.4% | 3.5%(+0.946)#38 | 4.9%(-0.489)#7,872 |
| 39. | Killington | 4.4% | 3.5%(+0.920)#39 | 4.9%(-0.514)#7,924 |
| 40. | Swanton | 4.2% | 3.5%(+0.778)#40 | 4.9%(-0.657)#8,228 |
| 41. | South Burlington | 4.2% | 3.5%(+0.764)#41 | 4.9%(-0.670)#8,255 |
| 42. | Derby Line | 4.2% | 3.5%(+0.707)#42 | 4.9%(-0.727)#8,388 |
| 43. | Groton | 4.2% | 3.5%(+0.707)#43 | 4.9%(-0.727)#8,394 |
| 44. | Manchester Center | 4.1% | 3.5%(+0.681)#44 | 4.9%(-0.753)#8,458 |
| 45. | Morrisville | 4.1% | 3.5%(+0.596)#45 | 4.9%(-0.838)#8,629 |
| 46. | Middlebury | 4.0% | 3.5%(+0.541)#46 | 4.9%(-0.894)#8,734 |
| 47. | Winooski | 4.0% | 3.5%(+0.492)#47 | 4.9%(-0.943)#8,857 |
| 48. | Bolton Valley | 3.7% | 3.5%(+0.291)#48 | 4.9%(-1.14)#9,354 |
| 49. | Pawlet | 3.5% | 3.5%(+0.070)#49 | 4.9%(-1.36)#9,874 |
| 50. | Burlington | 3.5% | 3.5%(+0.055)#50 | 4.9%(-1.38)#9,905 |
| 51. | Chelsea | 3.4% | 3.5%(-0.011)#51 | 4.9%(-1.45)#10,060 |
| 52. | Milton | 3.1% | 3.5%(-0.392)#52 | 4.9%(-1.83)#11,019 |
| 53. | Wallingford | 3.0% | 3.5%(-0.455)#53 | 4.9%(-1.89)#11,163 |
| 54. | Enosburg Falls | 2.7% | 3.5%(-0.793)#54 | 4.9%(-2.23)#11,996 |
| 55. | Huntington | 2.5% | 3.5%(-0.984)#55 | 4.9%(-2.42)#12,448 |
| 56. | Vergennes | 2.4% | 3.5%(-1.06)#56 | 4.9%(-2.50)#12,652 |
| 57. | Proctor | 2.2% | 3.5%(-1.27)#57 | 4.9%(-2.70)#13,117 |
| 58. | St Albans | 2.1% | 3.5%(-1.36)#58 | 4.9%(-2.79)#13,341 |
| 59. | Stamford | 2.1% | 3.5%(-1.36)#59 | 4.9%(-2.80)#13,353 |
| 60. | Newbury | 2.1% | 3.5%(-1.40)#60 | 4.9%(-2.84)#13,465 |
| 61. | Northfield | 1.9% | 3.5%(-1.55)#61 | 4.9%(-2.98)#13,785 |
| 62. | Montpelier | 1.9% | 3.5%(-1.56)#62 | 4.9%(-2.99)#13,806 |
| 63. | Brattleboro | 1.8% | 3.5%(-1.64)#63 | 4.9%(-3.08)#13,987 |
| 64. | North Bennington | 1.7% | 3.5%(-1.76)#64 | 4.9%(-3.19)#14,250 |
| 65. | Island Pond | 1.7% | 3.5%(-1.77)#65 | 4.9%(-3.21)#14,302 |
| 66. | Woodstock | 1.7% | 3.5%(-1.78)#66 | 4.9%(-3.22)#14,321 |
| 67. | Jeffersonville | 1.5% | 3.5%(-2.00)#67 | 4.9%(-3.44)#14,753 |
| 68. | Glover | 1.4% | 3.5%(-2.01)#68 | 4.9%(-3.44)#14,765 |
| 69. | Norwich | 1.4% | 3.5%(-2.05)#69 | 4.9%(-3.49)#14,838 |
| 70. | Jericho | 1.4% | 3.5%(-2.05)#70 | 4.9%(-3.49)#14,846 |
| 71. | Newport | 1.3% | 3.5%(-2.12)#71 | 4.9%(-3.55)#14,987 |
| 72. | Arlington | 1.3% | 3.5%(-2.19)#72 | 4.9%(-3.62)#15,121 |
| 73. | Lincoln | 1.1% | 3.5%(-2.31)#73 | 4.9%(-3.74)#15,310 |
| 74. | Old Bennington | 0.97% | 3.5%(-2.49)#74 | 4.9%(-3.92)#15,594 |
| 75. | Bennington | 0.69% | 3.5%(-2.77)#75 | 4.9%(-4.20)#15,930 |
| 76. | Rutland | 0.52% | 3.5%(-2.94)#76 | 4.9%(-4.37)#16,054 |
| 77. | Hinesburg | 0.43% | 3.5%(-3.03)#77 | 4.9%(-4.47)#16,118 |
| 78. | Stowe | 0.18% | 3.5%(-3.28)#78 | 4.9%(-4.71)#16,186 |
1
2Common Questions
What are the Top 10 Cities with the Highest Percentage of Population with a Degree in Computers and Mathematics in Vermont?
Top 10 Cities with the Highest Percentage of Population with a Degree in Computers and Mathematics in Vermont are:
#1
40.3%
#2
23.0%
#3
13.7%
#4
13.2%
#5
11.7%
#6
9.7%
#7
9.7%
#8
9.6%
#9
9.1%
#10
8.9%
What city has the Highest Percentage of Population with a Degree in Computers and Mathematics in Vermont?
Websterville has the Highest Percentage of Population with a Degree in Computers and Mathematics in Vermont with 40.3%.
What is the Percentage of Population with a Degree in Computers and Mathematics in the State of Vermont?
Percentage of Population with a Degree in Computers and Mathematics in Vermont is 3.5%.
What is the Percentage of Population with a Degree in Computers and Mathematics in the United States?
Percentage of Population with a Degree in Computers and Mathematics in the United States is 4.9%.