Zip Codes with the Highest Percentage of Population with a Degree in Computers and Mathematics in California
RELATED REPORTS & OPTIONS
Computers and Mathematics
California
Compare Zip Codes
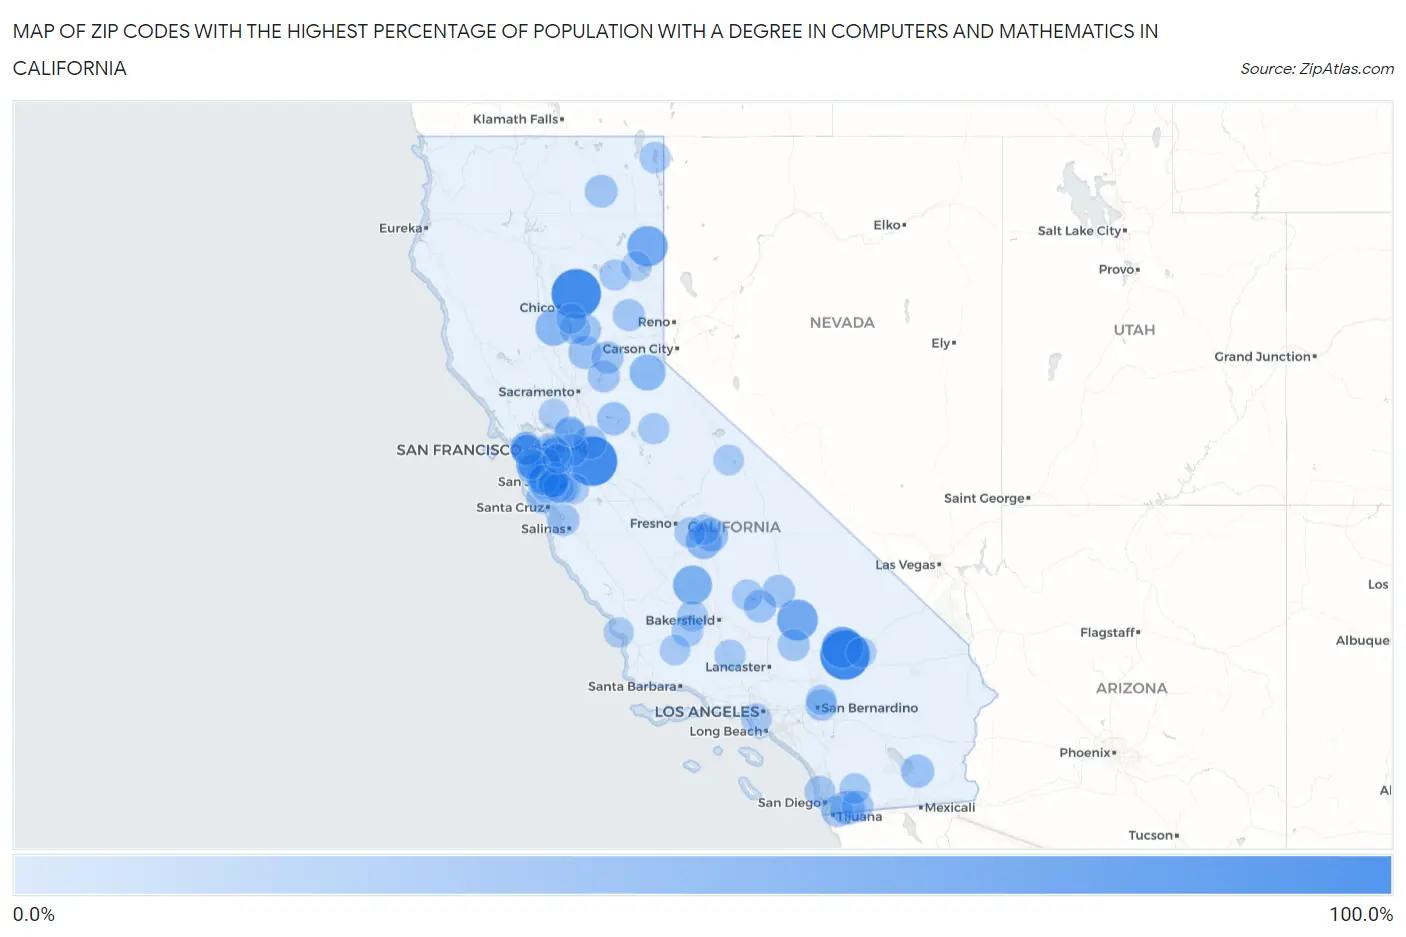
Map of Zip Codes with the Highest Percentage of Population with a Degree in Computers and Mathematics in California
0.0%
100.0%
Zip Codes with the Highest Percentage of Population with a Degree in Computers and Mathematics in California
| Zip Code | % Graduates | vs State | vs National | |
| 1. | 92327 | 100.0% | 5.8%(+94.2)#1 | 4.9%(+95.1)#4 |
| 2. | 95385 | 100.0% | 5.8%(+94.2)#2 | 4.9%(+95.1)#6 |
| 3. | 95978 | 100.0% | 5.8%(+94.2)#3 | 4.9%(+95.1)#15 |
| 4. | 92398 | 60.9% | 5.8%(+55.1)#4 | 4.9%(+56.0)#47 |
| 5. | 93528 | 58.8% | 5.8%(+53.0)#5 | 4.9%(+53.9)#51 |
| 6. | 96117 | 57.6% | 5.8%(+51.8)#6 | 4.9%(+52.7)#53 |
| 7. | 93201 | 50.0% | 5.8%(+44.2)#7 | 4.9%(+45.1)#78 |
| 8. | 95920 | 39.3% | 5.8%(+33.5)#8 | 4.9%(+34.4)#141 |
| 9. | 95720 | 36.8% | 5.8%(+31.0)#9 | 4.9%(+31.9)#154 |
| 10. | 93615 | 35.9% | 5.8%(+30.1)#10 | 4.9%(+31.0)#161 |
| 11. | 91917 | 30.1% | 5.8%(+24.3)#11 | 4.9%(+25.2)#223 |
| 12. | 93647 | 27.5% | 5.8%(+21.7)#12 | 4.9%(+22.6)#256 |
| 13. | 95225 | 25.0% | 5.8%(+19.2)#13 | 4.9%(+20.1)#296 |
| 14. | 94548 | 24.3% | 5.8%(+18.5)#14 | 4.9%(+19.4)#317 |
| 15. | 95231 | 24.2% | 5.8%(+18.4)#15 | 4.9%(+19.3)#321 |
| 16. | 92233 | 24.0% | 5.8%(+18.2)#16 | 4.9%(+19.1)#326 |
| 17. | 94085 | 24.0% | 5.8%(+18.2)#17 | 4.9%(+19.1)#332 |
| 18. | 95903 | 23.7% | 5.8%(+17.9)#18 | 4.9%(+18.8)#342 |
| 19. | 93527 | 22.3% | 5.8%(+16.5)#19 | 4.9%(+17.4)#382 |
| 20. | 96054 | 22.2% | 5.8%(+16.4)#20 | 4.9%(+17.3)#385 |
| 21. | 94538 | 22.2% | 5.8%(+16.3)#21 | 4.9%(+17.3)#388 |
| 22. | 95054 | 21.9% | 5.8%(+16.1)#22 | 4.9%(+17.0)#394 |
| 23. | 95134 | 21.1% | 5.8%(+15.2)#23 | 4.9%(+16.2)#426 |
| 24. | 93283 | 20.8% | 5.8%(+15.0)#24 | 4.9%(+15.9)#439 |
| 25. | 94555 | 20.2% | 5.8%(+14.4)#25 | 4.9%(+15.4)#453 |
| 26. | 95007 | 20.2% | 5.8%(+14.3)#26 | 4.9%(+15.3)#458 |
| 27. | 95736 | 20.0% | 5.8%(+14.2)#27 | 4.9%(+15.1)#471 |
| 28. | 95664 | 19.9% | 5.8%(+14.1)#28 | 4.9%(+15.0)#474 |
| 29. | 94086 | 19.5% | 5.8%(+13.7)#29 | 4.9%(+14.6)#486 |
| 30. | 94539 | 18.9% | 5.8%(+13.1)#30 | 4.9%(+14.0)#508 |
| 31. | 95914 | 18.8% | 5.8%(+13.0)#31 | 4.9%(+13.9)#519 |
| 32. | 96125 | 18.8% | 5.8%(+12.9)#32 | 4.9%(+13.9)#523 |
| 33. | 93516 | 18.6% | 5.8%(+12.8)#33 | 4.9%(+13.7)#525 |
| 34. | 94104 | 18.6% | 5.8%(+12.8)#34 | 4.9%(+13.7)#527 |
| 35. | 94041 | 17.8% | 5.8%(+12.0)#35 | 4.9%(+12.9)#572 |
| 36. | 94089 | 17.7% | 5.8%(+11.9)#36 | 4.9%(+12.8)#576 |
| 37. | 92369 | 17.5% | 5.8%(+11.7)#37 | 4.9%(+12.6)#588 |
| 38. | 95391 | 17.4% | 5.8%(+11.6)#38 | 4.9%(+12.5)#592 |
| 39. | 94043 | 17.3% | 5.8%(+11.5)#39 | 4.9%(+12.4)#605 |
| 40. | 94105 | 17.3% | 5.8%(+11.5)#40 | 4.9%(+12.4)#607 |
| 41. | 92179 | 17.2% | 5.8%(+11.4)#41 | 4.9%(+12.3)#611 |
| 42. | 95012 | 17.2% | 5.8%(+11.4)#42 | 4.9%(+12.3)#617 |
| 43. | 93224 | 16.7% | 5.8%(+10.9)#43 | 4.9%(+11.8)#647 |
| 44. | 96115 | 16.4% | 5.8%(+10.6)#44 | 4.9%(+11.5)#668 |
| 45. | 95014 | 16.3% | 5.8%(+10.5)#45 | 4.9%(+11.4)#671 |
| 46. | 95968 | 16.2% | 5.8%(+10.4)#46 | 4.9%(+11.3)#680 |
| 47. | 91963 | 16.2% | 5.8%(+10.4)#47 | 4.9%(+11.3)#681 |
| 48. | 95051 | 16.1% | 5.8%(+10.3)#48 | 4.9%(+11.2)#697 |
| 49. | 94040 | 16.0% | 5.8%(+10.2)#49 | 4.9%(+11.2)#698 |
| 50. | 94087 | 15.9% | 5.8%(+10.1)#50 | 4.9%(+11.0)#707 |
| 51. | 94303 | 15.9% | 5.8%(+10.1)#51 | 4.9%(+11.0)#709 |
| 52. | 94536 | 15.7% | 5.8%(+9.91)#52 | 4.9%(+10.8)#728 |
| 53. | 95050 | 15.4% | 5.8%(+9.61)#53 | 4.9%(+10.5)#751 |
| 54. | 94582 | 15.0% | 5.8%(+9.20)#54 | 4.9%(+10.1)#788 |
| 55. | 94107 | 14.9% | 5.8%(+9.13)#55 | 4.9%(+10.1)#792 |
| 56. | 95346 | 14.9% | 5.8%(+9.11)#56 | 4.9%(+10.0)#797 |
| 57. | 93206 | 14.9% | 5.8%(+9.05)#57 | 4.9%(+9.97)#802 |
| 58. | 95947 | 14.7% | 5.8%(+8.87)#58 | 4.9%(+9.79)#821 |
| 59. | 92093 | 14.6% | 5.8%(+8.76)#59 | 4.9%(+9.68)#836 |
| 60. | 94568 | 14.4% | 5.8%(+8.61)#60 | 4.9%(+9.53)#851 |
| 61. | 93646 | 14.4% | 5.8%(+8.59)#61 | 4.9%(+9.51)#853 |
| 62. | 93285 | 14.3% | 5.8%(+8.47)#62 | 4.9%(+9.39)#864 |
| 63. | 95035 | 14.2% | 5.8%(+8.39)#63 | 4.9%(+9.31)#890 |
| 64. | 95129 | 13.9% | 5.8%(+8.06)#64 | 4.9%(+8.98)#924 |
| 65. | 95119 | 13.9% | 5.8%(+8.06)#65 | 4.9%(+8.98)#925 |
| 66. | 93243 | 13.6% | 5.8%(+7.81)#66 | 4.9%(+8.73)#956 |
| 67. | 94560 | 13.6% | 5.8%(+7.79)#67 | 4.9%(+8.71)#961 |
| 68. | 91916 | 13.6% | 5.8%(+7.78)#68 | 4.9%(+8.70)#963 |
| 69. | 94583 | 13.5% | 5.8%(+7.69)#69 | 4.9%(+8.60)#981 |
| 70. | 95053 | 13.5% | 5.8%(+7.67)#70 | 4.9%(+8.59)#984 |
| 71. | 94588 | 13.3% | 5.8%(+7.52)#71 | 4.9%(+8.44)#1,001 |
| 72. | 95070 | 13.2% | 5.8%(+7.40)#72 | 4.9%(+8.32)#1,020 |
| 73. | 95138 | 13.1% | 5.8%(+7.33)#73 | 4.9%(+8.25)#1,033 |
| 74. | 94587 | 13.0% | 5.8%(+7.23)#74 | 4.9%(+8.15)#1,047 |
| 75. | 93648 | 12.7% | 5.8%(+6.87)#75 | 4.9%(+7.79)#1,097 |
| 76. | 93546 | 12.7% | 5.8%(+6.86)#76 | 4.9%(+7.78)#1,098 |
| 77. | 94065 | 12.6% | 5.8%(+6.81)#77 | 4.9%(+7.73)#1,107 |
| 78. | 94306 | 12.5% | 5.8%(+6.72)#78 | 4.9%(+7.64)#1,121 |
| 79. | 94404 | 12.2% | 5.8%(+6.35)#79 | 4.9%(+7.27)#1,187 |
| 80. | 90304 | 12.2% | 5.8%(+6.34)#80 | 4.9%(+7.26)#1,189 |
| 81. | 93254 | 12.1% | 5.8%(+6.29)#81 | 4.9%(+7.21)#1,199 |
| 82. | 94002 | 11.9% | 5.8%(+6.07)#82 | 4.9%(+6.99)#1,237 |
| 83. | 94102 | 11.8% | 5.8%(+6.03)#83 | 4.9%(+6.95)#1,245 |
| 84. | 95117 | 11.8% | 5.8%(+5.96)#84 | 4.9%(+6.88)#1,260 |
| 85. | 95135 | 11.7% | 5.8%(+5.87)#85 | 4.9%(+6.79)#1,283 |
| 86. | 95965 | 11.6% | 5.8%(+5.78)#86 | 4.9%(+6.70)#1,313 |
| 87. | 94022 | 11.5% | 5.8%(+5.66)#87 | 4.9%(+6.58)#1,334 |
| 88. | 95131 | 11.3% | 5.8%(+5.50)#88 | 4.9%(+6.42)#1,372 |
| 89. | 95008 | 11.3% | 5.8%(+5.49)#89 | 4.9%(+6.41)#1,376 |
| 90. | 94024 | 11.3% | 5.8%(+5.49)#90 | 4.9%(+6.41)#1,379 |
| 91. | 94401 | 11.3% | 5.8%(+5.48)#91 | 4.9%(+6.40)#1,382 |
| 92. | 96114 | 11.2% | 5.8%(+5.40)#92 | 4.9%(+6.32)#1,399 |
| 93. | 95123 | 11.1% | 5.8%(+5.33)#93 | 4.9%(+6.25)#1,410 |
| 94. | 93424 | 11.1% | 5.8%(+5.26)#94 | 4.9%(+6.18)#1,438 |
| 95. | 94535 | 11.0% | 5.8%(+5.23)#95 | 4.9%(+6.15)#1,443 |
| 96. | 95128 | 11.0% | 5.8%(+5.20)#96 | 4.9%(+6.12)#1,450 |
| 97. | 94566 | 11.0% | 5.8%(+5.19)#97 | 4.9%(+6.11)#1,454 |
| 98. | 92365 | 11.0% | 5.8%(+5.16)#98 | 4.9%(+6.08)#1,462 |
| 99. | 94511 | 11.0% | 5.8%(+5.14)#99 | 4.9%(+6.06)#1,467 |
| 100. | 92385 | 10.9% | 5.8%(+5.10)#100 | 4.9%(+6.02)#1,479 |
Common Questions
What are the Top 10 Zip Codes with the Highest Percentage of Population with a Degree in Computers and Mathematics in California?
Top 10 Zip Codes with the Highest Percentage of Population with a Degree in Computers and Mathematics in California are:
What zip code has the Highest Percentage of Population with a Degree in Computers and Mathematics in California?
92327 has the Highest Percentage of Population with a Degree in Computers and Mathematics in California with 100.0%.
What is the Percentage of Population with a Degree in Computers and Mathematics in the State of California?
Percentage of Population with a Degree in Computers and Mathematics in California is 5.8%.
What is the Percentage of Population with a Degree in Computers and Mathematics in the United States?
Percentage of Population with a Degree in Computers and Mathematics in the United States is 4.9%.