Cities with the Highest Percentage of Population with a Degree in Computers and Mathematics in Indiana
RELATED REPORTS & OPTIONS
Computers and Mathematics
Indiana
Compare Cities
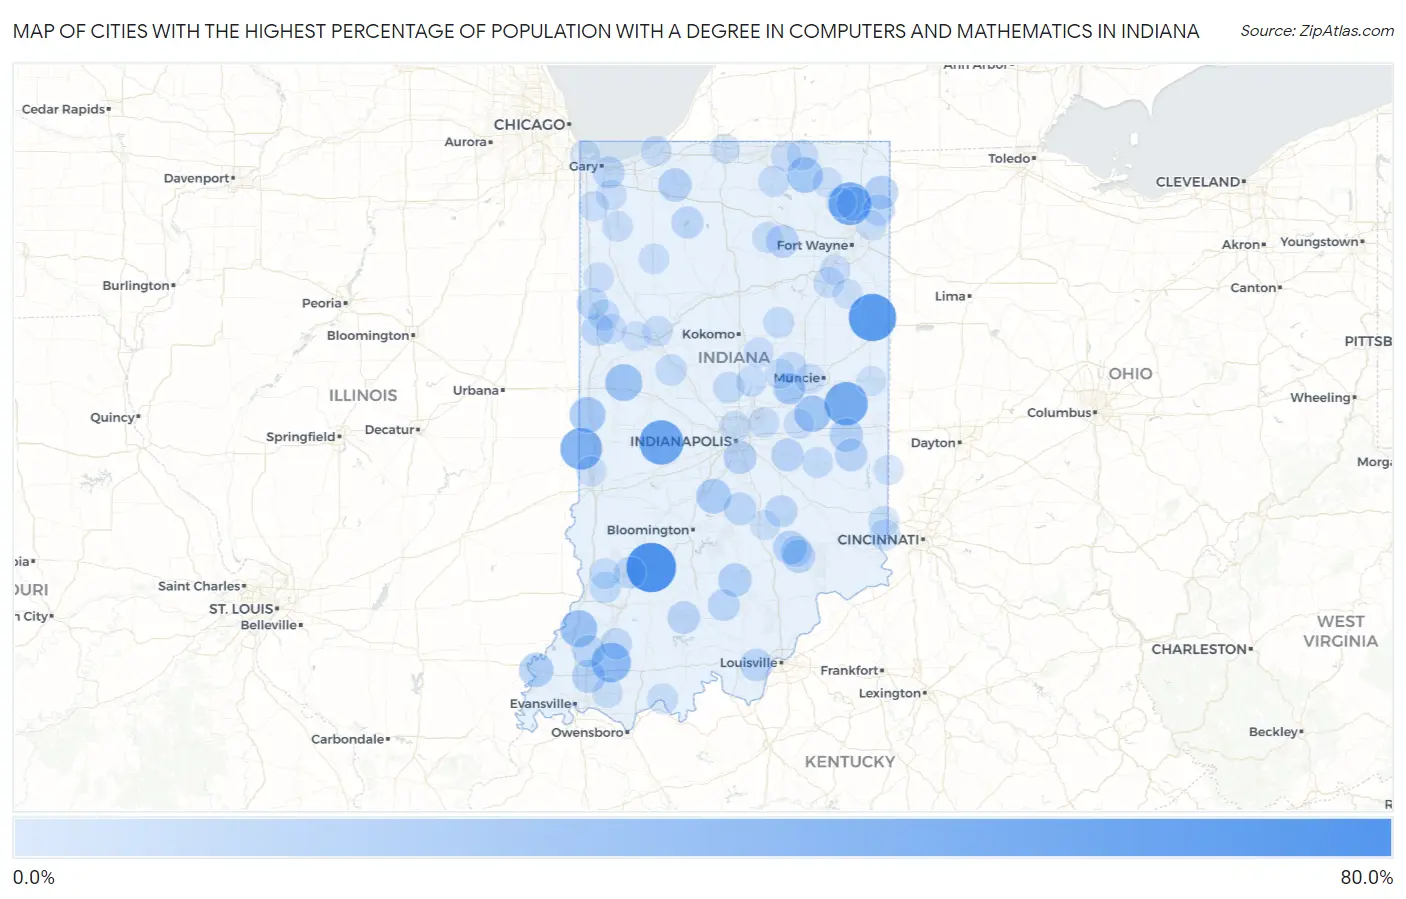
Map of Cities with the Highest Percentage of Population with a Degree in Computers and Mathematics in Indiana
0.0%
80.0%
Cities with the Highest Percentage of Population with a Degree in Computers and Mathematics in Indiana
| City | % Graduates | vs State | vs National | |
| 1. | Scotland | 62.5% | 4.2%(+58.3)#1 | 4.9%(+57.6)#64 |
| 2. | Geneva | 56.0% | 4.2%(+51.8)#2 | 4.9%(+51.1)#82 |
| 3. | Ireland | 50.0% | 4.2%(+45.8)#3 | 4.9%(+45.1)#112 |
| 4. | Bainbridge | 47.4% | 4.2%(+43.1)#4 | 4.9%(+42.5)#125 |
| 5. | Losantville | 44.0% | 4.2%(+39.8)#5 | 4.9%(+39.1)#142 |
| 6. | Altona | 42.9% | 4.2%(+38.6)#6 | 4.9%(+38.0)#146 |
| 7. | Center | 41.2% | 4.2%(+36.9)#7 | 4.9%(+36.3)#154 |
| 8. | St Bernice | 40.0% | 4.2%(+35.8)#8 | 4.9%(+35.1)#163 |
| 9. | Spurgeon | 33.3% | 4.2%(+29.1)#9 | 4.9%(+28.4)#241 |
| 10. | Arcola | 32.0% | 4.2%(+27.8)#10 | 4.9%(+27.1)#264 |
| 11. | Reddington | 28.6% | 4.2%(+24.3)#11 | 4.9%(+23.7)#310 |
| 12. | Oakville | 28.1% | 4.2%(+23.8)#12 | 4.9%(+23.2)#326 |
| 13. | Hoffman Lake | 27.4% | 4.2%(+23.2)#13 | 4.9%(+22.5)#345 |
| 14. | Hazleton | 26.3% | 4.2%(+22.1)#14 | 4.9%(+21.4)#376 |
| 15. | Mellott | 26.3% | 4.2%(+22.1)#15 | 4.9%(+21.4)#377 |
| 16. | Cadiz | 25.0% | 4.2%(+20.8)#16 | 4.9%(+20.1)#418 |
| 17. | Cayuga | 23.3% | 4.2%(+19.1)#17 | 4.9%(+18.4)#467 |
| 18. | Topeka | 23.3% | 4.2%(+19.0)#18 | 4.9%(+18.4)#468 |
| 19. | Schaefer Lake | 22.4% | 4.2%(+18.1)#19 | 4.9%(+17.5)#499 |
| 20. | Charlottesville | 21.1% | 4.2%(+16.8)#20 | 4.9%(+16.2)#555 |
| 21. | Painted Hills | 20.4% | 4.2%(+16.2)#21 | 4.9%(+15.5)#585 |
| 22. | Garrett | 19.2% | 4.2%(+14.9)#22 | 4.9%(+14.3)#664 |
| 23. | Griffin | 19.0% | 4.2%(+14.8)#23 | 4.9%(+14.2)#671 |
| 24. | Prairieton | 18.6% | 4.2%(+14.4)#24 | 4.9%(+13.7)#701 |
| 25. | Medora | 17.1% | 4.2%(+12.8)#25 | 4.9%(+12.2)#827 |
| 26. | Country Squire Lakes | 17.0% | 4.2%(+12.8)#26 | 4.9%(+12.2)#831 |
| 27. | Arthur | 17.0% | 4.2%(+12.7)#27 | 4.9%(+12.1)#835 |
| 28. | Butler | 16.8% | 4.2%(+12.5)#28 | 4.9%(+11.9)#849 |
| 29. | Kingsford Heights | 16.7% | 4.2%(+12.4)#29 | 4.9%(+11.8)#852 |
| 30. | Mount Auburn | 16.7% | 4.2%(+12.4)#30 | 4.9%(+11.8)#873 |
| 31. | Elberfeld | 16.2% | 4.2%(+11.9)#31 | 4.9%(+11.3)#907 |
| 32. | Vernon | 15.8% | 4.2%(+11.5)#32 | 4.9%(+10.9)#954 |
| 33. | Southport | 15.6% | 4.2%(+11.3)#33 | 4.9%(+10.7)#976 |
| 34. | Connersville | 14.7% | 4.2%(+10.4)#34 | 4.9%(+9.77)#1,069 |
| 35. | Morristown | 14.6% | 4.2%(+10.3)#35 | 4.9%(+9.69)#1,076 |
| 36. | West Baden Springs | 14.3% | 4.2%(+10.0)#36 | 4.9%(+9.39)#1,116 |
| 37. | Sidney | 14.3% | 4.2%(+10.0)#37 | 4.9%(+9.39)#1,136 |
| 38. | Lanesville | 13.9% | 4.2%(+9.69)#38 | 4.9%(+9.05)#1,168 |
| 39. | Cordry Sweetwater Lakes | 13.8% | 4.2%(+9.55)#39 | 4.9%(+8.90)#1,187 |
| 40. | Francisco | 13.8% | 4.2%(+9.50)#40 | 4.9%(+8.86)#1,198 |
| 41. | Antioch | 13.6% | 4.2%(+9.31)#41 | 4.9%(+8.67)#1,230 |
| 42. | Nineveh | 13.2% | 4.2%(+8.96)#42 | 4.9%(+8.31)#1,295 |
| 43. | Hope | 13.1% | 4.2%(+8.88)#43 | 4.9%(+8.23)#1,311 |
| 44. | Bass Lake | 13.1% | 4.2%(+8.87)#44 | 4.9%(+8.22)#1,312 |
| 45. | Boswell | 13.0% | 4.2%(+8.80)#45 | 4.9%(+8.15)#1,329 |
| 46. | Bennetts Switch | 12.8% | 4.2%(+8.53)#46 | 4.9%(+7.89)#1,376 |
| 47. | New Chicago | 12.7% | 4.2%(+8.43)#47 | 4.9%(+7.78)#1,396 |
| 48. | Campbellsburg | 12.5% | 4.2%(+8.25)#48 | 4.9%(+7.61)#1,427 |
| 49. | Elnora | 12.5% | 4.2%(+8.25)#49 | 4.9%(+7.61)#1,431 |
| 50. | St Joe | 11.8% | 4.2%(+7.52)#50 | 4.9%(+6.87)#1,575 |
| 51. | Earl Park | 11.8% | 4.2%(+7.52)#51 | 4.9%(+6.87)#1,580 |
| 52. | Woodlawn Heights | 11.6% | 4.2%(+7.38)#52 | 4.9%(+6.73)#1,620 |
| 53. | Winslow | 11.5% | 4.2%(+7.29)#53 | 4.9%(+6.64)#1,636 |
| 54. | North Vernon | 11.1% | 4.2%(+6.89)#54 | 4.9%(+6.24)#1,725 |
| 55. | Sheridan | 11.1% | 4.2%(+6.86)#55 | 4.9%(+6.22)#1,729 |
| 56. | Bicknell | 10.9% | 4.2%(+6.61)#56 | 4.9%(+5.97)#1,834 |
| 57. | Alexandria | 10.8% | 4.2%(+6.52)#57 | 4.9%(+5.87)#1,855 |
| 58. | Clarks Hill | 10.7% | 4.2%(+6.47)#58 | 4.9%(+5.82)#1,869 |
| 59. | Fowler | 10.6% | 4.2%(+6.33)#59 | 4.9%(+5.69)#1,919 |
| 60. | New Paris | 10.2% | 4.2%(+5.98)#60 | 4.9%(+5.33)#2,046 |
| 61. | Rushville | 10.0% | 4.2%(+5.71)#61 | 4.9%(+5.06)#2,174 |
| 62. | Freelandville | 9.8% | 4.2%(+5.54)#62 | 4.9%(+4.89)#2,236 |
| 63. | Greendale | 9.7% | 4.2%(+5.45)#63 | 4.9%(+4.80)#2,263 |
| 64. | Sweetser | 9.7% | 4.2%(+5.44)#64 | 4.9%(+4.80)#2,264 |
| 65. | Shipshewana | 9.7% | 4.2%(+5.43)#65 | 4.9%(+4.78)#2,273 |
| 66. | Claypool | 9.7% | 4.2%(+5.43)#66 | 4.9%(+4.78)#2,282 |
| 67. | Country Club Heights | 9.6% | 4.2%(+5.37)#67 | 4.9%(+4.72)#2,311 |
| 68. | Lakewood | 9.5% | 4.2%(+5.29)#68 | 4.9%(+4.64)#2,345 |
| 69. | North Crows Nest | 9.4% | 4.2%(+5.19)#69 | 4.9%(+4.54)#2,402 |
| 70. | Bright | 9.4% | 4.2%(+5.18)#70 | 4.9%(+4.53)#2,407 |
| 71. | De Motte | 9.4% | 4.2%(+5.13)#71 | 4.9%(+4.48)#2,430 |
| 72. | Troy | 9.4% | 4.2%(+5.13)#72 | 4.9%(+4.48)#2,433 |
| 73. | Mccordsville | 9.4% | 4.2%(+5.11)#73 | 4.9%(+4.46)#2,451 |
| 74. | Arcadia | 9.1% | 4.2%(+4.89)#74 | 4.9%(+4.25)#2,545 |
| 75. | Markle | 9.1% | 4.2%(+4.84)#75 | 4.9%(+4.20)#2,567 |
| 76. | Battle Ground | 8.9% | 4.2%(+4.64)#76 | 4.9%(+4.00)#2,687 |
| 77. | Boonville | 8.9% | 4.2%(+4.63)#77 | 4.9%(+3.98)#2,695 |
| 78. | Trail Creek | 8.8% | 4.2%(+4.56)#78 | 4.9%(+3.91)#2,723 |
| 79. | Francesville | 8.8% | 4.2%(+4.55)#79 | 4.9%(+3.91)#2,725 |
| 80. | Avilla | 8.6% | 4.2%(+4.40)#80 | 4.9%(+3.75)#2,816 |
| 81. | Zanesville | 8.6% | 4.2%(+4.39)#81 | 4.9%(+3.75)#2,820 |
| 82. | Middlebury | 8.6% | 4.2%(+4.32)#82 | 4.9%(+3.67)#2,862 |
| 83. | Winfield | 8.5% | 4.2%(+4.30)#83 | 4.9%(+3.65)#2,875 |
| 84. | Whiting | 8.5% | 4.2%(+4.27)#84 | 4.9%(+3.63)#2,882 |
| 85. | Lake Dalecarlia | 8.5% | 4.2%(+4.26)#85 | 4.9%(+3.62)#2,886 |
| 86. | Brook | 8.3% | 4.2%(+4.09)#86 | 4.9%(+3.44)#2,976 |
| 87. | Windfall City | 8.3% | 4.2%(+4.09)#87 | 4.9%(+3.44)#2,981 |
| 88. | Wilkinson | 8.3% | 4.2%(+4.09)#88 | 4.9%(+3.44)#2,993 |
| 89. | Yorktown | 8.3% | 4.2%(+4.03)#89 | 4.9%(+3.39)#3,042 |
| 90. | Oxford | 8.2% | 4.2%(+3.99)#90 | 4.9%(+3.34)#3,063 |
| 91. | Tecumseh | 8.0% | 4.2%(+3.74)#91 | 4.9%(+3.09)#3,227 |
| 92. | West College Corner | 8.0% | 4.2%(+3.72)#92 | 4.9%(+3.07)#3,243 |
| 93. | Grabill | 8.0% | 4.2%(+3.71)#93 | 4.9%(+3.06)#3,251 |
| 94. | Frankton | 7.8% | 4.2%(+3.60)#94 | 4.9%(+2.95)#3,331 |
| 95. | Montmorenci | 7.8% | 4.2%(+3.58)#95 | 4.9%(+2.94)#3,352 |
| 96. | Roseland | 7.6% | 4.2%(+3.38)#96 | 4.9%(+2.73)#3,520 |
| 97. | Winchester | 7.5% | 4.2%(+3.25)#97 | 4.9%(+2.60)#3,600 |
| 98. | Rome City | 7.4% | 4.2%(+3.20)#98 | 4.9%(+2.55)#3,629 |
| 99. | Columbus | 7.4% | 4.2%(+3.17)#99 | 4.9%(+2.53)#3,647 |
| 100. | Bluffton | 7.4% | 4.2%(+3.14)#100 | 4.9%(+2.49)#3,682 |
Common Questions
What are the Top 10 Cities with the Highest Percentage of Population with a Degree in Computers and Mathematics in Indiana?
Top 10 Cities with the Highest Percentage of Population with a Degree in Computers and Mathematics in Indiana are:
#1
62.5%
#2
56.0%
#3
47.4%
#4
44.0%
#5
42.9%
#6
40.0%
#7
33.3%
#8
26.3%
#9
26.3%
#10
25.0%
What city has the Highest Percentage of Population with a Degree in Computers and Mathematics in Indiana?
Scotland has the Highest Percentage of Population with a Degree in Computers and Mathematics in Indiana with 62.5%.
What is the Percentage of Population with a Degree in Computers and Mathematics in the State of Indiana?
Percentage of Population with a Degree in Computers and Mathematics in Indiana is 4.2%.
What is the Percentage of Population with a Degree in Computers and Mathematics in the United States?
Percentage of Population with a Degree in Computers and Mathematics in the United States is 4.9%.