Cities with the Highest Percentage of Population with a Degree in Computers and Mathematics in Delaware

RELATED REPORTS & OPTIONS

Computers and Mathematics
Population
Families and Households
Female Fertility
Female Fertility (Unmarried)
Race (Community Size)
Race (Percentage)
Ancestry (Community Size)
AfghanAfricanAlaska NativeAlaskan AthabascanAlbanianAleutAlsatianAmericanApacheArabArapahoArgentineanArmenianAssyrian / Chaldean / SyriacAustralianAustrianBahamianBangladeshiBarbadianBasqueBelgianBelizeanBermudanBhutaneseBlackfeetBolivianBrazilianBritishBritish West IndianBulgarianBurmeseCajunCambodianCanadianCape VerdeanCarpatho RusynCelticCentral AmericanCentral American IndianCherokeeCheyenneChickasawChileanChineseChippewaChoctawColombianColvilleComancheCosta RicanCreeCreekCroatianCrowCubanCypriotCzechCzechoslovakianDanishDelawareDominicanDutchDutch West IndianEastern EuropeanEcuadorianEgyptianEnglishEstonianEthiopianEuropeanFijianFilipinoFinnishFrenchFrench American IndianFrench CanadianGermanGerman RussianGhanaianGreekGuamanian / ChamorroGuatemalanGuyaneseHaitianHmongHonduranHopiHoumaHungarianIcelanderIndian (Asian)IndonesianInupiatIranianIraqiIrishIroquoisIsraeliItalianJamaicanJapaneseJordanianKenyanKiowaKoreanLaotianLatvianLebaneseLiberianLithuanianLumbeeLuxembourgerMacedonianMalaysianMalteseMarshalleseMenomineeMexicanMexican American IndianMongolianMoroccanNative HawaiianNavajoNepaleseNew ZealanderNicaraguanNigerianNorthern EuropeanNorwegianOkinawanOsageOttawaPaiutePakistaniPalestinianPanamanianParaguayanPennsylvania GermanPeruvianPimaPolishPortuguesePotawatomiPuebloPuerto RicanPuget Sound SalishRomanianRussianSalvadoranSamoanScandinavianScotch-IrishScottishSeminoleSenegaleseSerbianShoshoneSierra LeoneanSiouxSlavicSlovakSloveneSomaliSouth AfricanSouth AmericanSouth American IndianSoviet UnionSpaniardSpanishSpanish AmericanSpanish American IndianSri LankanSubsaharan AfricanSudaneseSwedishSwissSyrianTaiwaneseThaiTlingit-HaidaTohono O'OdhamTonganTrinidadian and TobagonianTsimshianTurkishU.S. Virgin IslanderUgandanUkrainianUruguayanUteVenezuelanVietnameseWelshWest IndianYakamaYaquiYugoslavianYumanYup'ikZimbabwean
Ancestry (Percentage)
AfghanAfricanAlaska NativeAlaskan AthabascanAlbanianAleutAlsatianAmericanApacheArabArapahoArgentineanArmenianAssyrian / Chaldean / SyriacAustralianAustrianBahamianBangladeshiBarbadianBasqueBelgianBelizeanBermudanBhutaneseBlackfeetBolivianBrazilianBritishBritish West IndianBulgarianBurmeseCajunCambodianCanadianCape VerdeanCarpatho RusynCelticCentral AmericanCentral American IndianCherokeeCheyenneChickasawChileanChineseChippewaChoctawColombianColvilleComancheCosta RicanCreeCreekCroatianCrowCubanCypriotCzechCzechoslovakianDanishDelawareDominicanDutchDutch West IndianEastern EuropeanEcuadorianEgyptianEnglishEstonianEthiopianEuropeanFijianFilipinoFinnishFrenchFrench American IndianFrench CanadianGermanGerman RussianGhanaianGreekGuamanian / ChamorroGuatemalanGuyaneseHaitianHmongHonduranHopiHoumaHungarianIcelanderIndian (Asian)IndonesianInupiatIranianIraqiIrishIroquoisIsraeliItalianJamaicanJapaneseJordanianKenyanKiowaKoreanLaotianLatvianLebaneseLiberianLithuanianLumbeeLuxembourgerMacedonianMalaysianMalteseMarshalleseMenomineeMexicanMexican American IndianMongolianMoroccanNative HawaiianNavajoNepaleseNew ZealanderNicaraguanNigerianNorthern EuropeanNorwegianOkinawanOsageOttawaPaiutePakistaniPalestinianPanamanianParaguayanPennsylvania GermanPeruvianPimaPolishPortuguesePotawatomiPuebloPuerto RicanPuget Sound SalishRomanianRussianSalvadoranSamoanScandinavianScotch-IrishScottishSeminoleSenegaleseSerbianShoshoneSierra LeoneanSiouxSlavicSlovakSloveneSomaliSouth AfricanSouth AmericanSouth American IndianSoviet UnionSpaniardSpanishSpanish AmericanSpanish American IndianSri LankanSubsaharan AfricanSudaneseSwedishSwissSyrianTaiwaneseThaiTlingit-HaidaTohono O'OdhamTonganTrinidadian and TobagonianTsimshianTurkishU.S. Virgin IslanderUgandanUkrainianUruguayanUteVenezuelanVietnameseWelshWest IndianYakamaYaquiYugoslavianYumanYup'ikZimbabwean
Immigrant Origin (Total)
AfghanistanAfricaAlbaniaArgentinaArmeniaAsiaAustraliaAustriaAzoresBahamasBangladeshBarbadosBelarusBelgiumBelizeBoliviaBosnia and HerzegovinaBrazilBulgariaBurma / MyanmarCabo VerdeCambodiaCameroonCanadaCaribbeanCentral AmericaChileChinaColombiaCongoCosta RicaCroatiaCubaCzechoslovakiaDenmarkDominicaDominican RepublicEastern AfricaEastern AsiaEastern EuropeEcuadorEgyptEl SalvadorEnglandEritreaEthiopiaEuropeFijiFranceGermanyGhanaGreeceGrenadaGuatemalaGuyanaHaitiHondurasHong KongHungaryIndiaIndonesiaIranIraqIrelandIsraelItalyJamaicaJapanJordanKazakhstanKenyaKoreaKuwaitLaosLatin AmericaLatviaLebanonLiberiaLithuaniaMalaysiaMexicoMicronesiaMiddle AfricaMoldovaMoroccoNepalNetherlandsNicaraguaNigeriaNorth MacedoniaNorthern AfricaNorthern EuropeNorwayOceaniaPakistanPanamaPeruPhilippinesPolandPortugalRomaniaRussiaSaudi ArabiaScotlandSenegalSerbiaSierra LeoneSingaporeSomaliaSouth AfricaSouth AmericaSouth Central AsiaSouth Eastern AsiaSouthern EuropeSpainSri LankaSt. Vincent and the GrenadinesSudanSwedenSwitzerlandSyriaTaiwanThailandTrinidad and TobagoTurkeyUgandaUkraineUruguayUzbekistanVenezuelaVietnamWest IndiesWestern AfricaWestern AsiaWestern EuropeYemenZaireZimbabwe
Immigrant Origin (Percentage)
AfghanistanAfricaAlbaniaArgentinaArmeniaAsiaAustraliaAustriaAzoresBahamasBangladeshBarbadosBelarusBelgiumBelizeBoliviaBosnia and HerzegovinaBrazilBulgariaBurma / MyanmarCabo VerdeCambodiaCameroonCanadaCaribbeanCentral AmericaChileChinaColombiaCongoCosta RicaCroatiaCubaCzechoslovakiaDenmarkDominicaDominican RepublicEastern AfricaEastern AsiaEastern EuropeEcuadorEgyptEl SalvadorEnglandEritreaEthiopiaEuropeFijiFranceGermanyGhanaGreeceGrenadaGuatemalaGuyanaHaitiHondurasHong KongHungaryIndiaIndonesiaIranIraqIrelandIsraelItalyJamaicaJapanJordanKazakhstanKenyaKoreaKuwaitLaosLatin AmericaLatviaLebanonLiberiaLithuaniaMalaysiaMexicoMicronesiaMiddle AfricaMoldovaMoroccoNepalNetherlandsNicaraguaNigeriaNorth MacedoniaNorthern AfricaNorthern EuropeNorwayOceaniaPakistanPanamaPeruPhilippinesPolandPortugalRomaniaRussiaSaudi ArabiaScotlandSenegalSerbiaSierra LeoneSingaporeSomaliaSouth AfricaSouth AmericaSouth Central AsiaSouth Eastern AsiaSouthern EuropeSpainSri LankaSt. Vincent and the GrenadinesSudanSwedenSwitzerlandSyriaTaiwanThailandTrinidad and TobagoTurkeyUgandaUkraineUruguayUzbekistanVenezuelaVietnamWest IndiesWestern AfricaWestern AsiaWestern EuropeYemenZaireZimbabwe
Income
Income (Families)
Income (Households)
Poverty
Poverty (Families)
Unemployment
Employment Occupations
Employment Industries
Employer Class
Commute Time
Commute Means
School Enrollment
Education by Degree Field
Occupancy
Finances
Physical Characteristics
Delaware
Compare Cities
Comparison Subject

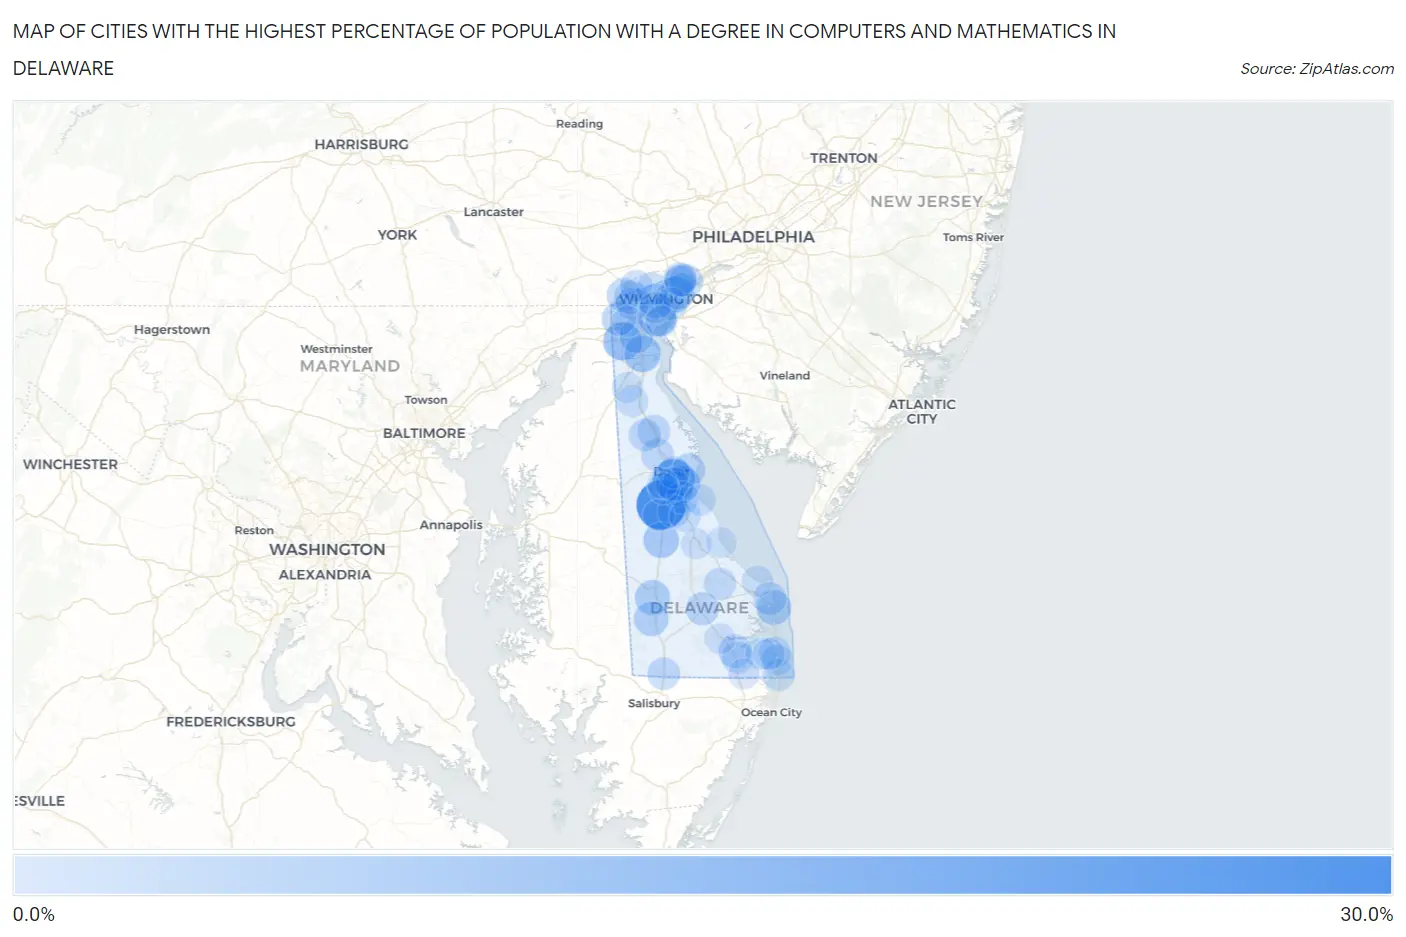
Map of Cities with the Highest Percentage of Population with a Degree in Computers and Mathematics in Delaware

0.0%
30.0%
Cities with the Highest Percentage of Population with a Degree in Computers and Mathematics in Delaware Map

Cities with the Highest Percentage of Population with a Degree in Computers and Mathematics in Delaware

City % Graduates vs State vs National
1.Viola29.4%4.3%(+25.1)#14.9%(+24.5)#300
2.Kent Acres17.9%4.3%(+13.6)#24.9%(+13.0)#757
3.Glasgow12.4%4.3%(+8.09)#34.9%(+7.47)#1,466
4.Wilmington Manor11.8%4.3%(+7.57)#44.9%(+6.95)#1,559
5.Dover Base Housing10.6%4.3%(+6.30)#54.9%(+5.68)#1,921
6.St Georges9.7%4.3%(+5.46)#64.9%(+4.84)#2,251
7.Harrington8.3%4.3%(+4.07)#74.9%(+3.45)#2,964
8.Edgemoor7.6%4.3%(+3.31)#84.9%(+2.69)#3,547
9.Bridgeville7.3%4.3%(+3.06)#94.9%(+2.44)#3,723
10.Dewey Beach7.3%4.3%(+2.99)#104.9%(+2.37)#3,775
11.Seaford6.8%4.3%(+2.54)#114.9%(+1.93)#4,191
12.Rising Sun Lebanon6.8%4.3%(+2.48)#124.9%(+1.86)#4,260
13.Elsmere6.7%4.3%(+2.44)#134.9%(+1.82)#4,300
14.Bellefonte5.8%4.3%(+1.50)#144.9%(+0.880)#5,449
15.Bear5.5%4.3%(+1.24)#154.9%(+0.620)#5,831
16.Newark5.5%4.3%(+1.23)#164.9%(+0.616)#5,837
17.Pike Creek5.5%4.3%(+1.19)#174.9%(+0.573)#5,907
18.North Star5.3%4.3%(+1.05)#184.9%(+0.432)#6,115
19.Claymont5.0%4.3%(+0.746)#194.9%(+0.129)#6,627
20.Dagsboro4.7%4.3%(+0.396)#204.9%(-0.221)#7,329
21.Pike Creek Valley4.6%4.3%(+0.354)#214.9%(-0.263)#7,414
22.Little Creek4.5%4.3%(+0.269)#224.9%(-0.349)#7,594
23.Georgetown4.5%4.3%(+0.225)#234.9%(-0.392)#7,679
24.Highland Acres4.5%4.3%(+0.184)#244.9%(-0.433)#7,748
25.Rehoboth Beach4.3%4.3%(+0.058)#254.9%(-0.560)#8,026
26.Cheswold4.3%4.3%(+0.001)#264.9%(-0.616)#8,151
27.Arden4.0%4.3%(-0.297)#274.9%(-0.914)#8,803
28.Smyrna3.9%4.3%(-0.354)#284.9%(-0.971)#8,935
29.Clayton3.7%4.3%(-0.531)#294.9%(-1.15)#9,363
30.Delmar3.7%4.3%(-0.584)#304.9%(-1.20)#9,485
31.Greenville3.6%4.3%(-0.693)#314.9%(-1.31)#9,736
32.Magnolia3.4%4.3%(-0.829)#324.9%(-1.45)#10,068
33.Hockessin3.4%4.3%(-0.896)#334.9%(-1.51)#10,238
34.Riverview3.4%4.3%(-0.906)#344.9%(-1.52)#10,255
35.Ardentown3.3%4.3%(-0.966)#354.9%(-1.58)#10,429
36.Milton3.2%4.3%(-1.11)#364.9%(-1.72)#10,788
37.Frankford3.1%4.3%(-1.15)#374.9%(-1.77)#10,885
38.Wilmington3.1%4.3%(-1.22)#384.9%(-1.84)#11,042
39.Dover3.0%4.3%(-1.27)#394.9%(-1.88)#11,154
40.Fenwick Island2.8%4.3%(-1.47)#404.9%(-2.09)#11,680
41.Ardencroft2.8%4.3%(-1.52)#414.9%(-2.14)#11,804
42.Bethany Beach2.7%4.3%(-1.62)#424.9%(-2.24)#12,016
43.Felton2.6%4.3%(-1.67)#434.9%(-2.29)#12,122
44.South Bethany2.6%4.3%(-1.69)#444.9%(-2.30)#12,161
45.Millville2.6%4.3%(-1.69)#454.9%(-2.31)#12,165
46.Newport2.4%4.3%(-1.84)#464.9%(-2.45)#12,530
47.Frederica2.2%4.3%(-2.03)#474.9%(-2.65)#12,977
48.Ocean View2.2%4.3%(-2.04)#484.9%(-2.66)#13,001
49.Townsend2.2%4.3%(-2.05)#494.9%(-2.66)#13,007
50.Bowers2.2%4.3%(-2.13)#504.9%(-2.74)#13,218
51.New Castle2.1%4.3%(-2.21)#514.9%(-2.82)#13,426
52.Lewes2.0%4.3%(-2.28)#524.9%(-2.89)#13,554
53.Middletown1.8%4.3%(-2.44)#534.9%(-3.05)#13,930
54.Camden1.7%4.3%(-2.57)#544.9%(-3.19)#14,232
55.Millsboro1.4%4.3%(-2.92)#554.9%(-3.53)#14,942
56.Brookside1.3%4.3%(-2.95)#564.9%(-3.57)#15,009
57.Milford1.2%4.3%(-3.09)#574.9%(-3.70)#15,235
58.Selbyville1.2%4.3%(-3.11)#584.9%(-3.73)#15,279
59.Slaughter Beach1.1%4.3%(-3.15)#594.9%(-3.76)#15,345
60.Wyoming0.91%4.3%(-3.36)#604.9%(-3.98)#15,667

Common Questions

What are the Top 10 Cities with the Highest Percentage of Population with a Degree in Computers and Mathematics in Delaware?
Top 10 Cities with the Highest Percentage of Population with a Degree in Computers and Mathematics in Delaware are:
What city has the Highest Percentage of Population with a Degree in Computers and Mathematics in Delaware?
Viola has the Highest Percentage of Population with a Degree in Computers and Mathematics in Delaware with 29.4%.
What is the Percentage of Population with a Degree in Computers and Mathematics in the State of Delaware?
Percentage of Population with a Degree in Computers and Mathematics in Delaware is 4.3%.
What is the Percentage of Population with a Degree in Computers and Mathematics in the United States?
Percentage of Population with a Degree in Computers and Mathematics in the United States is 4.9%.