Tuttletown, CA Map & Demographics
Tuttletown Map
Tuttletown Overview
$23,116
PER CAPITA INCOME
$74,042
AVG FAMILY INCOME
$73,807
AVG HOUSEHOLD INCOME
67.3%
WAGE / INCOME GAP [ % ]
32.7¢/ $1
WAGE / INCOME GAP [ $ ]
0.32
INEQUALITY / GINI INDEX
946
TOTAL POPULATION
504
MALE POPULATION
442
FEMALE POPULATION
114.03
MALES / 100 FEMALES
87.70
FEMALES / 100 MALES
38.7
MEDIAN AGE
3.8
AVG FAMILY SIZE
3.5
AVG HOUSEHOLD SIZE
386
LABOR FORCE [ PEOPLE ]
46.6%
PERCENT IN LABOR FORCE
9.3%
UNEMPLOYMENT RATE
Income in Tuttletown
Income Overview in Tuttletown
Per Capita Income in Tuttletown is $23,116, while median incomes of families and households are $74,042 and $73,807 respectively.
| Characteristic | Number | Measure |
| Per Capita Income | 946 | $23,116 |
| Median Family Income | 187 | $74,042 |
| Mean Family Income | 187 | $81,406 |
| Median Household Income | 268 | $73,807 |
| Mean Household Income | 268 | $75,278 |
| Income Deficit | 187 | $0 |
| Wage / Income Gap (%) | 946 | 67.26% |
| Wage / Income Gap ($) | 946 | 32.74¢ per $1 |
| Gini / Inequality Index | 946 | 0.32 |
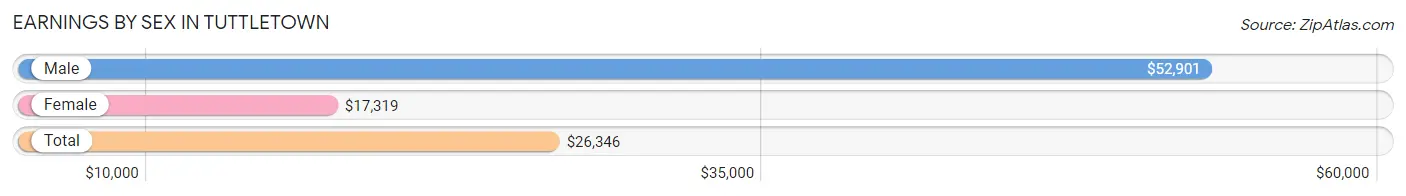
Earnings by Sex in Tuttletown
Average Earnings in Tuttletown are $26,346, $52,901 for men and $17,319 for women, a difference of 67.3%.
| Sex | Number | Average Earnings |
| Male | 181 (49.7%) | $52,901 |
| Female | 183 (50.3%) | $17,319 |
| Total | 364 (100.0%) | $26,346 |
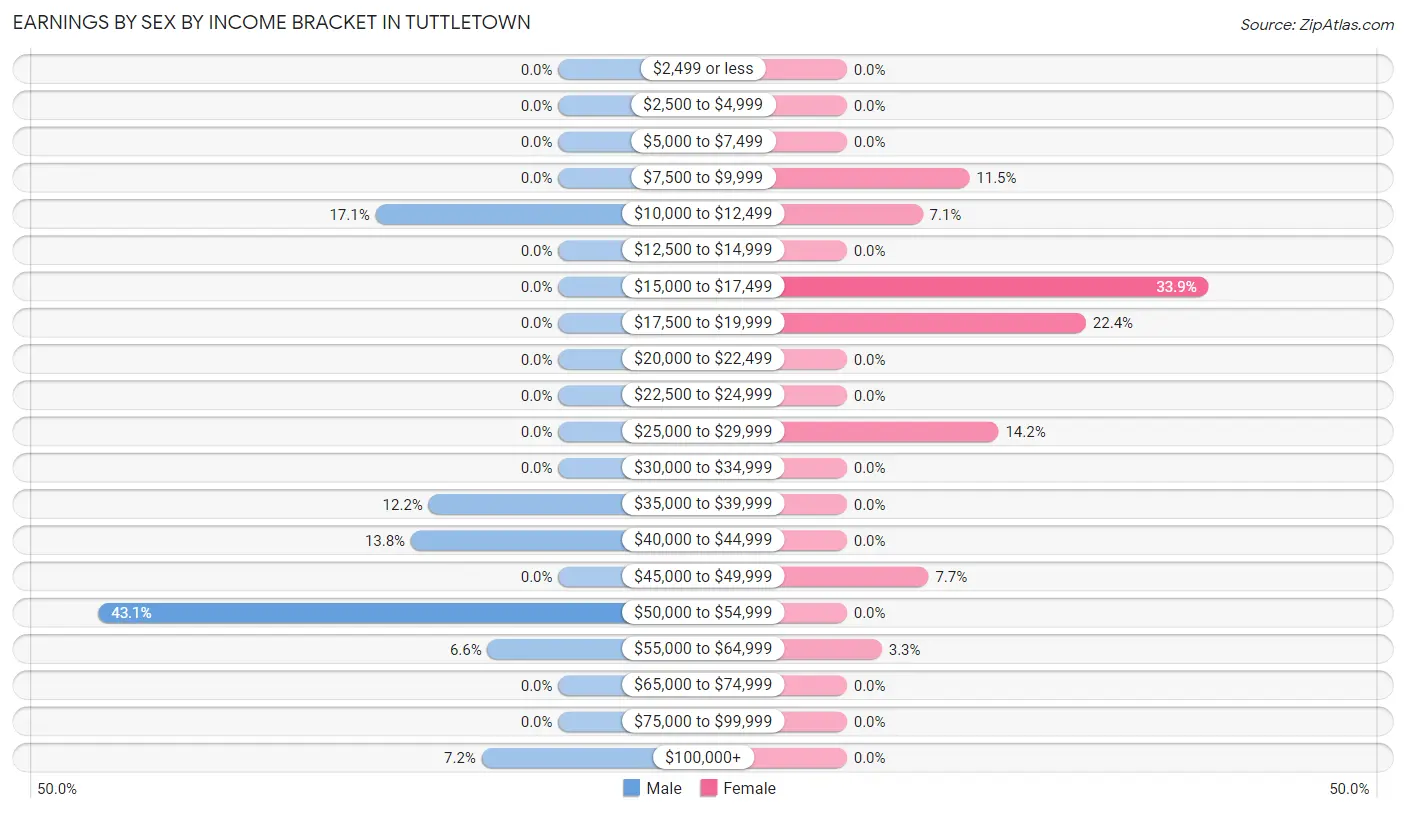
Earnings by Sex by Income Bracket in Tuttletown
The most common earnings brackets in Tuttletown are $50,000 to $54,999 for men (78 | 43.1%) and $15,000 to $17,499 for women (62 | 33.9%).
| Income | Male | Female |
| $2,499 or less | 0 (0.0%) | 0 (0.0%) |
| $2,500 to $4,999 | 0 (0.0%) | 0 (0.0%) |
| $5,000 to $7,499 | 0 (0.0%) | 0 (0.0%) |
| $7,500 to $9,999 | 0 (0.0%) | 21 (11.5%) |
| $10,000 to $12,499 | 31 (17.1%) | 13 (7.1%) |
| $12,500 to $14,999 | 0 (0.0%) | 0 (0.0%) |
| $15,000 to $17,499 | 0 (0.0%) | 62 (33.9%) |
| $17,500 to $19,999 | 0 (0.0%) | 41 (22.4%) |
| $20,000 to $22,499 | 0 (0.0%) | 0 (0.0%) |
| $22,500 to $24,999 | 0 (0.0%) | 0 (0.0%) |
| $25,000 to $29,999 | 0 (0.0%) | 26 (14.2%) |
| $30,000 to $34,999 | 0 (0.0%) | 0 (0.0%) |
| $35,000 to $39,999 | 22 (12.1%) | 0 (0.0%) |
| $40,000 to $44,999 | 25 (13.8%) | 0 (0.0%) |
| $45,000 to $49,999 | 0 (0.0%) | 14 (7.6%) |
| $50,000 to $54,999 | 78 (43.1%) | 0 (0.0%) |
| $55,000 to $64,999 | 12 (6.6%) | 6 (3.3%) |
| $65,000 to $74,999 | 0 (0.0%) | 0 (0.0%) |
| $75,000 to $99,999 | 0 (0.0%) | 0 (0.0%) |
| $100,000+ | 13 (7.2%) | 0 (0.0%) |
| Total | 181 (100.0%) | 183 (100.0%) |
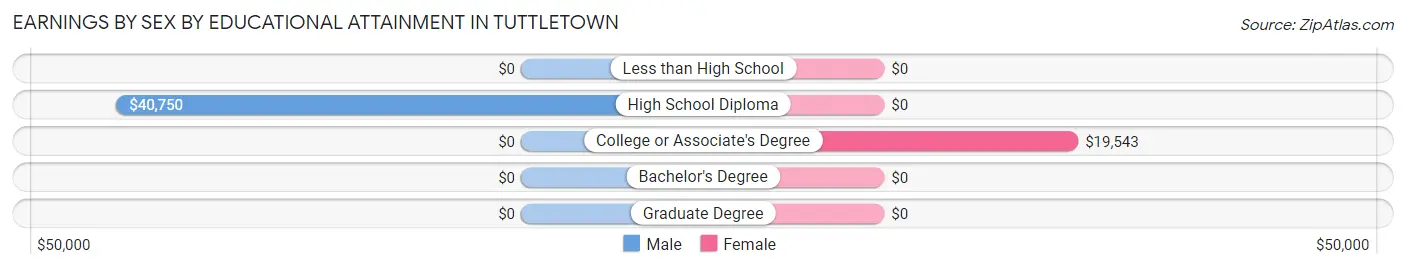
Earnings by Sex by Educational Attainment in Tuttletown
| Educational Attainment | Male Income | Female Income |
| Less than High School | - | - |
| High School Diploma | $40,750 | $0 |
| College or Associate's Degree | - | - |
| Bachelor's Degree | - | - |
| Graduate Degree | - | - |
| Total | - | - |
Family Income in Tuttletown
Family Income Brackets in Tuttletown
According to the Tuttletown family income data, there are 68 families falling into the $100,000 to $149,999 income range, which is the most common income bracket and makes up 36.4% of all families.
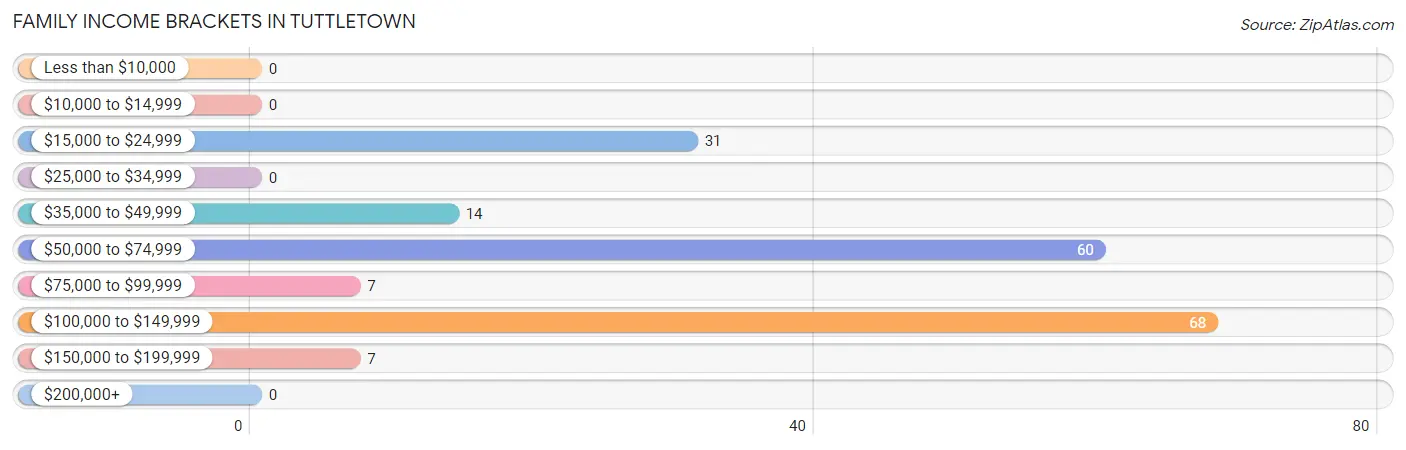
| Income Bracket | # Families | % Families |
| Less than $10,000 | 0 | 0.0% |
| $10,000 to $14,999 | 0 | 0.0% |
| $15,000 to $24,999 | 31 | 16.6% |
| $25,000 to $34,999 | 0 | 0.0% |
| $35,000 to $49,999 | 14 | 7.5% |
| $50,000 to $74,999 | 60 | 32.1% |
| $75,000 to $99,999 | 7 | 3.7% |
| $100,000 to $149,999 | 68 | 36.4% |
| $150,000 to $199,999 | 7 | 3.7% |
| $200,000+ | 0 | 0.0% |
Family Income by Famaliy Size in Tuttletown
3-person families (36 | 19.3%) account for the highest median family income in Tuttletown with $74,000 per family, while 3-person families (36 | 19.3%) have the highest median income of $24,667 per family member.
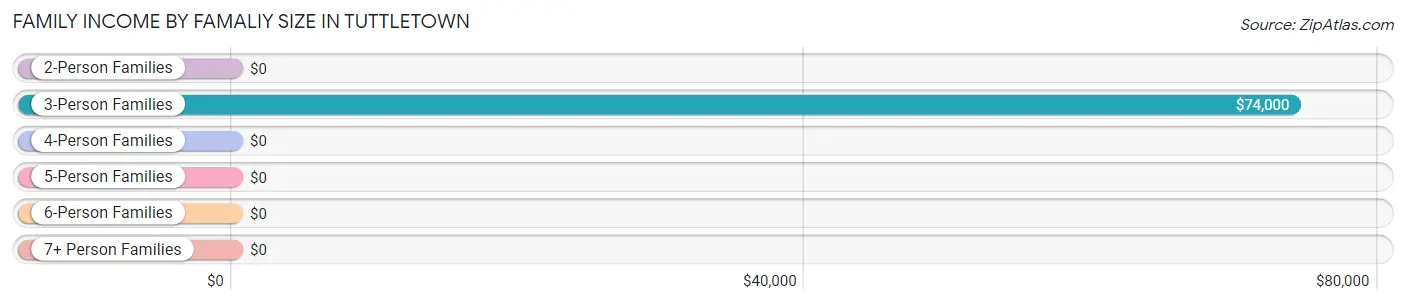
| Income Bracket | # Families | Median Income |
| 2-Person Families | 82 (43.9%) | $0 |
| 3-Person Families | 36 (19.3%) | $74,000 |
| 4-Person Families | 0 (0.0%) | $0 |
| 5-Person Families | 7 (3.7%) | $0 |
| 6-Person Families | 62 (33.2%) | $0 |
| 7+ Person Families | 0 (0.0%) | $0 |
| Total | 187 (100.0%) | $74,042 |
Family Income by Number of Earners in Tuttletown
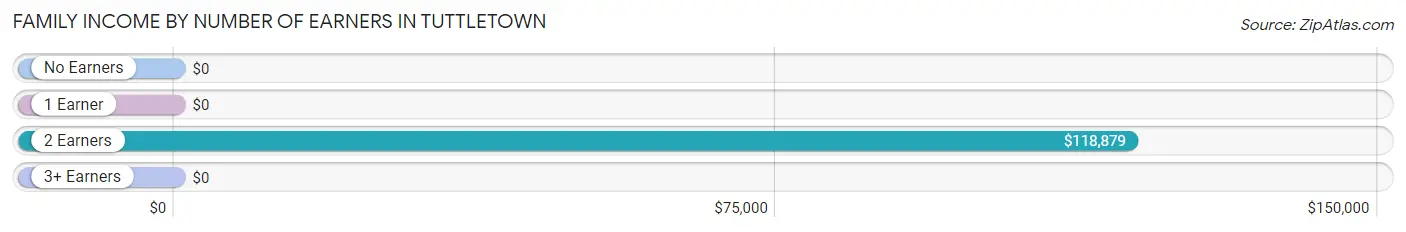
| Number of Earners | # Families | Median Income |
| No Earners | 23 (12.3%) | $0 |
| 1 Earner | 89 (47.6%) | $0 |
| 2 Earners | 75 (40.1%) | $118,879 |
| 3+ Earners | 0 (0.0%) | $0 |
| Total | 187 (100.0%) | $74,042 |
Household Income in Tuttletown
Household Income Brackets in Tuttletown
With 99 households falling in the category, the $100,000 to $149,999 income range is the most frequent in Tuttletown, accounting for 36.9% of all households.
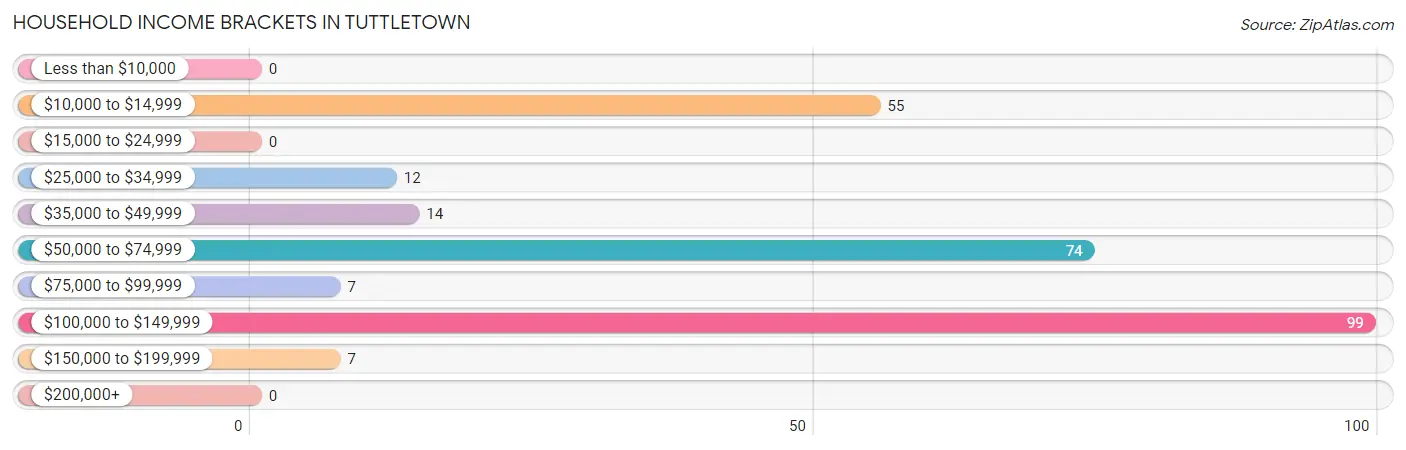
| Income Bracket | # Households | % Households |
| Less than $10,000 | 0 | 0.0% |
| $10,000 to $14,999 | 55 | 20.5% |
| $15,000 to $24,999 | 0 | 0.0% |
| $25,000 to $34,999 | 12 | 4.5% |
| $35,000 to $49,999 | 14 | 5.2% |
| $50,000 to $74,999 | 74 | 27.6% |
| $75,000 to $99,999 | 7 | 2.6% |
| $100,000 to $149,999 | 99 | 36.9% |
| $150,000 to $199,999 | 7 | 2.6% |
| $200,000+ | 0 | 0.0% |
Household Income by Householder Age in Tuttletown
The median household income in Tuttletown is $73,807, with the highest median household income of $118,309 found in the 25 to 44 years age bracket for the primary householder. A total of 106 households (39.6%) fall into this category.
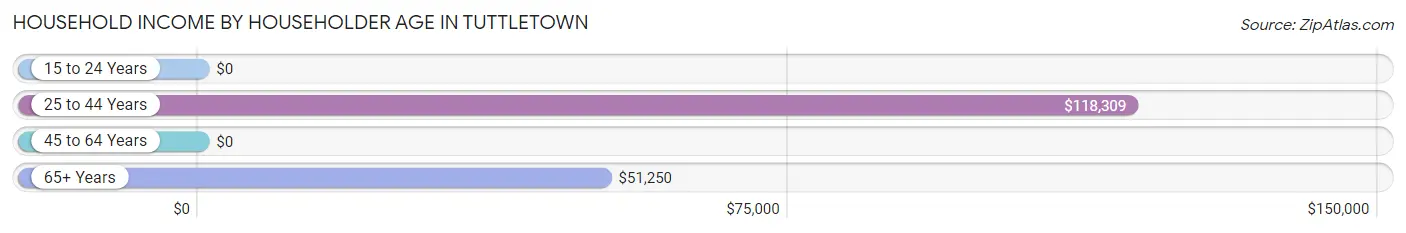
| Income Bracket | # Households | Median Income |
| 15 to 24 Years | 0 (0.0%) | $0 |
| 25 to 44 Years | 106 (39.6%) | $118,309 |
| 45 to 64 Years | 0 (0.0%) | $0 |
| 65+ Years | 162 (60.5%) | $51,250 |
| Total | 268 (100.0%) | $73,807 |
Poverty in Tuttletown
Income Below Poverty by Sex and Age in Tuttletown
With 11.1% poverty level for males and 29.2% for females among the residents of Tuttletown, 25 to 34 year old males and 35 to 44 year old females are the most vulnerable to poverty, with 31 males (100.0%) and 103 females (62.4%) in their respective age groups living below the poverty level.
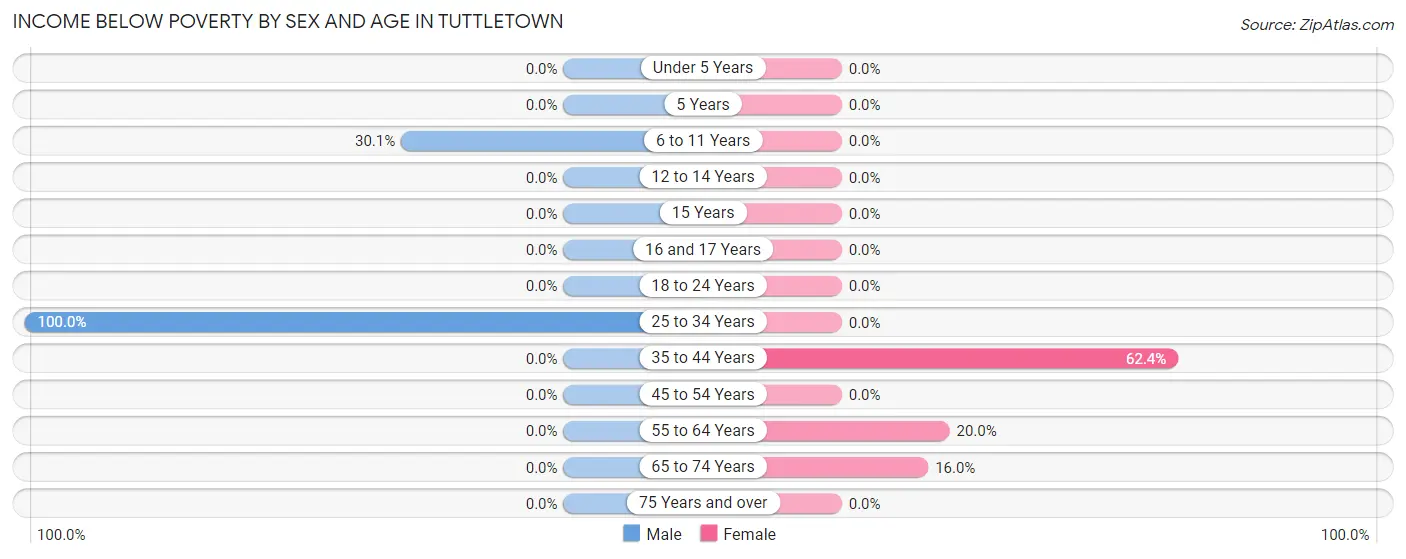
| Age Bracket | Male | Female |
| Under 5 Years | 0 (0.0%) | 0 (0.0%) |
| 5 Years | 0 (0.0%) | 0 (0.0%) |
| 6 to 11 Years | 25 (30.1%) | 0 (0.0%) |
| 12 to 14 Years | 0 (0.0%) | 0 (0.0%) |
| 15 Years | 0 (0.0%) | 0 (0.0%) |
| 16 and 17 Years | 0 (0.0%) | 0 (0.0%) |
| 18 to 24 Years | 0 (0.0%) | 0 (0.0%) |
| 25 to 34 Years | 31 (100.0%) | 0 (0.0%) |
| 35 to 44 Years | 0 (0.0%) | 103 (62.4%) |
| 45 to 54 Years | 0 (0.0%) | 0 (0.0%) |
| 55 to 64 Years | 0 (0.0%) | 9 (20.0%) |
| 65 to 74 Years | 0 (0.0%) | 17 (16.0%) |
| 75 Years and over | 0 (0.0%) | 0 (0.0%) |
| Total | 56 (11.1%) | 129 (29.2%) |
Income Above Poverty by Sex and Age in Tuttletown
According to the poverty statistics in Tuttletown, males aged under 5 years and females aged 6 to 11 years are the age groups that are most secure financially, with 100.0% of males and 100.0% of females in these age groups living above the poverty line.
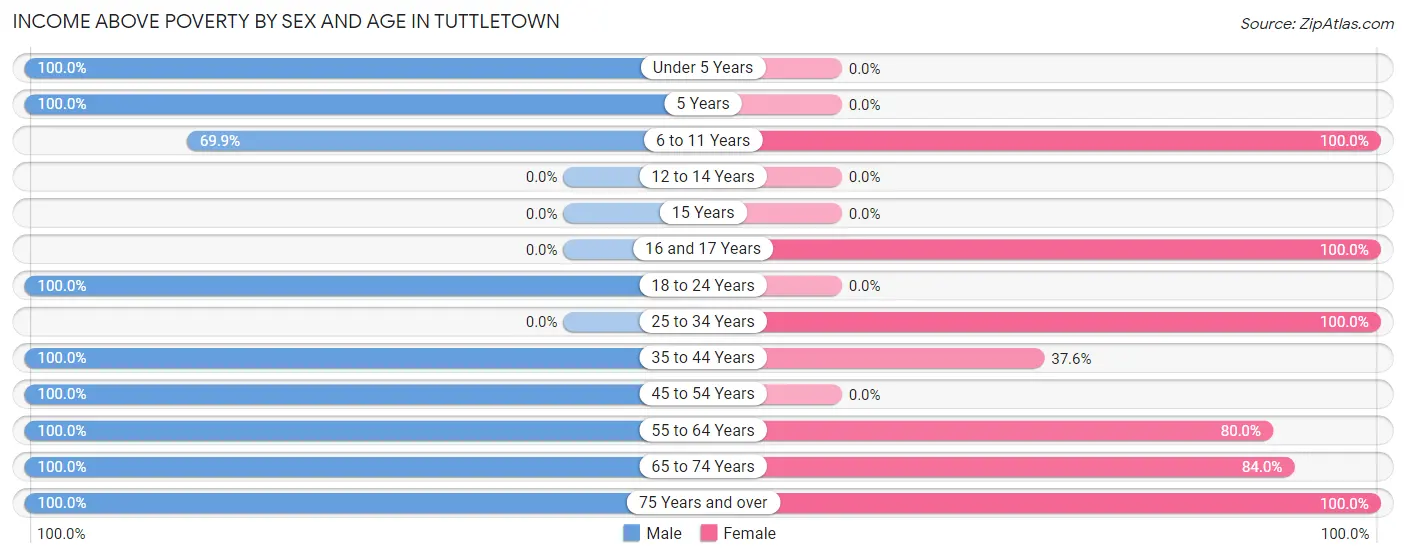
| Age Bracket | Male | Female |
| Under 5 Years | 7 (100.0%) | 0 (0.0%) |
| 5 Years | 14 (100.0%) | 0 (0.0%) |
| 6 to 11 Years | 58 (69.9%) | 13 (100.0%) |
| 12 to 14 Years | 0 (0.0%) | 0 (0.0%) |
| 15 Years | 0 (0.0%) | 0 (0.0%) |
| 16 and 17 Years | 0 (0.0%) | 80 (100.0%) |
| 18 to 24 Years | 78 (100.0%) | 0 (0.0%) |
| 25 to 34 Years | 0 (0.0%) | 13 (100.0%) |
| 35 to 44 Years | 79 (100.0%) | 62 (37.6%) |
| 45 to 54 Years | 13 (100.0%) | 0 (0.0%) |
| 55 to 64 Years | 25 (100.0%) | 36 (80.0%) |
| 65 to 74 Years | 148 (100.0%) | 89 (84.0%) |
| 75 Years and over | 26 (100.0%) | 20 (100.0%) |
| Total | 448 (88.9%) | 313 (70.8%) |
Income Below Poverty Among Married-Couple Families in Tuttletown
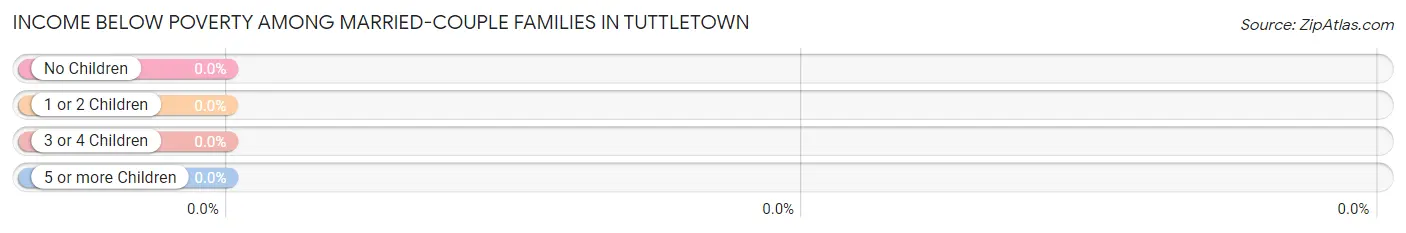
| Children | Above Poverty | Below Poverty |
| No Children | 67 (100.0%) | 0 (0.0%) |
| 1 or 2 Children | 68 (100.0%) | 0 (0.0%) |
| 3 or 4 Children | 7 (100.0%) | 0 (0.0%) |
| 5 or more Children | 0 (0.0%) | 0 (0.0%) |
| Total | 142 (100.0%) | 0 (0.0%) |
Income Below Poverty Among Single-Parent Households in Tuttletown
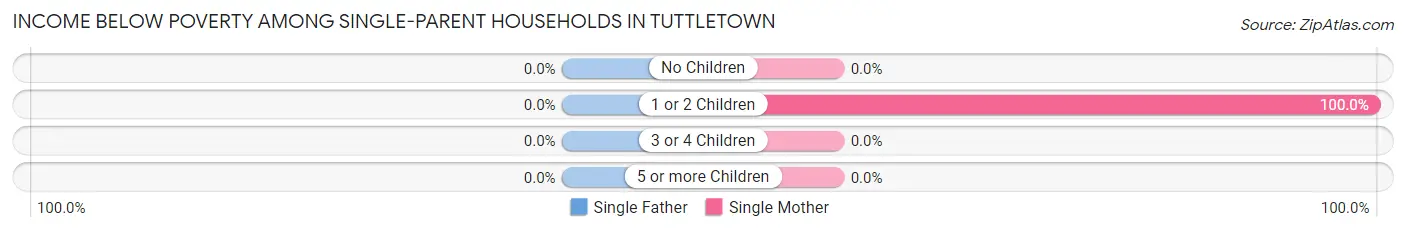
| Children | Single Father | Single Mother |
| No Children | 0 (0.0%) | 0 (0.0%) |
| 1 or 2 Children | 0 (0.0%) | 31 (100.0%) |
| 3 or 4 Children | 0 (0.0%) | 0 (0.0%) |
| 5 or more Children | 0 (0.0%) | 0 (0.0%) |
| Total | 0 (0.0%) | 31 (68.9%) |
Income Below Poverty Among Married-Couple vs Single-Parent Households in Tuttletown
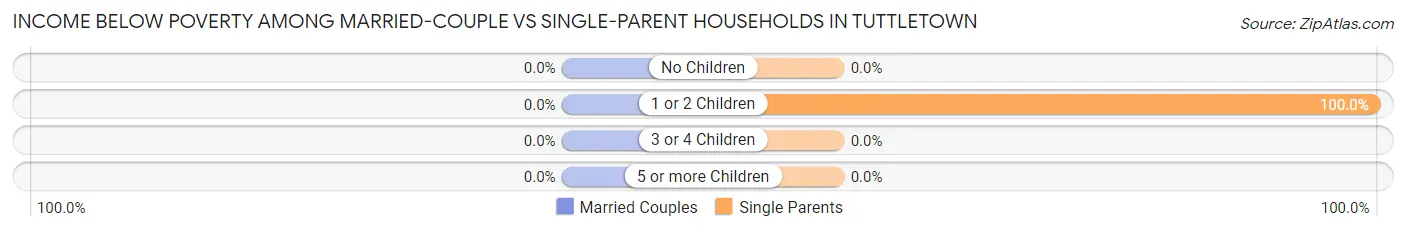
| Children | Married-Couple Families | Single-Parent Households |
| No Children | 0 (0.0%) | 0 (0.0%) |
| 1 or 2 Children | 0 (0.0%) | 31 (100.0%) |
| 3 or 4 Children | 0 (0.0%) | 0 (0.0%) |
| 5 or more Children | 0 (0.0%) | 0 (0.0%) |
| Total | 0 (0.0%) | 31 (68.9%) |
Race in Tuttletown
The most populous races in Tuttletown are White / Caucasian (831 | 87.8%), Hispanic or Latino (77 | 8.1%), and Two or more Races (77 | 8.1%).
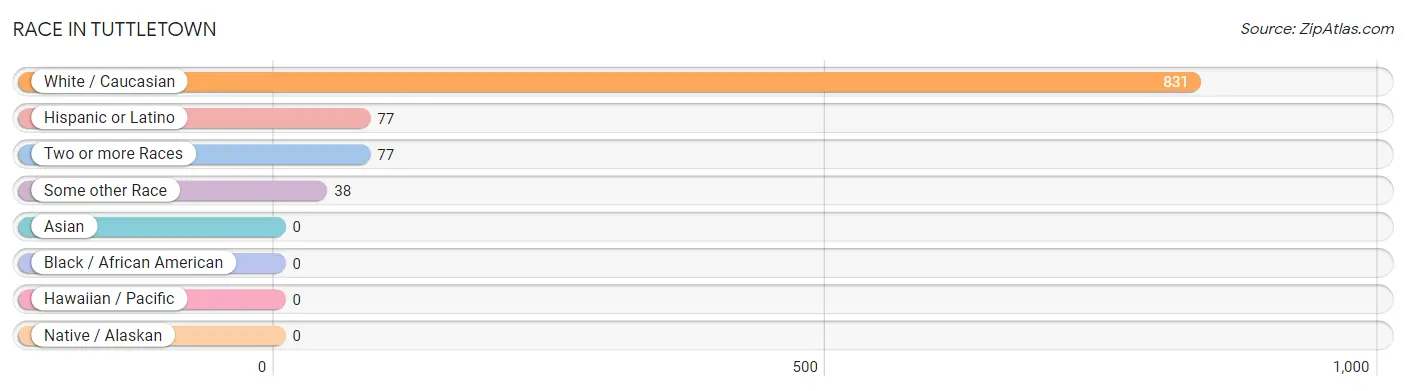
| Race | # Population | % Population |
| Asian | 0 | 0.0% |
| Black / African American | 0 | 0.0% |
| Hawaiian / Pacific | 0 | 0.0% |
| Hispanic or Latino | 77 | 8.1% |
| Native / Alaskan | 0 | 0.0% |
| White / Caucasian | 831 | 87.8% |
| Two or more Races | 77 | 8.1% |
| Some other Race | 38 | 4.0% |
| Total | 946 | 100.0% |
Ancestry in Tuttletown
The most populous ancestries reported in Tuttletown are Irish (380 | 40.2%), French Canadian (310 | 32.8%), English (156 | 16.5%), Spaniard (55 | 5.8%), and European (48 | 5.1%), together accounting for 100.3% of all Tuttletown residents.
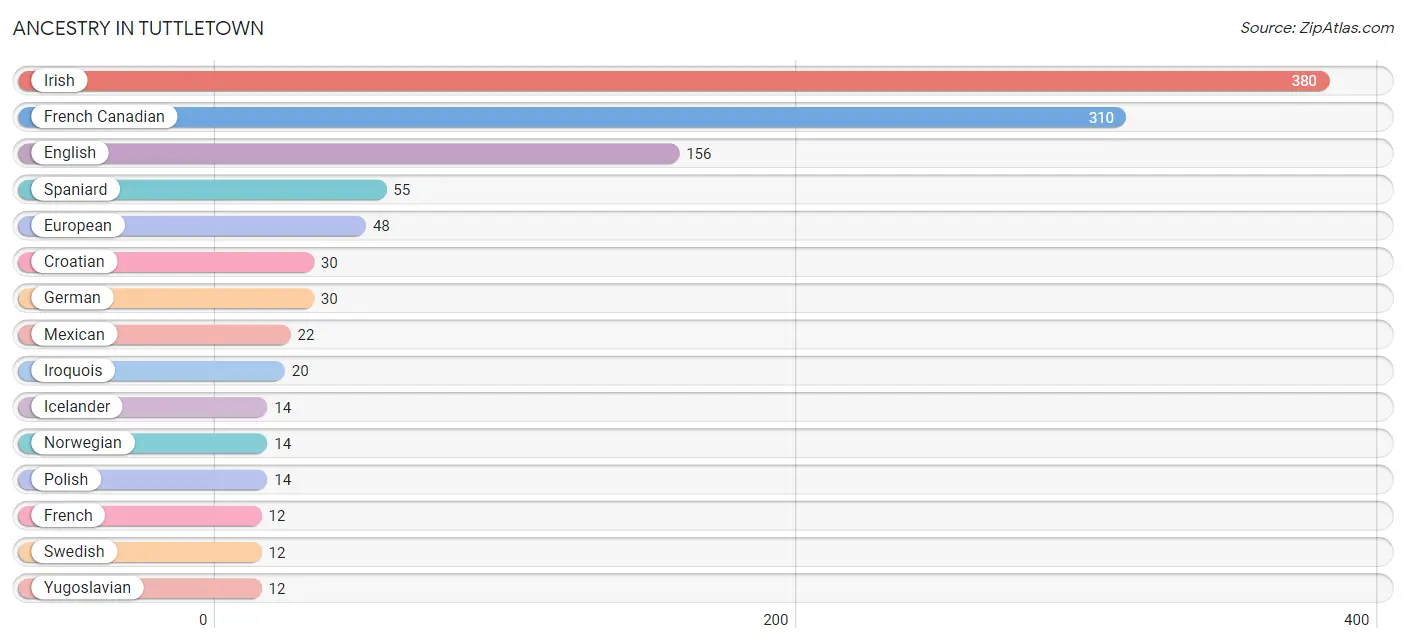
| Ancestry | # Population | % Population |
| Croatian | 30 | 3.2% |
| English | 156 | 16.5% |
| European | 48 | 5.1% |
| French | 12 | 1.3% |
| French Canadian | 310 | 32.8% |
| German | 30 | 3.2% |
| Icelander | 14 | 1.5% |
| Irish | 380 | 40.2% |
| Iroquois | 20 | 2.1% |
| Mexican | 22 | 2.3% |
| Norwegian | 14 | 1.5% |
| Polish | 14 | 1.5% |
| Spaniard | 55 | 5.8% |
| Swedish | 12 | 1.3% |
| Yugoslavian | 12 | 1.3% | View All 15 Rows |
Immigrants in Tuttletown
The most numerous immigrant groups reported in Tuttletown came from , and Canada (14 | 1.5%), together accounting for 1.5% of all Tuttletown residents.

| Immigration Origin | # Population | % Population |
| Canada | 14 | 1.5% | View All 1 Rows |
Sex and Age in Tuttletown
Sex and Age in Tuttletown
The most populous age groups in Tuttletown are 5 to 9 Years (97 | 19.3%) for men and 35 to 39 Years (165 | 37.3%) for women.
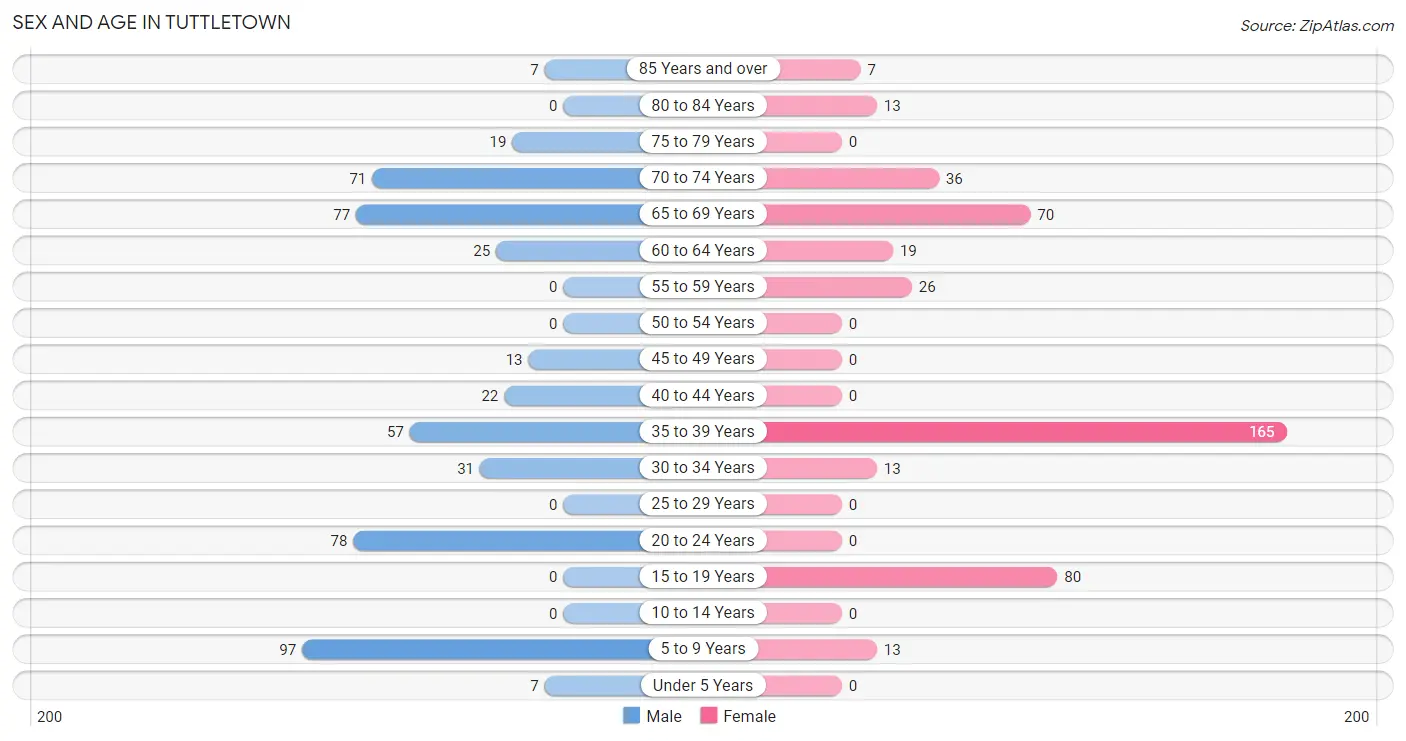
| Age Bracket | Male | Female |
| Under 5 Years | 7 (1.4%) | 0 (0.0%) |
| 5 to 9 Years | 97 (19.3%) | 13 (2.9%) |
| 10 to 14 Years | 0 (0.0%) | 0 (0.0%) |
| 15 to 19 Years | 0 (0.0%) | 80 (18.1%) |
| 20 to 24 Years | 78 (15.5%) | 0 (0.0%) |
| 25 to 29 Years | 0 (0.0%) | 0 (0.0%) |
| 30 to 34 Years | 31 (6.1%) | 13 (2.9%) |
| 35 to 39 Years | 57 (11.3%) | 165 (37.3%) |
| 40 to 44 Years | 22 (4.4%) | 0 (0.0%) |
| 45 to 49 Years | 13 (2.6%) | 0 (0.0%) |
| 50 to 54 Years | 0 (0.0%) | 0 (0.0%) |
| 55 to 59 Years | 0 (0.0%) | 26 (5.9%) |
| 60 to 64 Years | 25 (5.0%) | 19 (4.3%) |
| 65 to 69 Years | 77 (15.3%) | 70 (15.8%) |
| 70 to 74 Years | 71 (14.1%) | 36 (8.1%) |
| 75 to 79 Years | 19 (3.8%) | 0 (0.0%) |
| 80 to 84 Years | 0 (0.0%) | 13 (2.9%) |
| 85 Years and over | 7 (1.4%) | 7 (1.6%) |
| Total | 504 (100.0%) | 442 (100.0%) |
Families and Households in Tuttletown
Median Family Size in Tuttletown
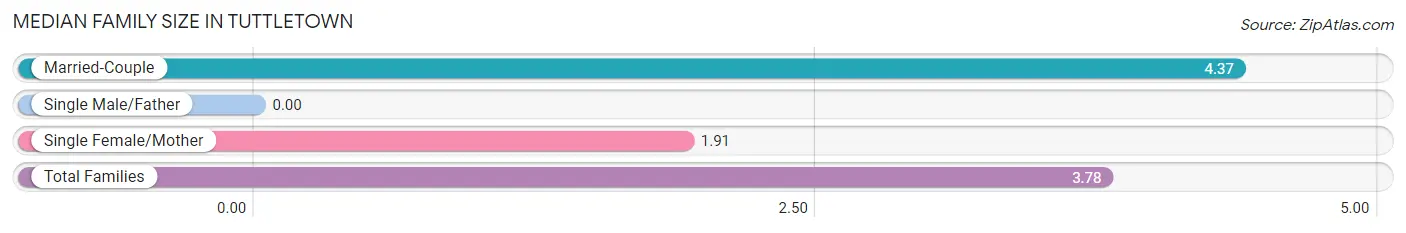
| Family Type | # Families | Family Size |
| Married-Couple | 142 (75.9%) | 4.37 |
| Single Male/Father | 0 (0.0%) | - |
| Single Female/Mother | 45 (24.1%) | 1.91 |
| Total Families | 187 (100.0%) | 3.78 |
Median Household Size in Tuttletown
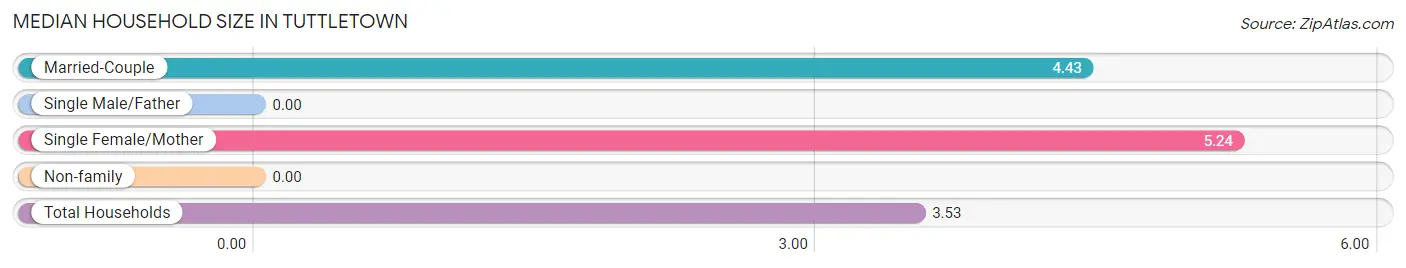
| Household Type | # Households | Household Size |
| Married-Couple | 142 (53.0%) | 4.43 |
| Single Male/Father | 0 (0.0%) | - |
| Single Female/Mother | 45 (16.8%) | 5.24 |
| Non-family | 81 (30.2%) | - |
| Total Households | 268 (100.0%) | 3.53 |
Household Size by Marriage Status in Tuttletown
Out of a total of 268 households in Tuttletown, 187 (69.8%) are family households, while 81 (30.2%) are nonfamily households. The most numerous type of family households are 6-person households, comprising 69, and the most common type of nonfamily households are 1-person households, comprising 81.
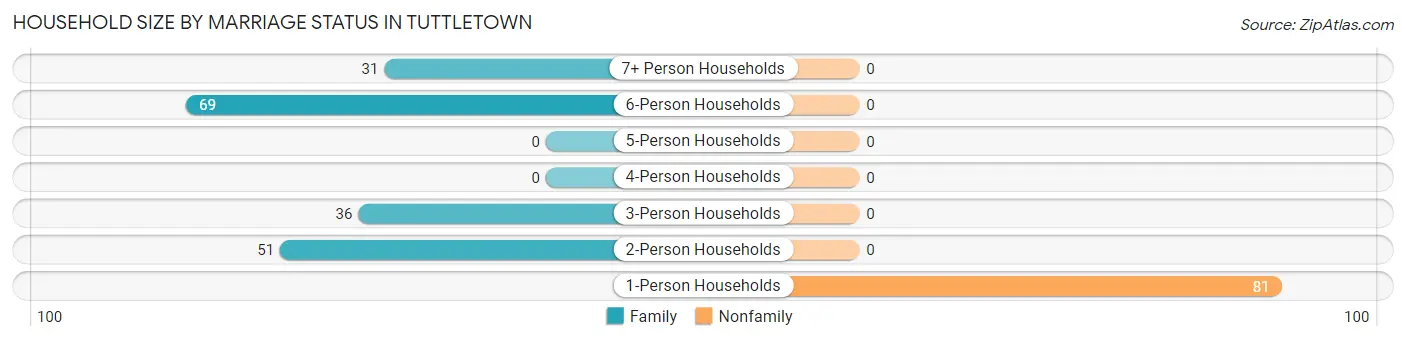
| Household Size | Family Households | Nonfamily Households |
| 1-Person Households | - | 81 (30.2%) |
| 2-Person Households | 51 (19.0%) | 0 (0.0%) |
| 3-Person Households | 36 (13.4%) | 0 (0.0%) |
| 4-Person Households | 0 (0.0%) | 0 (0.0%) |
| 5-Person Households | 0 (0.0%) | 0 (0.0%) |
| 6-Person Households | 69 (25.8%) | 0 (0.0%) |
| 7+ Person Households | 31 (11.6%) | 0 (0.0%) |
| Total | 187 (69.8%) | 81 (30.2%) |
Female Fertility in Tuttletown
Fertility by Age in Tuttletown
| Age Bracket | Women with Births | Births / 1,000 Women |
| 15 to 19 years | 0 (0.0%) | 0.0 |
| 20 to 34 years | 0 (0.0%) | 0.0 |
| 35 to 50 years | 0 (0.0%) | 0.0 |
| Total | 0 (0.0%) | 0.0 |
Fertility by Age by Marriage Status in Tuttletown
| Age Bracket | Married | Unmarried |
| 15 to 19 years | 0 (0.0%) | 0 (0.0%) |
| 20 to 34 years | 0 (0.0%) | 0 (0.0%) |
| 35 to 50 years | 0 (0.0%) | 0 (0.0%) |
| Total | 0 (0.0%) | 0 (0.0%) |
Fertility by Education in Tuttletown
| Educational Attainment | Women with Births | Births / 1,000 Women |
| Less than High School | 0 (0.0%) | 0.0 |
| High School Diploma | 0 (0.0%) | 0.0 |
| College or Associate's Degree | 0 (0.0%) | 0.0 |
| Bachelor's Degree | 0 (0.0%) | 0.0 |
| Graduate Degree | 0 (0.0%) | 0.0 |
| Total | 0 (0.0%) | 0.0 |
Fertility by Education by Marriage Status in Tuttletown
| Educational Attainment | Married | Unmarried |
| Less than High School | 0 (0.0%) | 0 (0.0%) |
| High School Diploma | 0 (0.0%) | 0 (0.0%) |
| College or Associate's Degree | 0 (0.0%) | 0 (0.0%) |
| Bachelor's Degree | 0 (0.0%) | 0 (0.0%) |
| Graduate Degree | 0 (0.0%) | 0 (0.0%) |
| Total | 0 (0.0%) | 0 (0.0%) |
Employment Characteristics in Tuttletown
Employment by Class of Employer in Tuttletown
Among the 340 employed individuals in Tuttletown, private company employees (173 | 50.9%), self-employed (not incorporated) (135 | 39.7%), and state government employees (26 | 7.6%) make up the most common classes of employment.
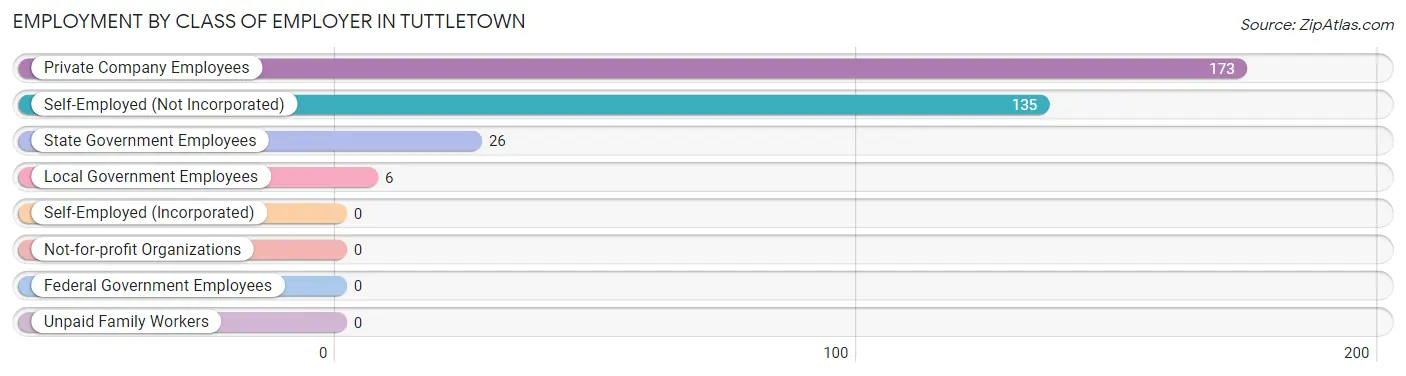
| Employer Class | # Employees | % Employees |
| Private Company Employees | 173 | 50.9% |
| Self-Employed (Incorporated) | 0 | 0.0% |
| Self-Employed (Not Incorporated) | 135 | 39.7% |
| Not-for-profit Organizations | 0 | 0.0% |
| Local Government Employees | 6 | 1.8% |
| State Government Employees | 26 | 7.6% |
| Federal Government Employees | 0 | 0.0% |
| Unpaid Family Workers | 0 | 0.0% |
| Total | 340 | 100.0% |
Employment Status by Age in Tuttletown
According to the labor force statistics for Tuttletown, out of the total population over 16 years of age (829), 46.6% or 386 individuals are in the labor force, with 9.3% or 36 of them unemployed. The age group with the highest labor force participation rate is 20 to 24 years, with 100.0% or 78 individuals in the labor force. Within the labor force, the 35 to 44 years age range has the highest percentage of unemployed individuals, with 22.1% or 36 of them being unemployed.
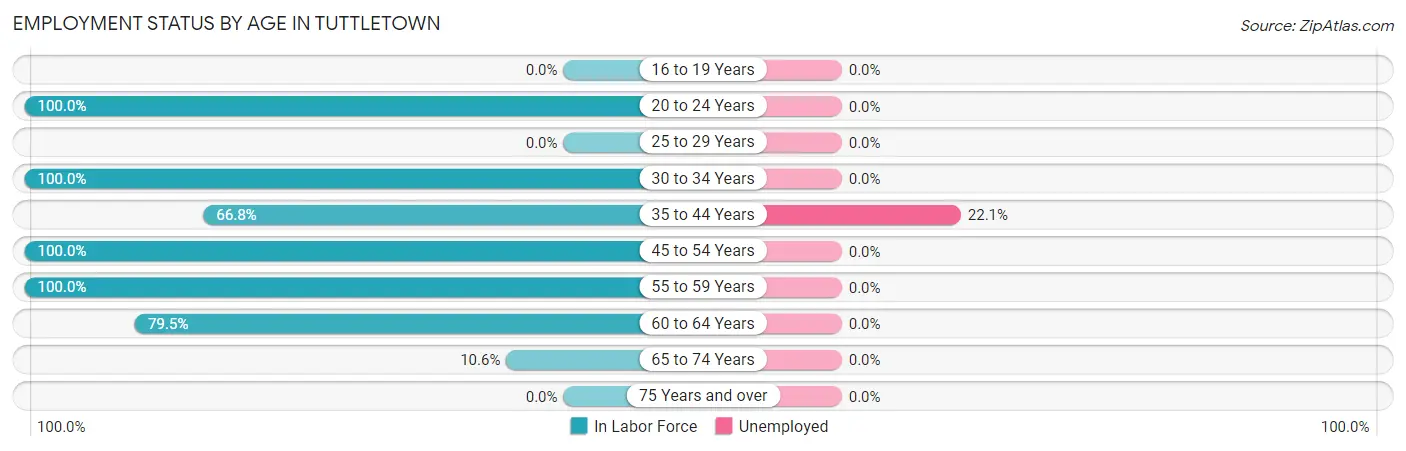
| Age Bracket | In Labor Force | Unemployed |
| 16 to 19 Years | 0 (0.0%) | 0 (0.0%) |
| 20 to 24 Years | 78 (100.0%) | 0 (0.0%) |
| 25 to 29 Years | 0 (0.0%) | 0 (0.0%) |
| 30 to 34 Years | 44 (100.0%) | 0 (0.0%) |
| 35 to 44 Years | 163 (66.8%) | 36 (22.1%) |
| 45 to 54 Years | 13 (100.0%) | 0 (0.0%) |
| 55 to 59 Years | 26 (100.0%) | 0 (0.0%) |
| 60 to 64 Years | 35 (79.5%) | 0 (0.0%) |
| 65 to 74 Years | 27 (10.6%) | 0 (0.0%) |
| 75 Years and over | 0 (0.0%) | 0 (0.0%) |
| Total | 386 (46.6%) | 36 (9.3%) |
Employment Status by Educational Attainment in Tuttletown
According to labor force statistics for Tuttletown, 75.7% of individuals (281) out of the total population between 25 and 64 years of age (371) are in the labor force, with 12.8% or 36 of them being unemployed. The group with the highest labor force participation rate are those with the educational attainment of high school diploma, with 77.7% or 157 individuals in the labor force. Within the labor force, individuals with high school diploma education have the highest percentage of unemployment, with 22.9% or 36 of them being unemployed.
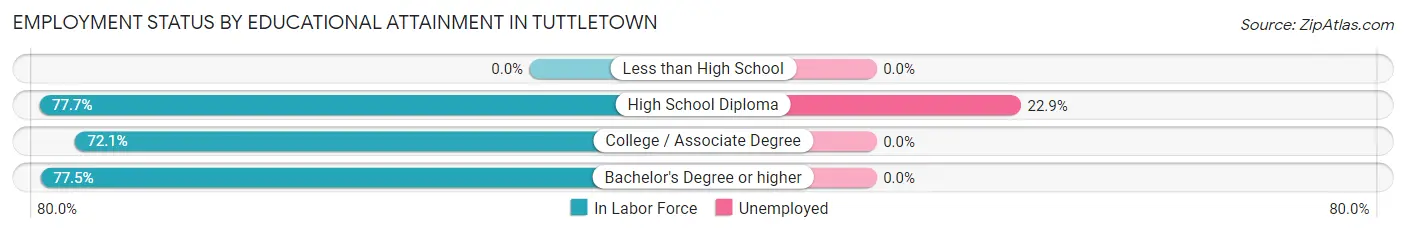
| Educational Attainment | In Labor Force | Unemployed |
| Less than High School | 0 (0.0%) | 0 (0.0%) |
| High School Diploma | 157 (77.7%) | 46 (22.9%) |
| College / Associate Degree | 93 (72.1%) | 0 (0.0%) |
| Bachelor's Degree or higher | 31 (77.5%) | 0 (0.0%) |
| Total | 281 (75.7%) | 47 (12.8%) |
Employment Occupations by Sex in Tuttletown
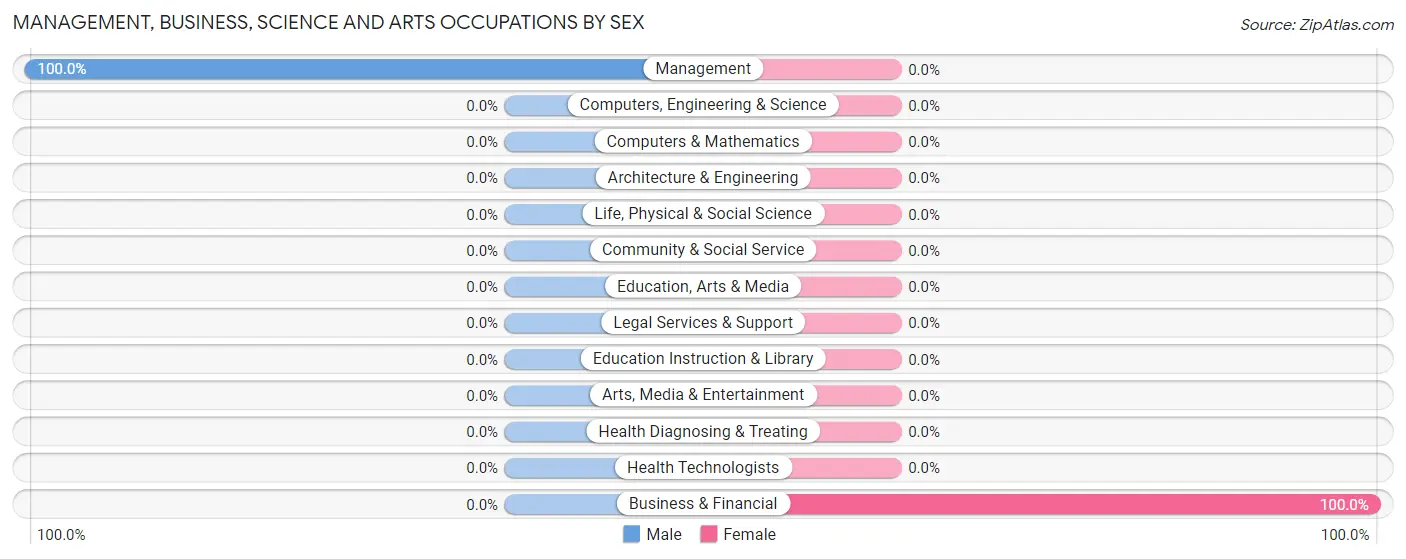
Management, Business, Science and Arts Occupations
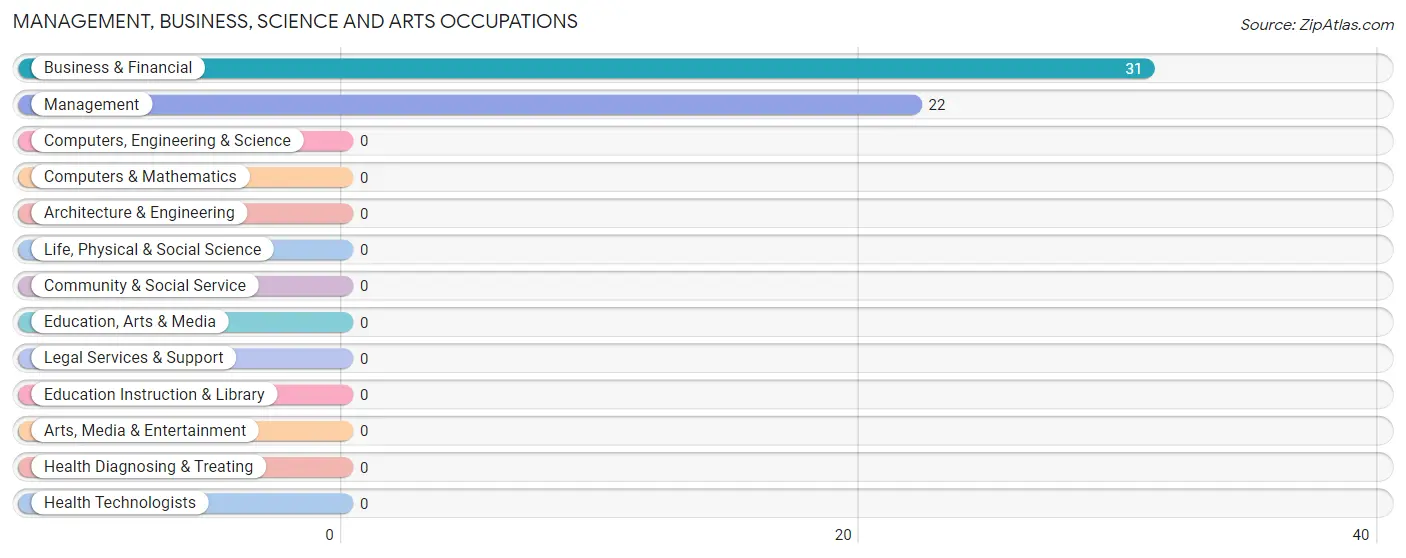
The most common Management, Business, Science and Arts occupations in Tuttletown are Business & Financial (31 | 8.9%), and Management (22 | 6.3%).
Management, Business, Science and Arts Occupations by Sex
| Occupation | Male | Female |
| Management | 22 (100.0%) | 0 (0.0%) |
| Business & Financial | 0 (0.0%) | 31 (100.0%) |
| Computers, Engineering & Science | 0 (0.0%) | 0 (0.0%) |
| Computers & Mathematics | 0 (0.0%) | 0 (0.0%) |
| Architecture & Engineering | 0 (0.0%) | 0 (0.0%) |
| Life, Physical & Social Science | 0 (0.0%) | 0 (0.0%) |
| Community & Social Service | 0 (0.0%) | 0 (0.0%) |
| Education, Arts & Media | 0 (0.0%) | 0 (0.0%) |
| Legal Services & Support | 0 (0.0%) | 0 (0.0%) |
| Education Instruction & Library | 0 (0.0%) | 0 (0.0%) |
| Arts, Media & Entertainment | 0 (0.0%) | 0 (0.0%) |
| Health Diagnosing & Treating | 0 (0.0%) | 0 (0.0%) |
| Health Technologists | 0 (0.0%) | 0 (0.0%) |
| Total (Category) | 22 (41.5%) | 31 (58.5%) |
| Total (Overall) | 181 (51.7%) | 169 (48.3%) |
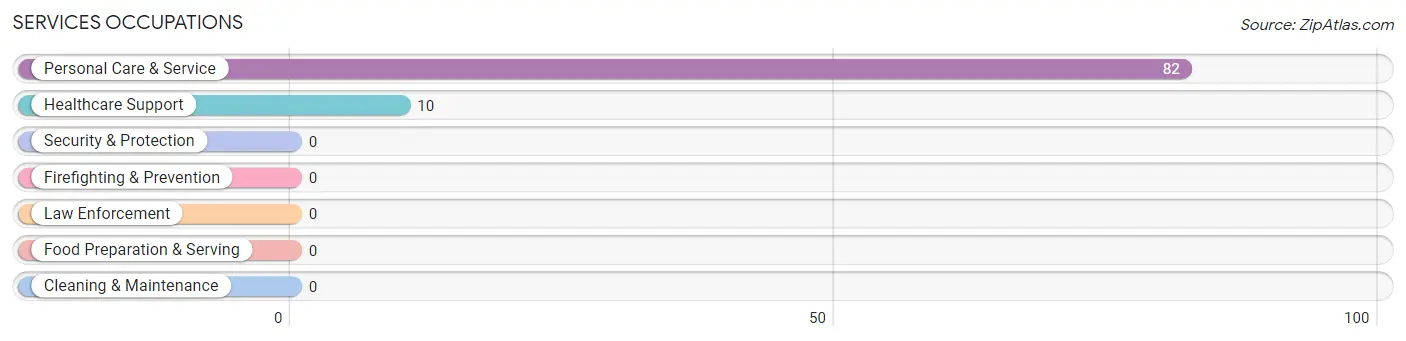
Services Occupations
The most common Services occupations in Tuttletown are Personal Care & Service (82 | 23.4%), and Healthcare Support (10 | 2.9%).
Services Occupations by Sex
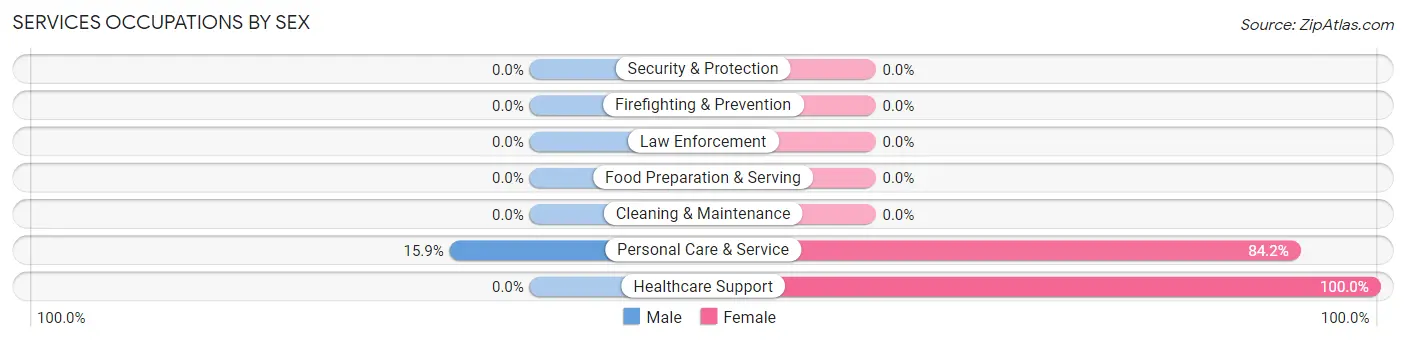
| Occupation | Male | Female |
| Healthcare Support | 0 (0.0%) | 10 (100.0%) |
| Security & Protection | 0 (0.0%) | 0 (0.0%) |
| Firefighting & Prevention | 0 (0.0%) | 0 (0.0%) |
| Law Enforcement | 0 (0.0%) | 0 (0.0%) |
| Food Preparation & Serving | 0 (0.0%) | 0 (0.0%) |
| Cleaning & Maintenance | 0 (0.0%) | 0 (0.0%) |
| Personal Care & Service | 13 (15.9%) | 69 (84.2%) |
| Total (Category) | 13 (14.1%) | 79 (85.9%) |
| Total (Overall) | 181 (51.7%) | 169 (48.3%) |
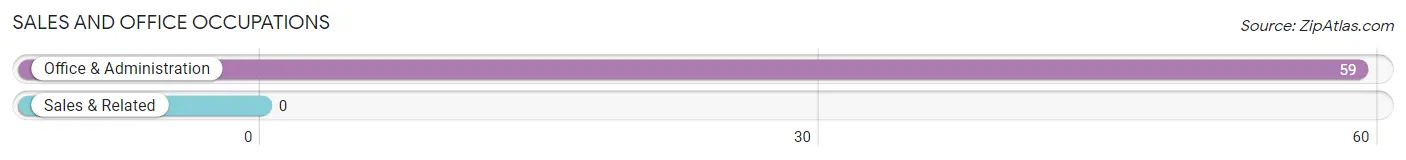
Sales and Office Occupations
The most common Sales and Office occupations in Tuttletown are , and Office & Administration (59 | 16.9%).
Sales and Office Occupations by Sex
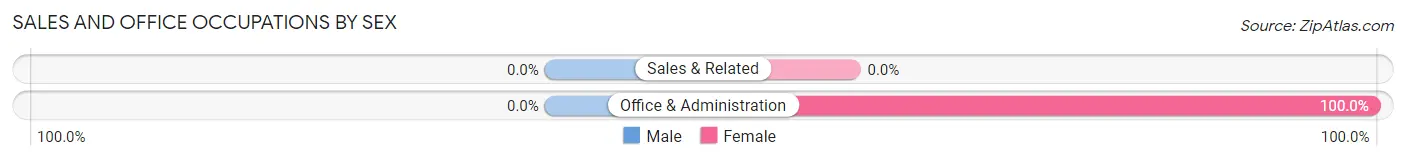
| Occupation | Male | Female |
| Sales & Related | 0 (0.0%) | 0 (0.0%) |
| Office & Administration | 0 (0.0%) | 59 (100.0%) |
| Total (Category) | 0 (0.0%) | 59 (100.0%) |
| Total (Overall) | 181 (51.7%) | 169 (48.3%) |
Natural Resources, Construction and Maintenance Occupations
The most common Natural Resources, Construction and Maintenance occupations in Tuttletown are Construction & Extraction (43 | 12.3%), and Installation, Maintenance & Repair (25 | 7.1%).
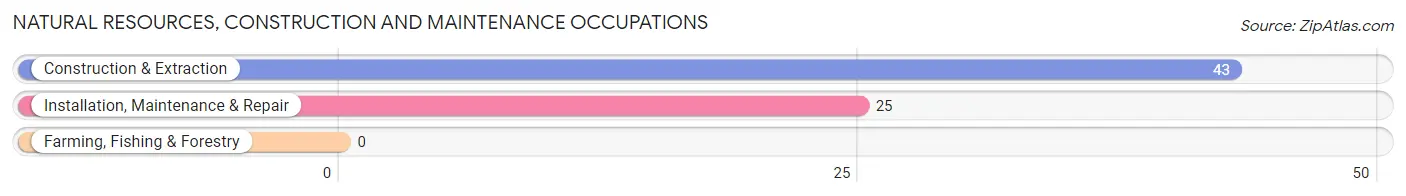
Natural Resources, Construction and Maintenance Occupations by Sex
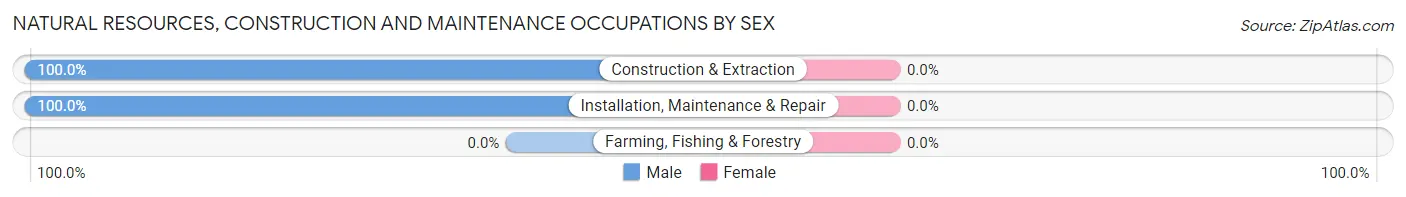
| Occupation | Male | Female |
| Farming, Fishing & Forestry | 0 (0.0%) | 0 (0.0%) |
| Construction & Extraction | 43 (100.0%) | 0 (0.0%) |
| Installation, Maintenance & Repair | 25 (100.0%) | 0 (0.0%) |
| Total (Category) | 68 (100.0%) | 0 (0.0%) |
| Total (Overall) | 181 (51.7%) | 169 (48.3%) |
Production, Transportation and Moving Occupations
The most common Production, Transportation and Moving occupations in Tuttletown are , and Production (78 | 22.3%).
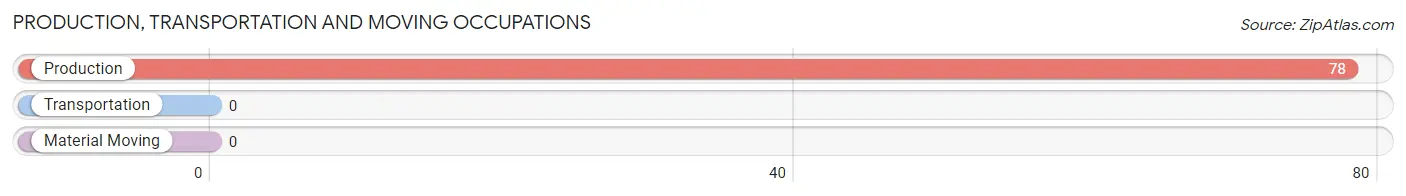
Production, Transportation and Moving Occupations by Sex
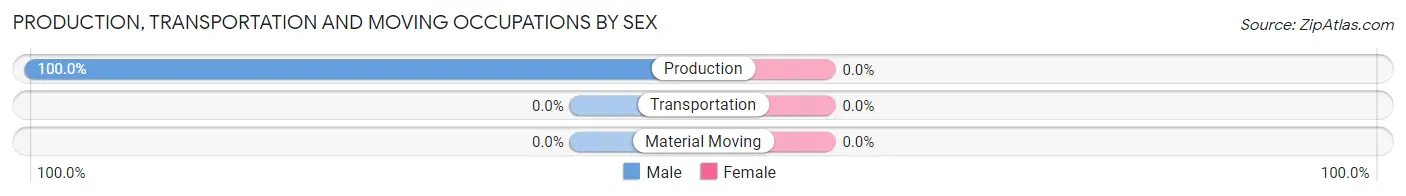
| Occupation | Male | Female |
| Production | 78 (100.0%) | 0 (0.0%) |
| Transportation | 0 (0.0%) | 0 (0.0%) |
| Material Moving | 0 (0.0%) | 0 (0.0%) |
| Total (Category) | 78 (100.0%) | 0 (0.0%) |
| Total (Overall) | 181 (51.7%) | 169 (48.3%) |
Employment Industries by Sex in Tuttletown
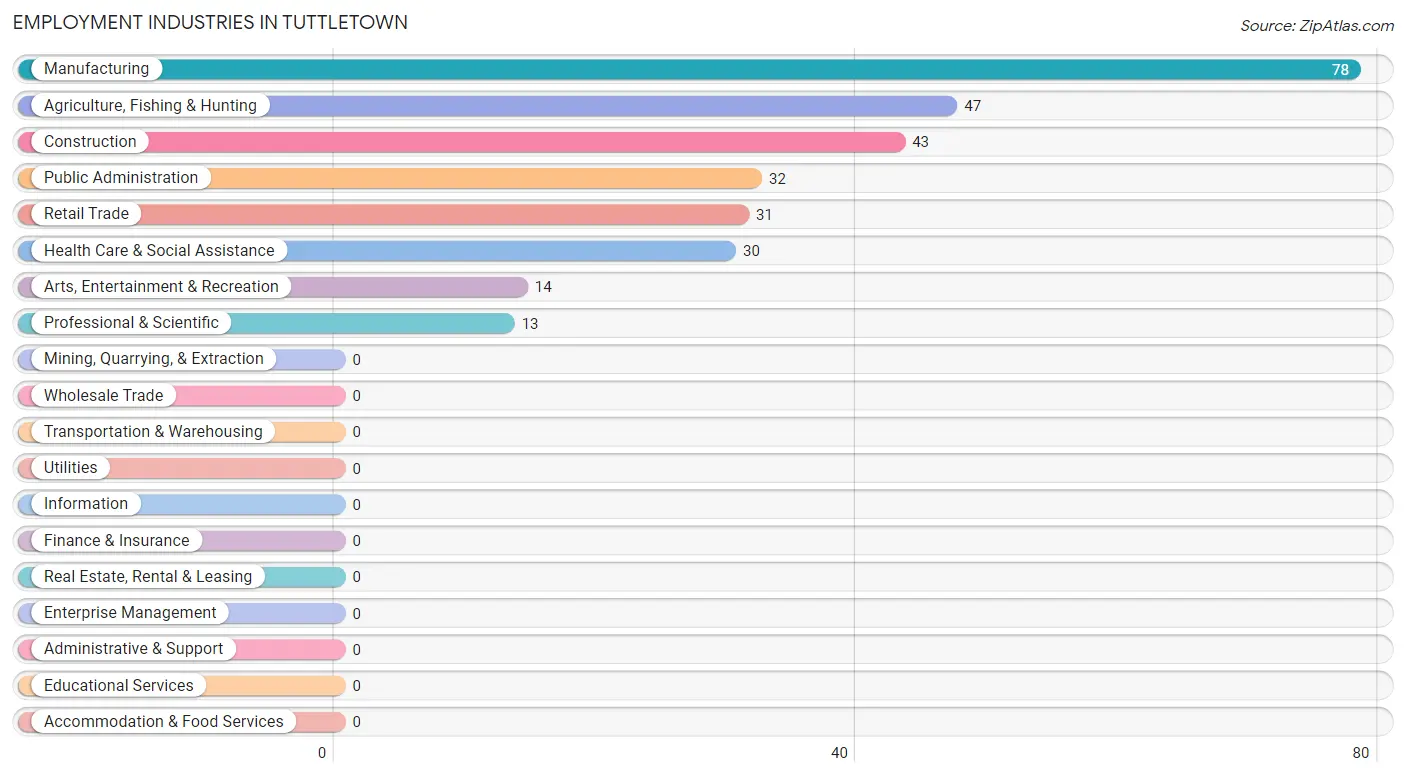
Employment Industries in Tuttletown
The major employment industries in Tuttletown include Manufacturing (78 | 22.3%), Agriculture, Fishing & Hunting (47 | 13.4%), Construction (43 | 12.3%), Public Administration (32 | 9.1%), and Retail Trade (31 | 8.9%).
Employment Industries by Sex in Tuttletown
The Tuttletown industries that see more men than women are Agriculture, Fishing & Hunting (100.0%), Construction (100.0%), and Manufacturing (100.0%), whereas the industries that tend to have a higher number of women are Retail Trade (100.0%), Professional & Scientific (100.0%), and Arts, Entertainment & Recreation (100.0%).
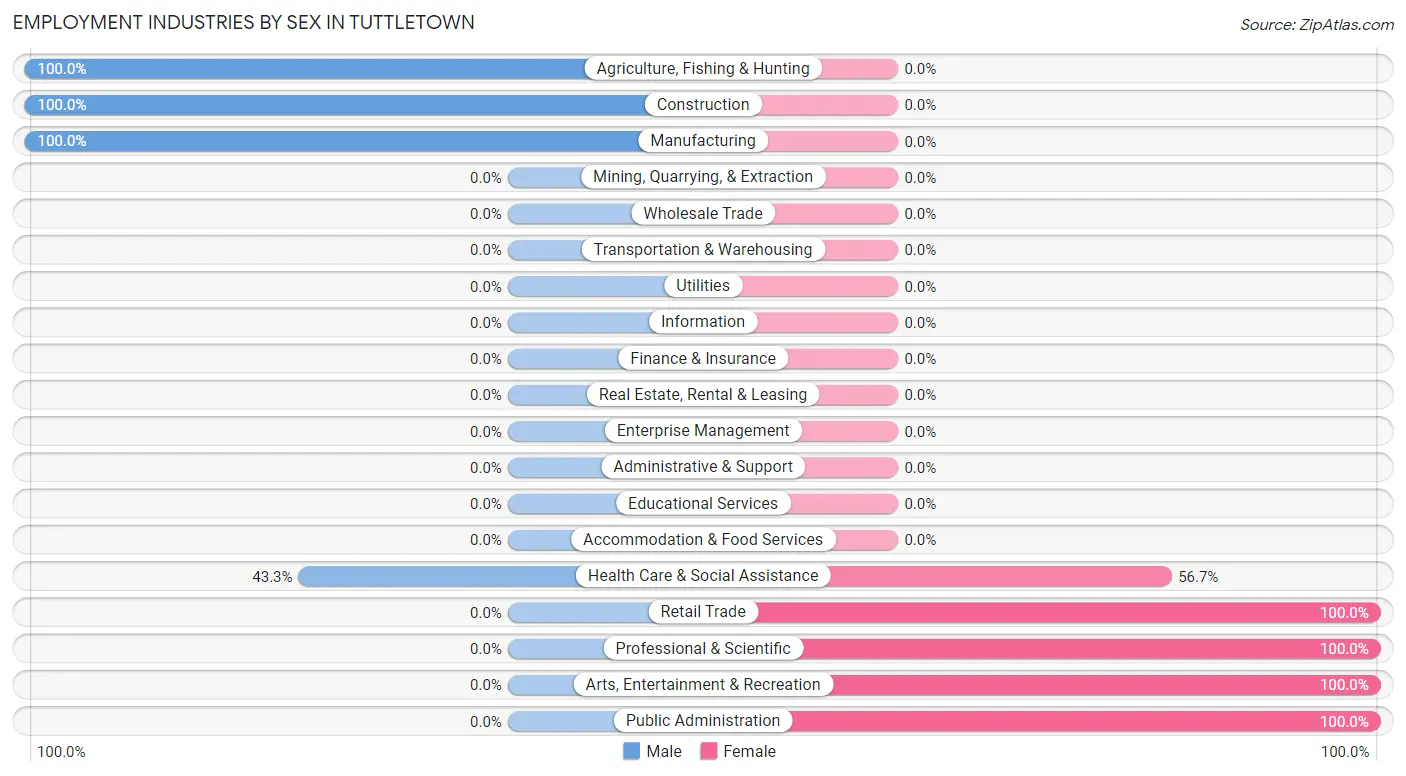
| Industry | Male | Female |
| Agriculture, Fishing & Hunting | 47 (100.0%) | 0 (0.0%) |
| Mining, Quarrying, & Extraction | 0 (0.0%) | 0 (0.0%) |
| Construction | 43 (100.0%) | 0 (0.0%) |
| Manufacturing | 78 (100.0%) | 0 (0.0%) |
| Wholesale Trade | 0 (0.0%) | 0 (0.0%) |
| Retail Trade | 0 (0.0%) | 31 (100.0%) |
| Transportation & Warehousing | 0 (0.0%) | 0 (0.0%) |
| Utilities | 0 (0.0%) | 0 (0.0%) |
| Information | 0 (0.0%) | 0 (0.0%) |
| Finance & Insurance | 0 (0.0%) | 0 (0.0%) |
| Real Estate, Rental & Leasing | 0 (0.0%) | 0 (0.0%) |
| Professional & Scientific | 0 (0.0%) | 13 (100.0%) |
| Enterprise Management | 0 (0.0%) | 0 (0.0%) |
| Administrative & Support | 0 (0.0%) | 0 (0.0%) |
| Educational Services | 0 (0.0%) | 0 (0.0%) |
| Health Care & Social Assistance | 13 (43.3%) | 17 (56.7%) |
| Arts, Entertainment & Recreation | 0 (0.0%) | 14 (100.0%) |
| Accommodation & Food Services | 0 (0.0%) | 0 (0.0%) |
| Public Administration | 0 (0.0%) | 32 (100.0%) |
| Total | 181 (51.7%) | 169 (48.3%) |
Education in Tuttletown
School Enrollment in Tuttletown
The most common levels of schooling among the 196 students in Tuttletown are elementary school (96 | 49.0%), high school (80 | 40.8%), and kindergarten (14 | 7.1%).
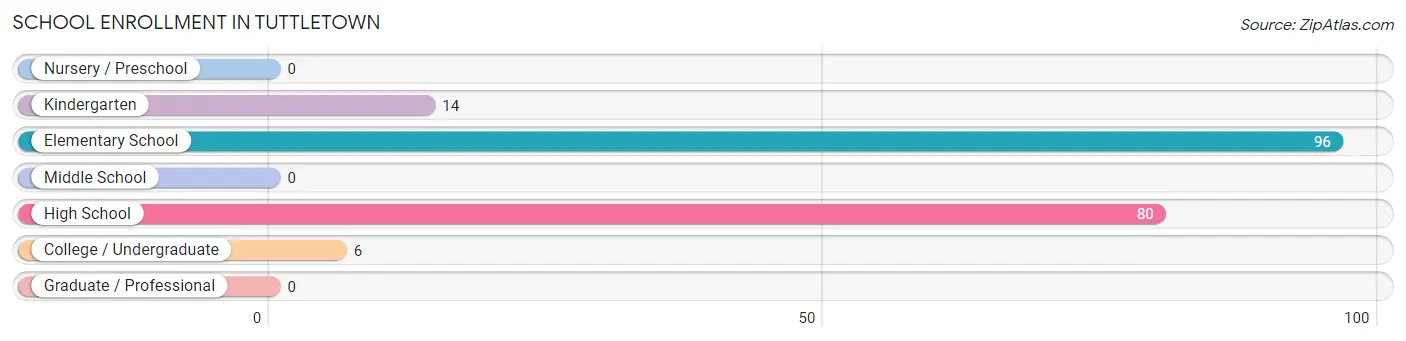
| School Level | # Students | % Students |
| Nursery / Preschool | 0 | 0.0% |
| Kindergarten | 14 | 7.1% |
| Elementary School | 96 | 49.0% |
| Middle School | 0 | 0.0% |
| High School | 80 | 40.8% |
| College / Undergraduate | 6 | 3.1% |
| Graduate / Professional | 0 | 0.0% |
| Total | 196 | 100.0% |
School Enrollment by Age by Funding Source in Tuttletown
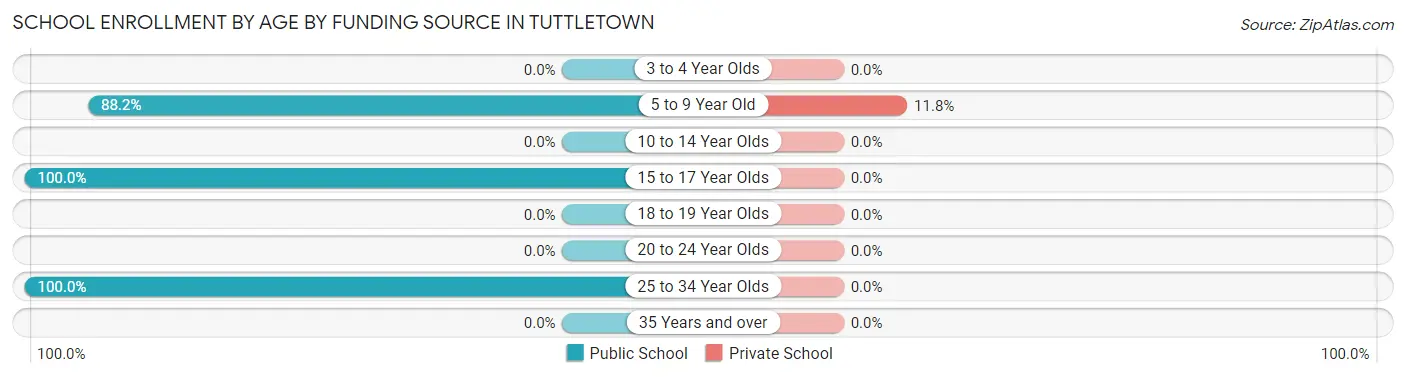
Out of a total of 196 students who are enrolled in schools in Tuttletown, 13 (6.6%) attend a private institution, while the remaining 183 (93.4%) are enrolled in public schools. The age group of 5 to 9 year old has the highest likelihood of being enrolled in private schools, with 13 (11.8% in the age bracket) enrolled. Conversely, the age group of 15 to 17 year olds has the lowest likelihood of being enrolled in a private school, with 80 (100.0% in the age bracket) attending a public institution.
| Age Bracket | Public School | Private School |
| 3 to 4 Year Olds | 0 (0.0%) | 0 (0.0%) |
| 5 to 9 Year Old | 97 (88.2%) | 13 (11.8%) |
| 10 to 14 Year Olds | 0 (0.0%) | 0 (0.0%) |
| 15 to 17 Year Olds | 80 (100.0%) | 0 (0.0%) |
| 18 to 19 Year Olds | 0 (0.0%) | 0 (0.0%) |
| 20 to 24 Year Olds | 0 (0.0%) | 0 (0.0%) |
| 25 to 34 Year Olds | 6 (100.0%) | 0 (0.0%) |
| 35 Years and over | 0 (0.0%) | 0 (0.0%) |
| Total | 183 (93.4%) | 13 (6.6%) |
Educational Attainment by Field of Study in Tuttletown
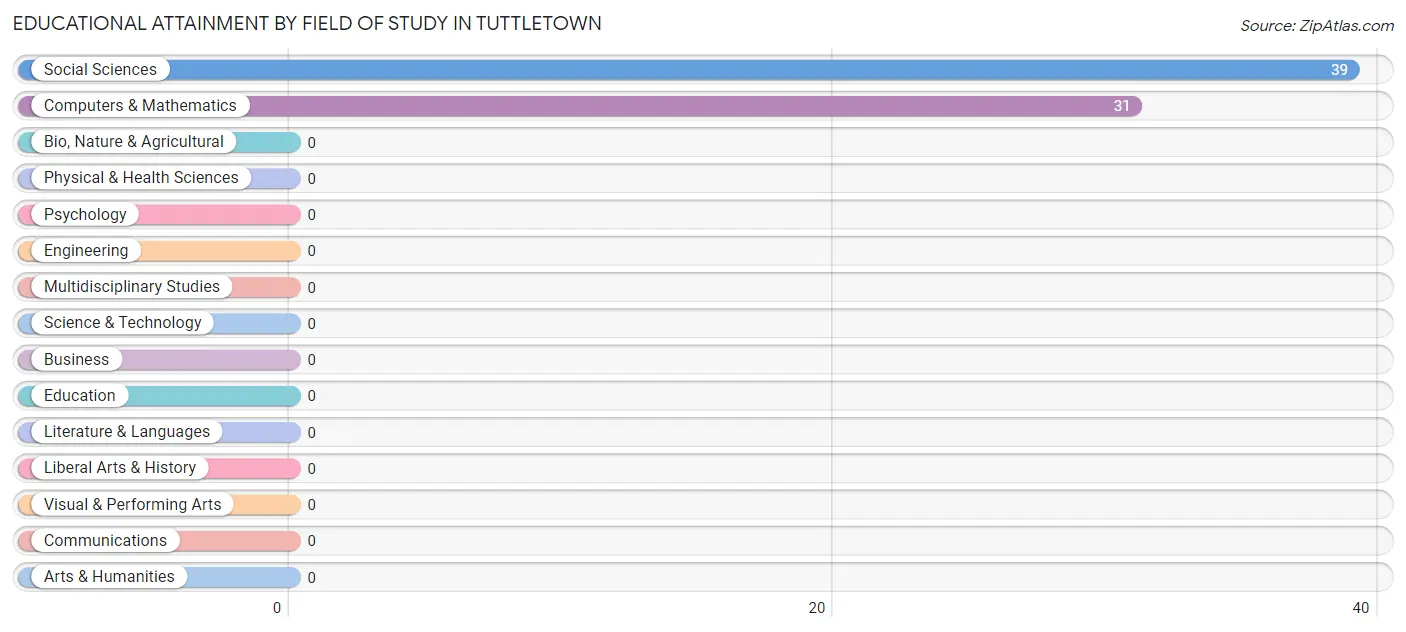
Social sciences (39 | 55.7%), and computers & mathematics (31 | 44.3%) are the most common fields of study among 70 individuals in Tuttletown who have obtained a bachelor's degree or higher.
| Field of Study | # Graduates | % Graduates |
| Computers & Mathematics | 31 | 44.3% |
| Bio, Nature & Agricultural | 0 | 0.0% |
| Physical & Health Sciences | 0 | 0.0% |
| Psychology | 0 | 0.0% |
| Social Sciences | 39 | 55.7% |
| Engineering | 0 | 0.0% |
| Multidisciplinary Studies | 0 | 0.0% |
| Science & Technology | 0 | 0.0% |
| Business | 0 | 0.0% |
| Education | 0 | 0.0% |
| Literature & Languages | 0 | 0.0% |
| Liberal Arts & History | 0 | 0.0% |
| Visual & Performing Arts | 0 | 0.0% |
| Communications | 0 | 0.0% |
| Arts & Humanities | 0 | 0.0% |
| Total | 70 | 100.0% |
Transportation & Commute in Tuttletown
Vehicle Availability by Sex in Tuttletown
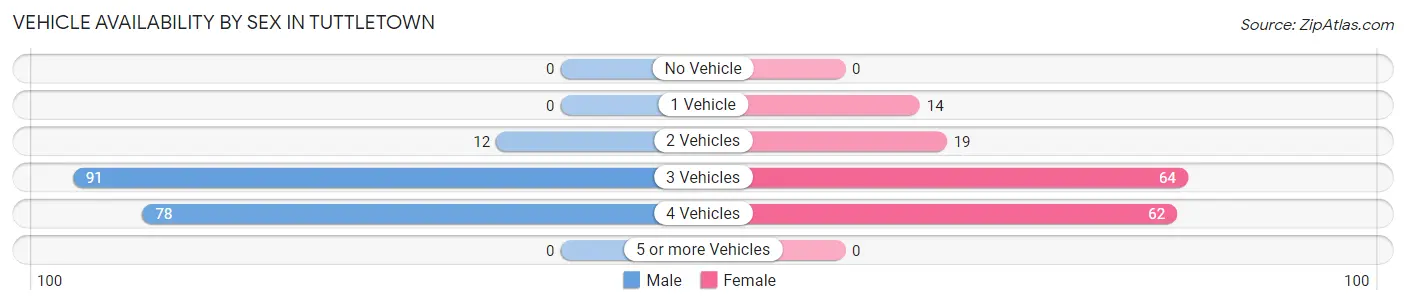
The most prevalent vehicle ownership categories in Tuttletown are males with 3 vehicles (91, accounting for 50.3%) and females with 3 vehicles (64, making up 57.2%).
| Vehicles Available | Male | Female |
| No Vehicle | 0 (0.0%) | 0 (0.0%) |
| 1 Vehicle | 0 (0.0%) | 14 (8.8%) |
| 2 Vehicles | 12 (6.6%) | 19 (11.9%) |
| 3 Vehicles | 91 (50.3%) | 64 (40.3%) |
| 4 Vehicles | 78 (43.1%) | 62 (39.0%) |
| 5 or more Vehicles | 0 (0.0%) | 0 (0.0%) |
| Total | 181 (100.0%) | 159 (100.0%) |
Commute Time in Tuttletown
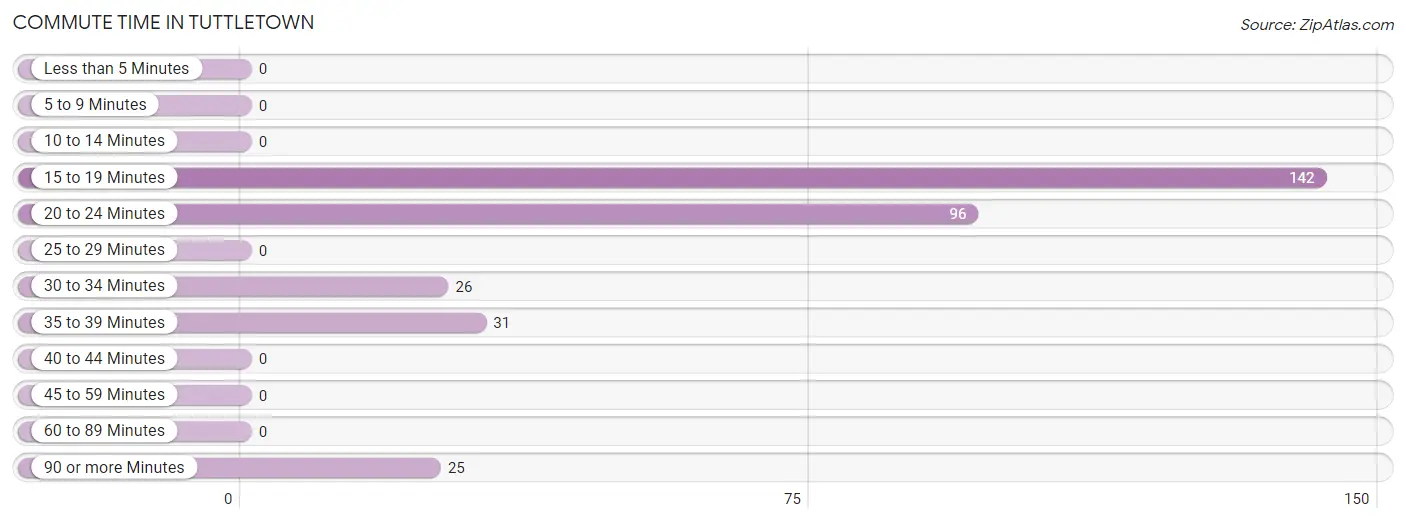
The most frequently occuring commute durations in Tuttletown are 15 to 19 minutes (142 commuters, 44.4%), 20 to 24 minutes (96 commuters, 30.0%), and 35 to 39 minutes (31 commuters, 9.7%).
| Commute Time | # Commuters | % Commuters |
| Less than 5 Minutes | 0 | 0.0% |
| 5 to 9 Minutes | 0 | 0.0% |
| 10 to 14 Minutes | 0 | 0.0% |
| 15 to 19 Minutes | 142 | 44.4% |
| 20 to 24 Minutes | 96 | 30.0% |
| 25 to 29 Minutes | 0 | 0.0% |
| 30 to 34 Minutes | 26 | 8.1% |
| 35 to 39 Minutes | 31 | 9.7% |
| 40 to 44 Minutes | 0 | 0.0% |
| 45 to 59 Minutes | 0 | 0.0% |
| 60 to 89 Minutes | 0 | 0.0% |
| 90 or more Minutes | 25 | 7.8% |
Commute Time by Sex in Tuttletown
The most common commute times in Tuttletown are 20 to 24 minutes (90 commuters, 53.6%) for males and 15 to 19 minutes (89 commuters, 58.6%) for females.
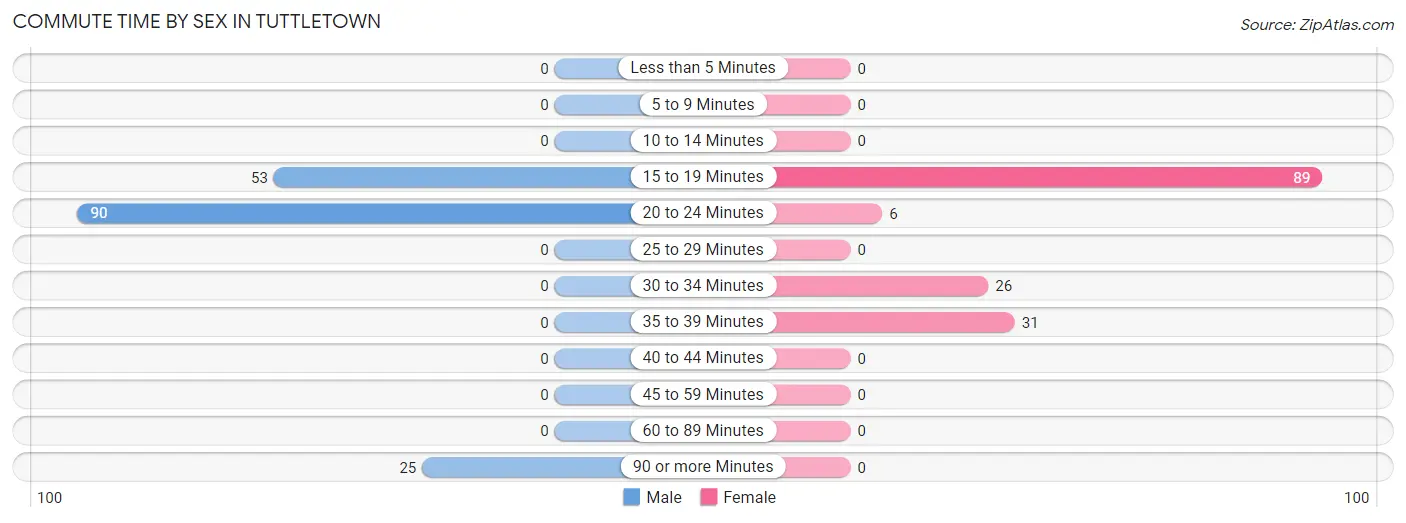
| Commute Time | Male | Female |
| Less than 5 Minutes | 0 (0.0%) | 0 (0.0%) |
| 5 to 9 Minutes | 0 (0.0%) | 0 (0.0%) |
| 10 to 14 Minutes | 0 (0.0%) | 0 (0.0%) |
| 15 to 19 Minutes | 53 (31.6%) | 89 (58.6%) |
| 20 to 24 Minutes | 90 (53.6%) | 6 (4.0%) |
| 25 to 29 Minutes | 0 (0.0%) | 0 (0.0%) |
| 30 to 34 Minutes | 0 (0.0%) | 26 (17.1%) |
| 35 to 39 Minutes | 0 (0.0%) | 31 (20.4%) |
| 40 to 44 Minutes | 0 (0.0%) | 0 (0.0%) |
| 45 to 59 Minutes | 0 (0.0%) | 0 (0.0%) |
| 60 to 89 Minutes | 0 (0.0%) | 0 (0.0%) |
| 90 or more Minutes | 25 (14.9%) | 0 (0.0%) |
Time of Departure to Work by Sex in Tuttletown
The most frequent times of departure to work in Tuttletown are 6:00 AM to 6:29 AM (143, 85.1%) for males and 8:30 AM to 8:59 AM (75, 49.3%) for females.
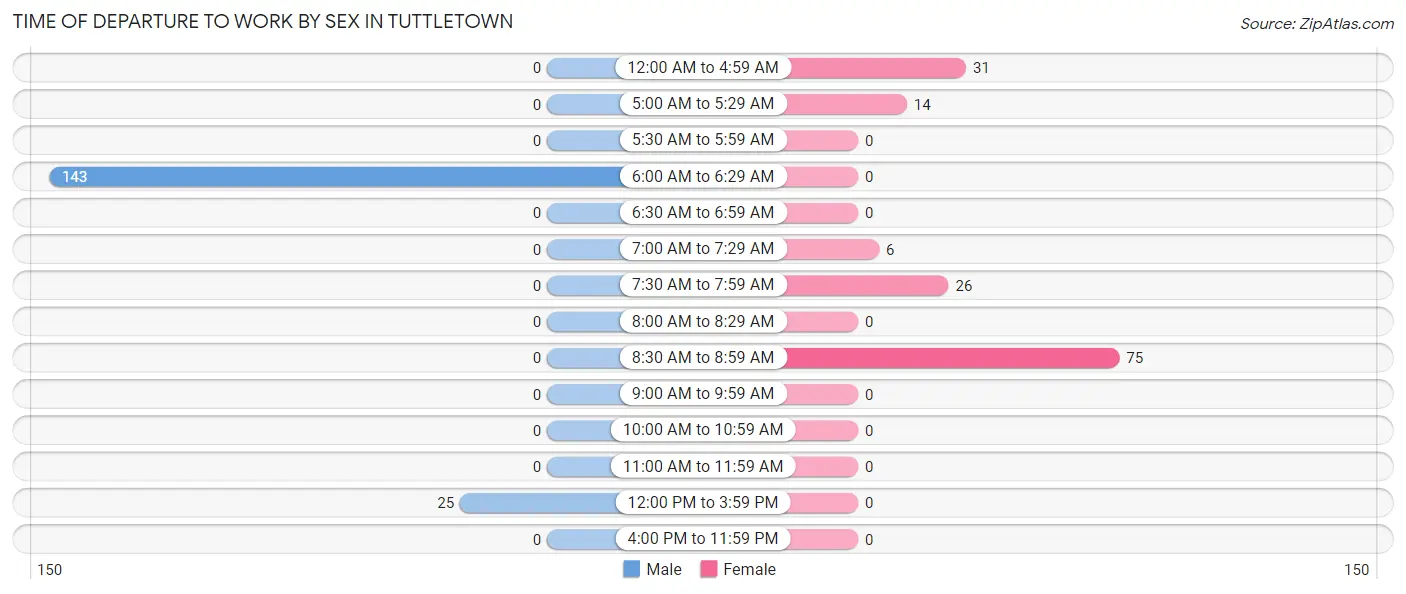
| Time of Departure | Male | Female |
| 12:00 AM to 4:59 AM | 0 (0.0%) | 31 (20.4%) |
| 5:00 AM to 5:29 AM | 0 (0.0%) | 14 (9.2%) |
| 5:30 AM to 5:59 AM | 0 (0.0%) | 0 (0.0%) |
| 6:00 AM to 6:29 AM | 143 (85.1%) | 0 (0.0%) |
| 6:30 AM to 6:59 AM | 0 (0.0%) | 0 (0.0%) |
| 7:00 AM to 7:29 AM | 0 (0.0%) | 6 (4.0%) |
| 7:30 AM to 7:59 AM | 0 (0.0%) | 26 (17.1%) |
| 8:00 AM to 8:29 AM | 0 (0.0%) | 0 (0.0%) |
| 8:30 AM to 8:59 AM | 0 (0.0%) | 75 (49.3%) |
| 9:00 AM to 9:59 AM | 0 (0.0%) | 0 (0.0%) |
| 10:00 AM to 10:59 AM | 0 (0.0%) | 0 (0.0%) |
| 11:00 AM to 11:59 AM | 0 (0.0%) | 0 (0.0%) |
| 12:00 PM to 3:59 PM | 25 (14.9%) | 0 (0.0%) |
| 4:00 PM to 11:59 PM | 0 (0.0%) | 0 (0.0%) |
| Total | 168 (100.0%) | 152 (100.0%) |
Housing Occupancy in Tuttletown
Occupancy by Ownership in Tuttletown
Of the total 268 dwellings in Tuttletown, owner-occupied units account for 162 (60.5%), while renter-occupied units make up 106 (39.6%).
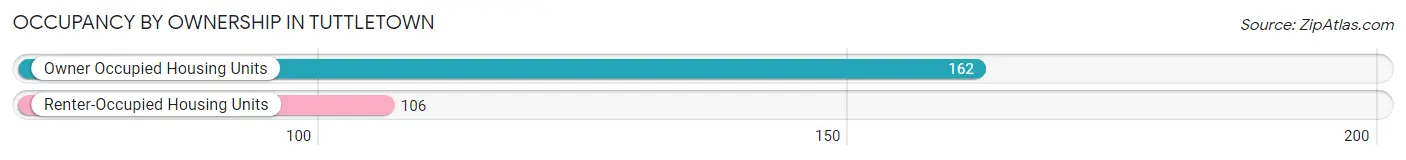
| Occupancy | # Housing Units | % Housing Units |
| Owner Occupied Housing Units | 162 | 60.5% |
| Renter-Occupied Housing Units | 106 | 39.6% |
| Total Occupied Housing Units | 268 | 100.0% |
Occupancy by Household Size in Tuttletown
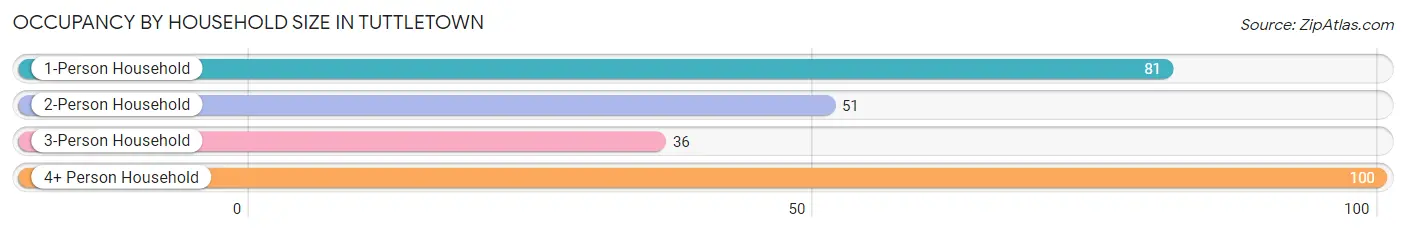
| Household Size | # Housing Units | % Housing Units |
| 1-Person Household | 81 | 30.2% |
| 2-Person Household | 51 | 19.0% |
| 3-Person Household | 36 | 13.4% |
| 4+ Person Household | 100 | 37.3% |
| Total Housing Units | 268 | 100.0% |
Occupancy by Ownership by Household Size in Tuttletown
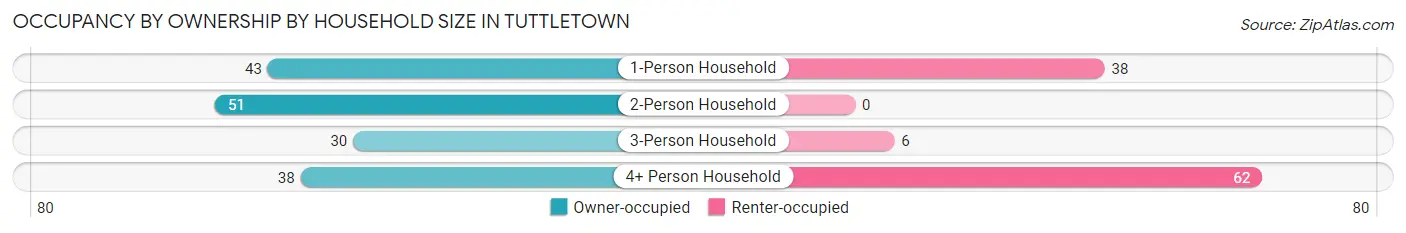
| Household Size | Owner-occupied | Renter-occupied |
| 1-Person Household | 43 (53.1%) | 38 (46.9%) |
| 2-Person Household | 51 (100.0%) | 0 (0.0%) |
| 3-Person Household | 30 (83.3%) | 6 (16.7%) |
| 4+ Person Household | 38 (38.0%) | 62 (62.0%) |
| Total Housing Units | 162 (60.5%) | 106 (39.6%) |
Occupancy by Educational Attainment in Tuttletown
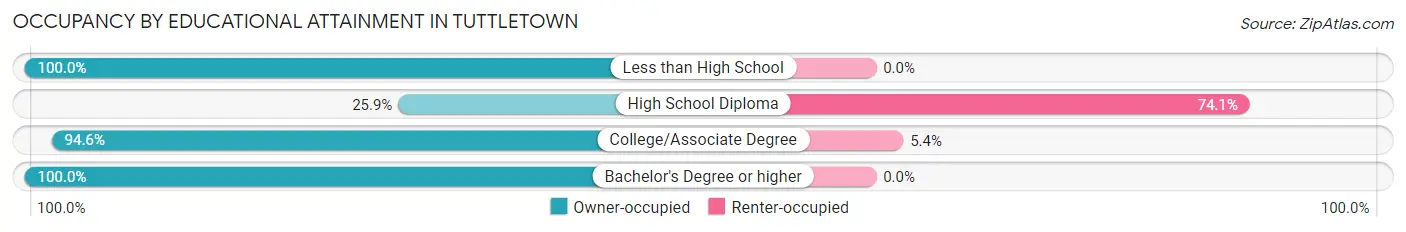
| Household Size | Owner-occupied | Renter-occupied |
| Less than High School | 7 (100.0%) | 0 (0.0%) |
| High School Diploma | 35 (25.9%) | 100 (74.1%) |
| College/Associate Degree | 106 (94.6%) | 6 (5.4%) |
| Bachelor's Degree or higher | 14 (100.0%) | 0 (0.0%) |
Occupancy by Age of Householder in Tuttletown
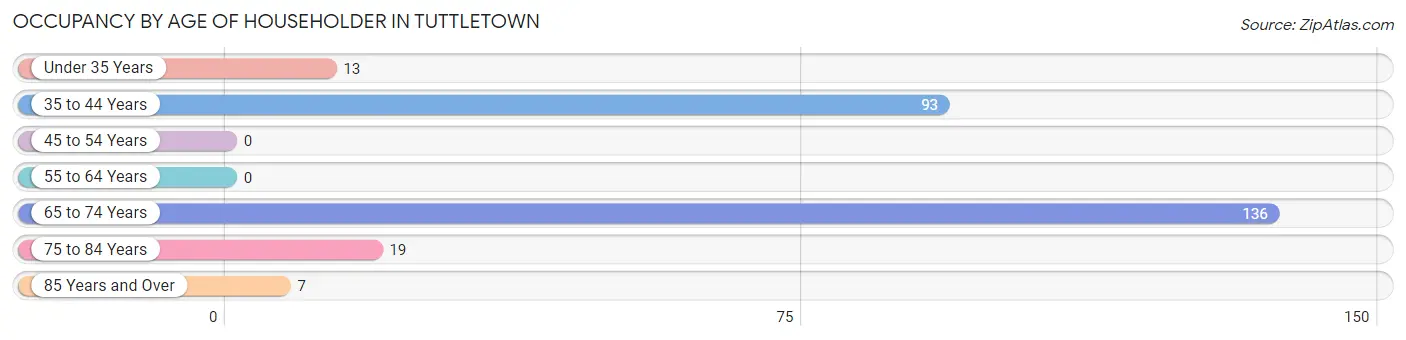
| Age Bracket | # Households | % Households |
| Under 35 Years | 13 | 4.9% |
| 35 to 44 Years | 93 | 34.7% |
| 45 to 54 Years | 0 | 0.0% |
| 55 to 64 Years | 0 | 0.0% |
| 65 to 74 Years | 136 | 50.7% |
| 75 to 84 Years | 19 | 7.1% |
| 85 Years and Over | 7 | 2.6% |
| Total | 268 | 100.0% |
Housing Finances in Tuttletown
Median Income by Occupancy in Tuttletown
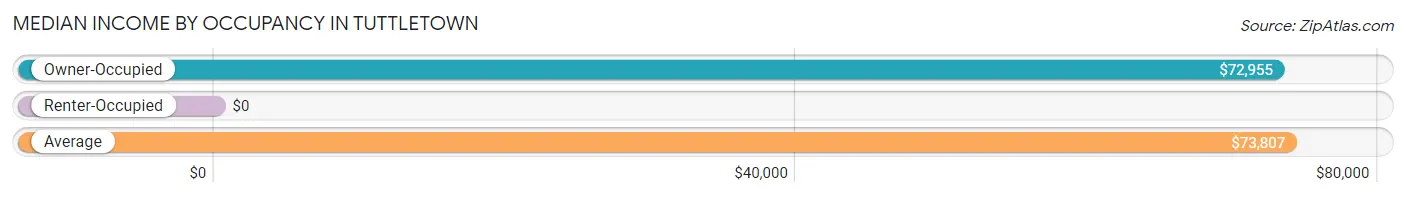
| Occupancy Type | # Households | Median Income |
| Owner-Occupied | 162 (60.5%) | $72,955 |
| Renter-Occupied | 106 (39.6%) | $0 |
| Average | 268 (100.0%) | $73,807 |
Occupancy by Householder Income Bracket in Tuttletown
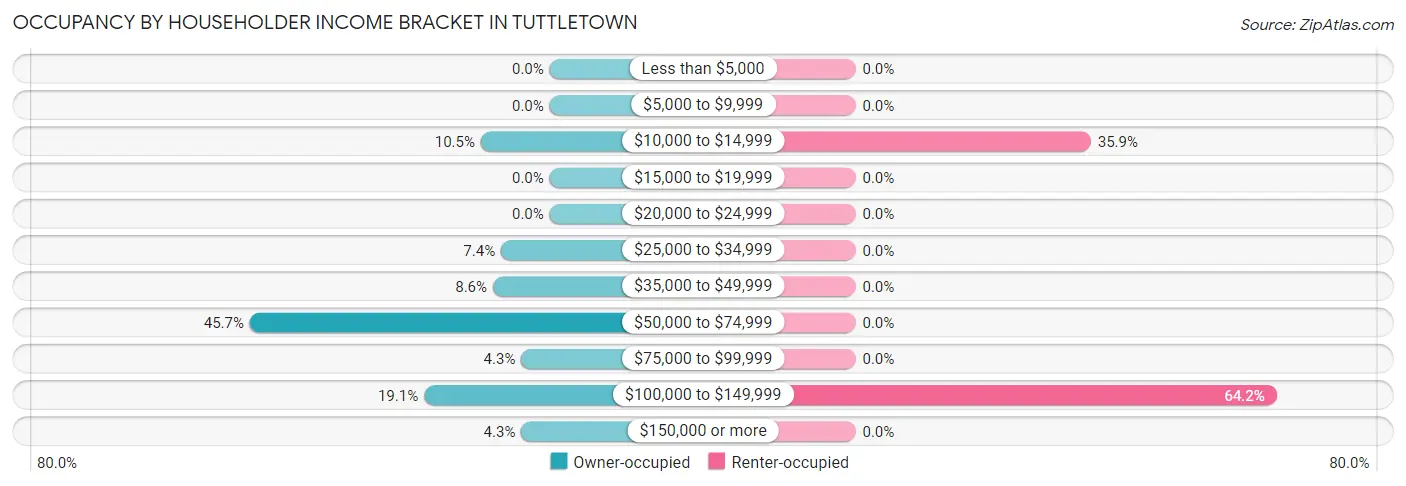
| Income Bracket | Owner-occupied | Renter-occupied |
| Less than $5,000 | 0 (0.0%) | 0 (0.0%) |
| $5,000 to $9,999 | 0 (0.0%) | 0 (0.0%) |
| $10,000 to $14,999 | 17 (10.5%) | 38 (35.8%) |
| $15,000 to $19,999 | 0 (0.0%) | 0 (0.0%) |
| $20,000 to $24,999 | 0 (0.0%) | 0 (0.0%) |
| $25,000 to $34,999 | 12 (7.4%) | 0 (0.0%) |
| $35,000 to $49,999 | 14 (8.6%) | 0 (0.0%) |
| $50,000 to $74,999 | 74 (45.7%) | 0 (0.0%) |
| $75,000 to $99,999 | 7 (4.3%) | 0 (0.0%) |
| $100,000 to $149,999 | 31 (19.1%) | 68 (64.1%) |
| $150,000 or more | 7 (4.3%) | 0 (0.0%) |
| Total | 162 (100.0%) | 106 (100.0%) |
Monthly Housing Cost Tiers in Tuttletown
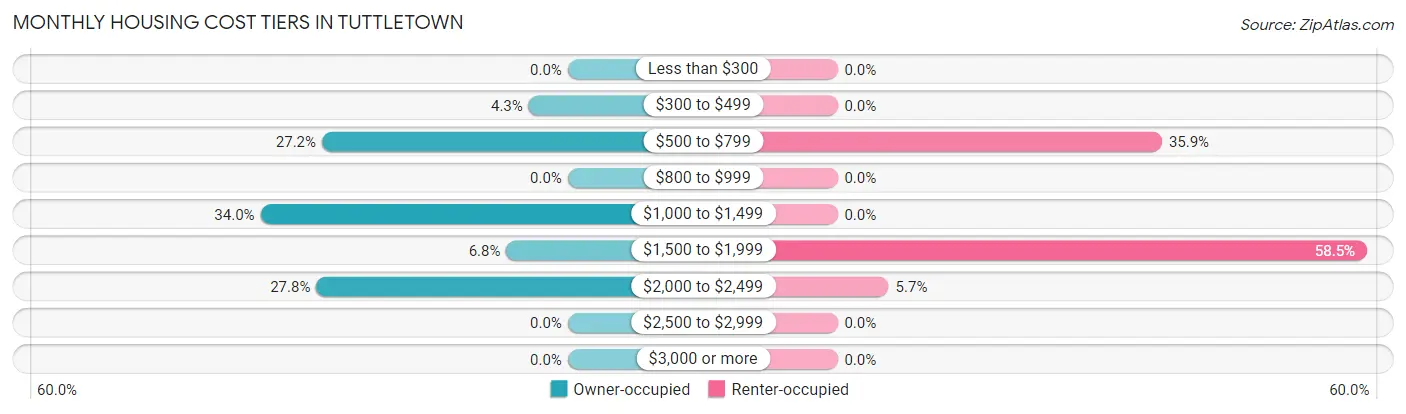
| Monthly Cost | Owner-occupied | Renter-occupied |
| Less than $300 | 0 (0.0%) | 0 (0.0%) |
| $300 to $499 | 7 (4.3%) | 0 (0.0%) |
| $500 to $799 | 44 (27.2%) | 38 (35.8%) |
| $800 to $999 | 0 (0.0%) | 0 (0.0%) |
| $1,000 to $1,499 | 55 (34.0%) | 0 (0.0%) |
| $1,500 to $1,999 | 11 (6.8%) | 62 (58.5%) |
| $2,000 to $2,499 | 45 (27.8%) | 6 (5.7%) |
| $2,500 to $2,999 | 0 (0.0%) | 0 (0.0%) |
| $3,000 or more | 0 (0.0%) | 0 (0.0%) |
| Total | 162 (100.0%) | 106 (100.0%) |
Physical Housing Characteristics in Tuttletown
Housing Structures in Tuttletown
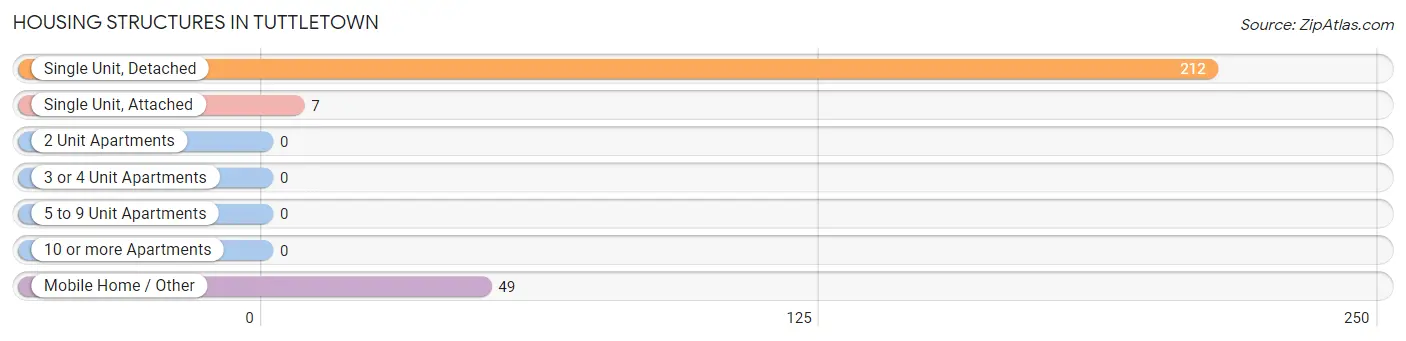
| Structure Type | # Housing Units | % Housing Units |
| Single Unit, Detached | 212 | 79.1% |
| Single Unit, Attached | 7 | 2.6% |
| 2 Unit Apartments | 0 | 0.0% |
| 3 or 4 Unit Apartments | 0 | 0.0% |
| 5 to 9 Unit Apartments | 0 | 0.0% |
| 10 or more Apartments | 0 | 0.0% |
| Mobile Home / Other | 49 | 18.3% |
| Total | 268 | 100.0% |
Housing Structures by Occupancy in Tuttletown
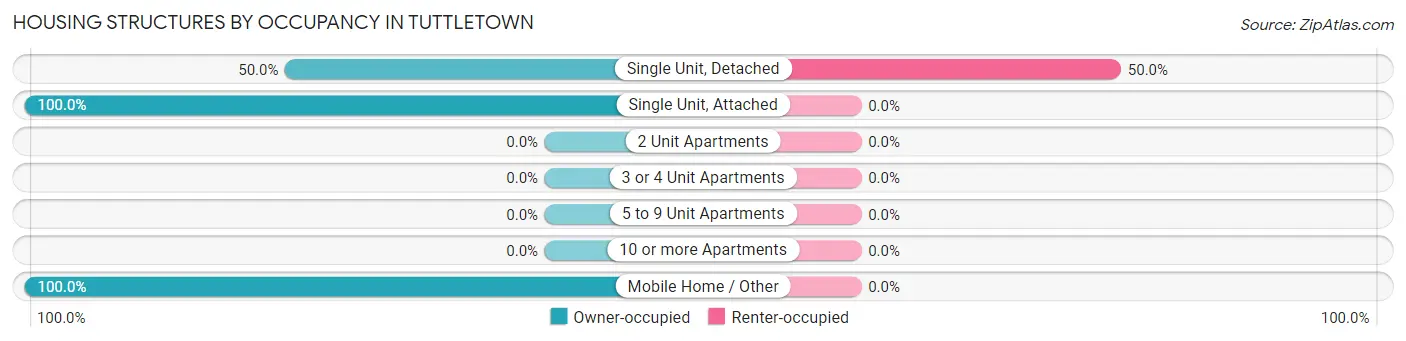
| Structure Type | Owner-occupied | Renter-occupied |
| Single Unit, Detached | 106 (50.0%) | 106 (50.0%) |
| Single Unit, Attached | 7 (100.0%) | 0 (0.0%) |
| 2 Unit Apartments | 0 (0.0%) | 0 (0.0%) |
| 3 or 4 Unit Apartments | 0 (0.0%) | 0 (0.0%) |
| 5 to 9 Unit Apartments | 0 (0.0%) | 0 (0.0%) |
| 10 or more Apartments | 0 (0.0%) | 0 (0.0%) |
| Mobile Home / Other | 49 (100.0%) | 0 (0.0%) |
| Total | 162 (60.5%) | 106 (39.6%) |
Housing Structures by Number of Rooms in Tuttletown
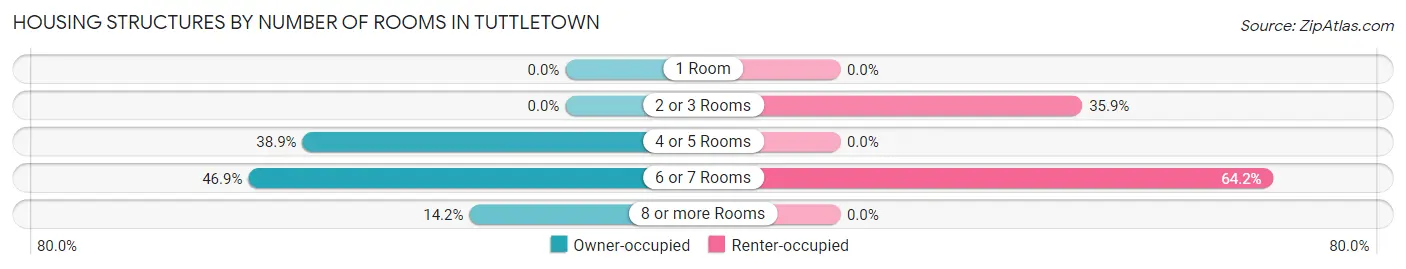
| Number of Rooms | Owner-occupied | Renter-occupied |
| 1 Room | 0 (0.0%) | 0 (0.0%) |
| 2 or 3 Rooms | 0 (0.0%) | 38 (35.8%) |
| 4 or 5 Rooms | 63 (38.9%) | 0 (0.0%) |
| 6 or 7 Rooms | 76 (46.9%) | 68 (64.1%) |
| 8 or more Rooms | 23 (14.2%) | 0 (0.0%) |
| Total | 162 (100.0%) | 106 (100.0%) |
Housing Structure by Heating Type in Tuttletown
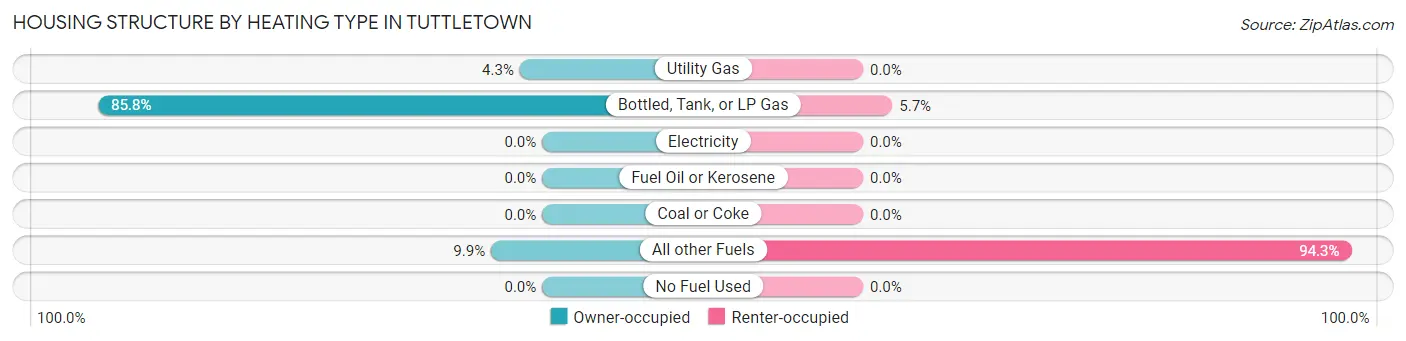
| Heating Type | Owner-occupied | Renter-occupied |
| Utility Gas | 7 (4.3%) | 0 (0.0%) |
| Bottled, Tank, or LP Gas | 139 (85.8%) | 6 (5.7%) |
| Electricity | 0 (0.0%) | 0 (0.0%) |
| Fuel Oil or Kerosene | 0 (0.0%) | 0 (0.0%) |
| Coal or Coke | 0 (0.0%) | 0 (0.0%) |
| All other Fuels | 16 (9.9%) | 100 (94.3%) |
| No Fuel Used | 0 (0.0%) | 0 (0.0%) |
| Total | 162 (100.0%) | 106 (100.0%) |
Household Vehicle Usage in Tuttletown
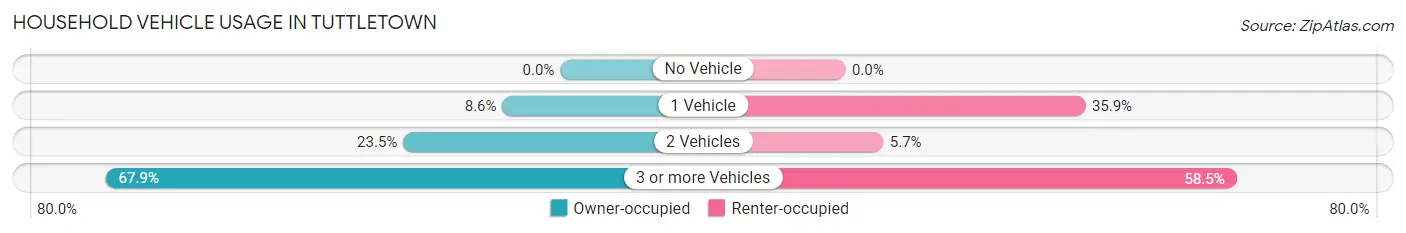
| Vehicles per Household | Owner-occupied | Renter-occupied |
| No Vehicle | 0 (0.0%) | 0 (0.0%) |
| 1 Vehicle | 14 (8.6%) | 38 (35.8%) |
| 2 Vehicles | 38 (23.5%) | 6 (5.7%) |
| 3 or more Vehicles | 110 (67.9%) | 62 (58.5%) |
| Total | 162 (100.0%) | 106 (100.0%) |
Real Estate & Mortgages in Tuttletown
Real Estate and Mortgage Overview in Tuttletown
| Characteristic | Without Mortgage | With Mortgage |
| Housing Units | 58 | 104 |
| Median Property Value | $403,300 | $352,300 |
| Median Household Income | $62,344 | $0 |
| Monthly Housing Costs | $573 | $0 |
| Real Estate Taxes | $1,314 | $11 |
Property Value by Mortgage Status in Tuttletown
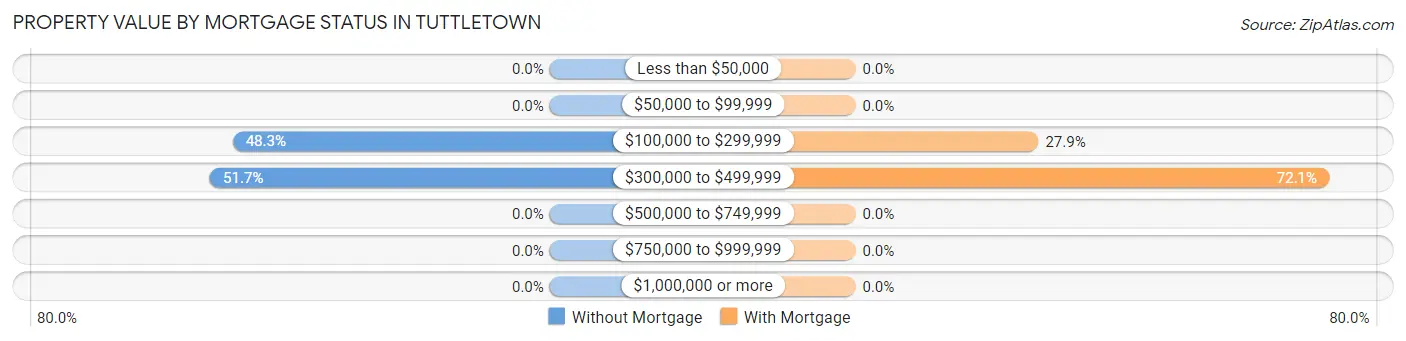
| Property Value | Without Mortgage | With Mortgage |
| Less than $50,000 | 0 (0.0%) | 0 (0.0%) |
| $50,000 to $99,999 | 0 (0.0%) | 0 (0.0%) |
| $100,000 to $299,999 | 28 (48.3%) | 29 (27.9%) |
| $300,000 to $499,999 | 30 (51.7%) | 75 (72.1%) |
| $500,000 to $749,999 | 0 (0.0%) | 0 (0.0%) |
| $750,000 to $999,999 | 0 (0.0%) | 0 (0.0%) |
| $1,000,000 or more | 0 (0.0%) | 0 (0.0%) |
| Total | 58 (100.0%) | 104 (100.0%) |
Household Income by Mortgage Status in Tuttletown
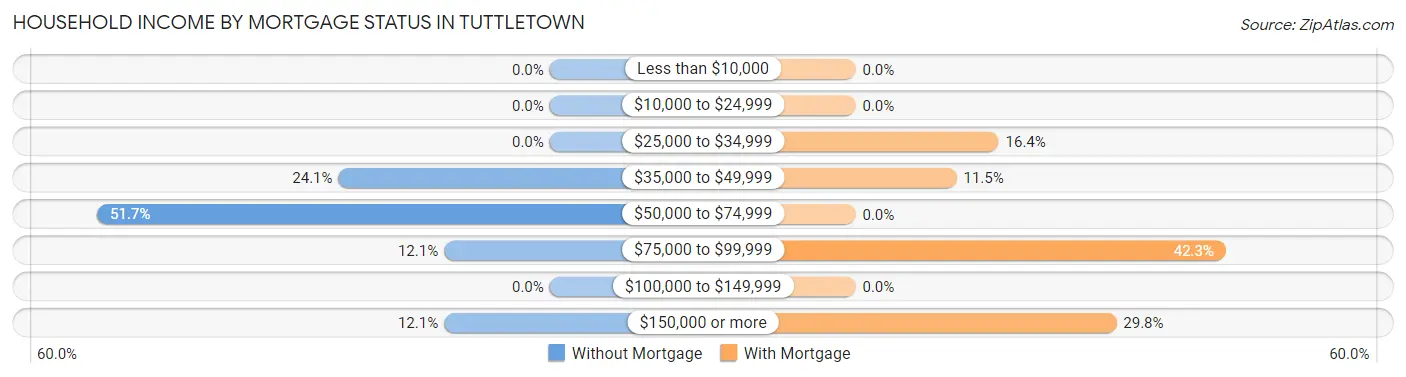
| Household Income | Without Mortgage | With Mortgage |
| Less than $10,000 | 0 (0.0%) | 0 (0.0%) |
| $10,000 to $24,999 | 0 (0.0%) | 0 (0.0%) |
| $25,000 to $34,999 | 0 (0.0%) | 17 (16.4%) |
| $35,000 to $49,999 | 14 (24.1%) | 12 (11.5%) |
| $50,000 to $74,999 | 30 (51.7%) | 0 (0.0%) |
| $75,000 to $99,999 | 7 (12.1%) | 44 (42.3%) |
| $100,000 to $149,999 | 0 (0.0%) | 0 (0.0%) |
| $150,000 or more | 7 (12.1%) | 31 (29.8%) |
| Total | 58 (100.0%) | 104 (100.0%) |
Property Value to Household Income Ratio in Tuttletown
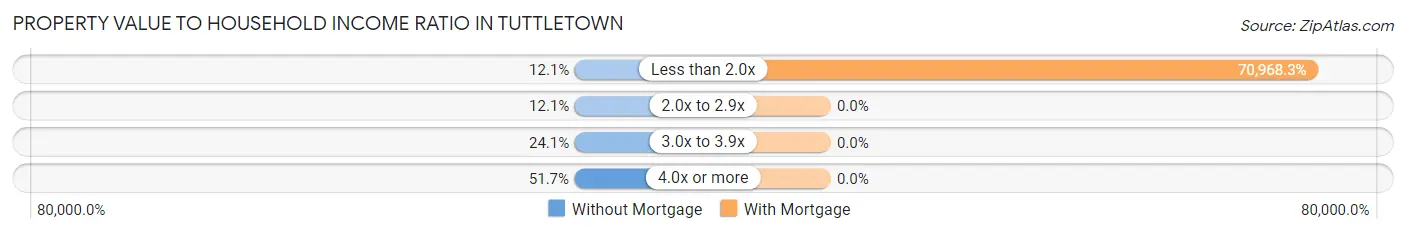
| Value-to-Income Ratio | Without Mortgage | With Mortgage |
| Less than 2.0x | 7 (12.1%) | 73,807 (70,968.3%) |
| 2.0x to 2.9x | 7 (12.1%) | 0 (0.0%) |
| 3.0x to 3.9x | 14 (24.1%) | 0 (0.0%) |
| 4.0x or more | 30 (51.7%) | 0 (0.0%) |
| Total | 58 (100.0%) | 104 (100.0%) |
Real Estate Taxes by Mortgage Status in Tuttletown
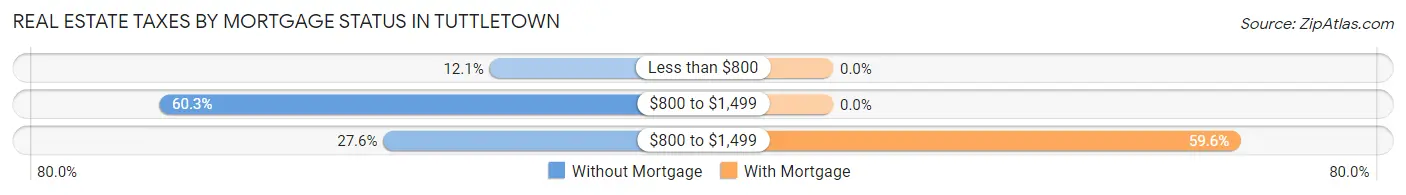
| Property Taxes | Without Mortgage | With Mortgage |
| Less than $800 | 7 (12.1%) | 0 (0.0%) |
| $800 to $1,499 | 35 (60.3%) | 0 (0.0%) |
| $800 to $1,499 | 16 (27.6%) | 62 (59.6%) |
| Total | 58 (100.0%) | 104 (100.0%) |
Health & Disability in Tuttletown
Health Insurance Coverage by Age in Tuttletown
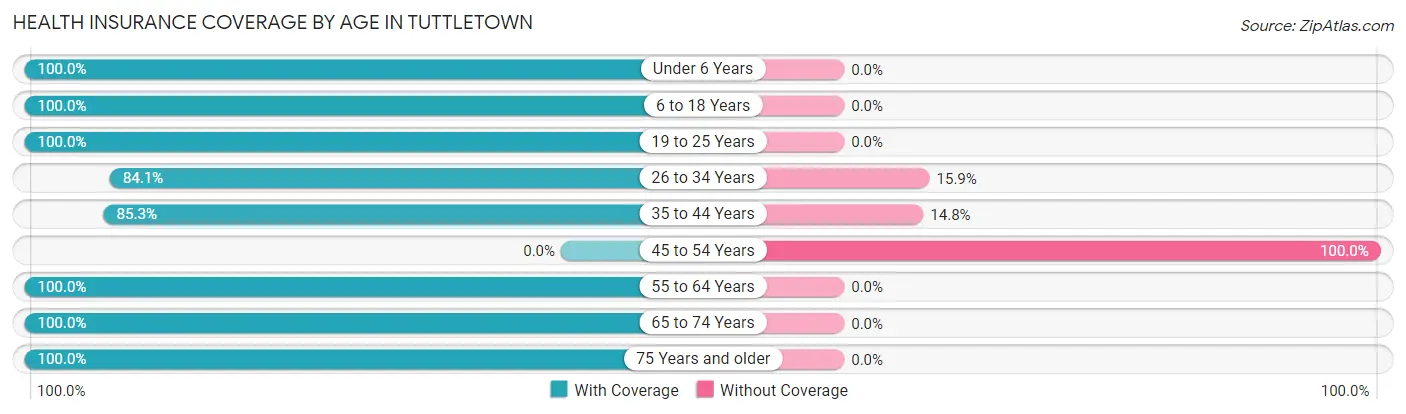
| Age Bracket | With Coverage | Without Coverage |
| Under 6 Years | 21 (100.0%) | 0 (0.0%) |
| 6 to 18 Years | 176 (100.0%) | 0 (0.0%) |
| 19 to 25 Years | 78 (100.0%) | 0 (0.0%) |
| 26 to 34 Years | 37 (84.1%) | 7 (15.9%) |
| 35 to 44 Years | 208 (85.3%) | 36 (14.7%) |
| 45 to 54 Years | 0 (0.0%) | 13 (100.0%) |
| 55 to 64 Years | 70 (100.0%) | 0 (0.0%) |
| 65 to 74 Years | 254 (100.0%) | 0 (0.0%) |
| 75 Years and older | 46 (100.0%) | 0 (0.0%) |
| Total | 890 (94.1%) | 56 (5.9%) |
Health Insurance Coverage by Citizenship Status in Tuttletown
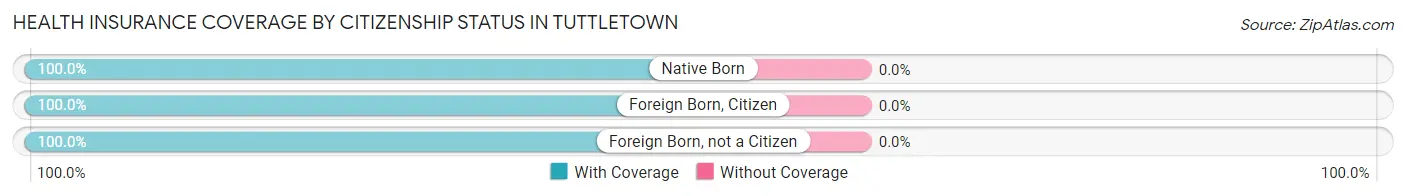
| Citizenship Status | With Coverage | Without Coverage |
| Native Born | 21 (100.0%) | 0 (0.0%) |
| Foreign Born, Citizen | 176 (100.0%) | 0 (0.0%) |
| Foreign Born, not a Citizen | 78 (100.0%) | 0 (0.0%) |
Health Insurance Coverage by Household Income in Tuttletown
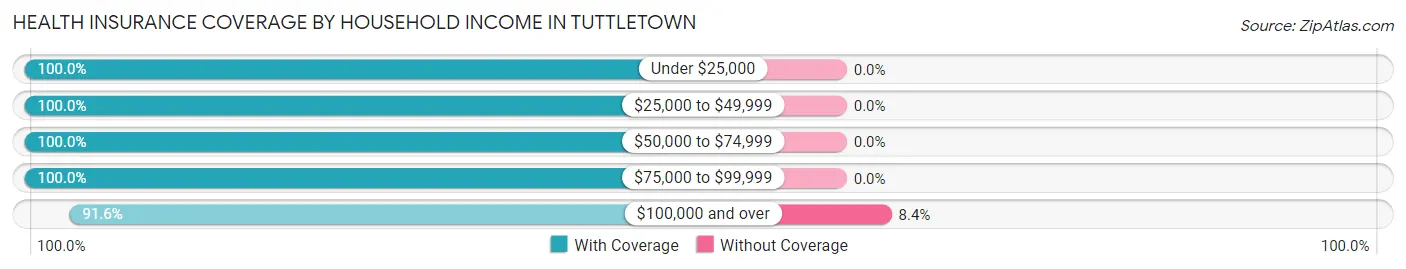
| Household Income | With Coverage | Without Coverage |
| Under $25,000 | 55 (100.0%) | 0 (0.0%) |
| $25,000 to $49,999 | 39 (100.0%) | 0 (0.0%) |
| $50,000 to $74,999 | 171 (100.0%) | 0 (0.0%) |
| $75,000 to $99,999 | 14 (100.0%) | 0 (0.0%) |
| $100,000 and over | 611 (91.6%) | 56 (8.4%) |
Public vs Private Health Insurance Coverage by Age in Tuttletown
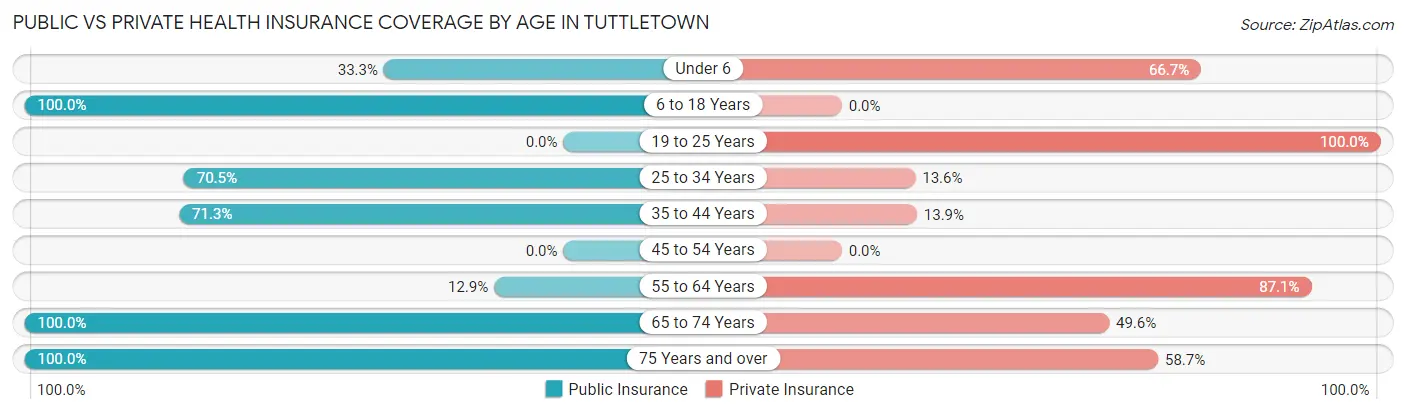
| Age Bracket | Public Insurance | Private Insurance |
| Under 6 | 7 (33.3%) | 14 (66.7%) |
| 6 to 18 Years | 176 (100.0%) | 0 (0.0%) |
| 19 to 25 Years | 0 (0.0%) | 78 (100.0%) |
| 25 to 34 Years | 31 (70.5%) | 6 (13.6%) |
| 35 to 44 Years | 174 (71.3%) | 34 (13.9%) |
| 45 to 54 Years | 0 (0.0%) | 0 (0.0%) |
| 55 to 64 Years | 9 (12.9%) | 61 (87.1%) |
| 65 to 74 Years | 254 (100.0%) | 126 (49.6%) |
| 75 Years and over | 46 (100.0%) | 27 (58.7%) |
| Total | 697 (73.7%) | 346 (36.6%) |
Disability Status by Sex by Age in Tuttletown
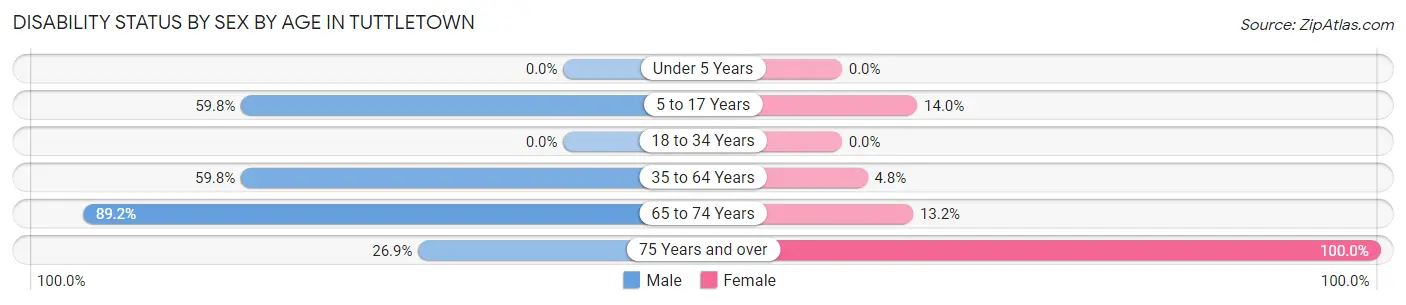
| Age Bracket | Male | Female |
| Under 5 Years | 0 (0.0%) | 0 (0.0%) |
| 5 to 17 Years | 58 (59.8%) | 13 (14.0%) |
| 18 to 34 Years | 0 (0.0%) | 0 (0.0%) |
| 35 to 64 Years | 70 (59.8%) | 10 (4.8%) |
| 65 to 74 Years | 132 (89.2%) | 14 (13.2%) |
| 75 Years and over | 7 (26.9%) | 20 (100.0%) |
Disability Class by Sex by Age in Tuttletown
Disability Class: Hearing Difficulty
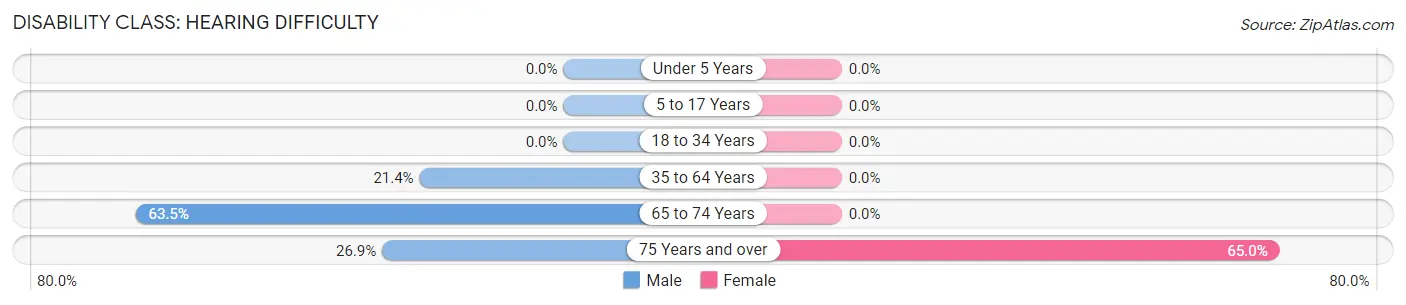
| Age Bracket | Male | Female |
| Under 5 Years | 0 (0.0%) | 0 (0.0%) |
| 5 to 17 Years | 0 (0.0%) | 0 (0.0%) |
| 18 to 34 Years | 0 (0.0%) | 0 (0.0%) |
| 35 to 64 Years | 25 (21.4%) | 0 (0.0%) |
| 65 to 74 Years | 94 (63.5%) | 0 (0.0%) |
| 75 Years and over | 7 (26.9%) | 13 (65.0%) |
Disability Class: Vision Difficulty
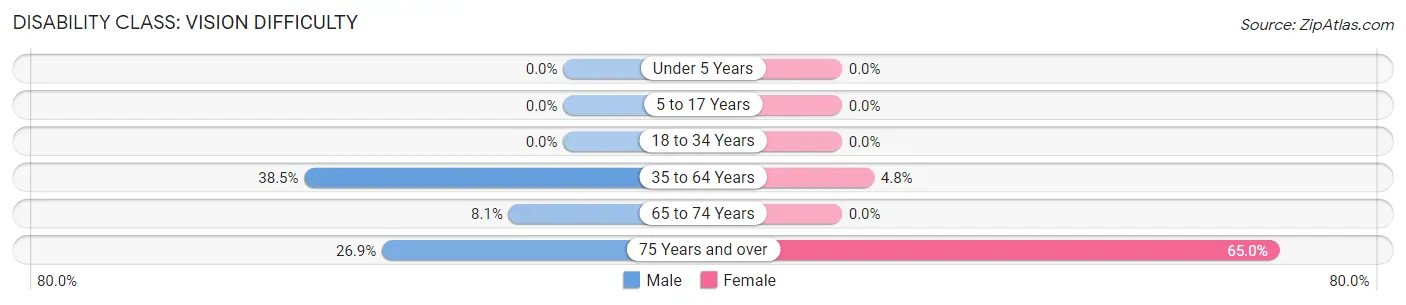
| Age Bracket | Male | Female |
| Under 5 Years | 0 (0.0%) | 0 (0.0%) |
| 5 to 17 Years | 0 (0.0%) | 0 (0.0%) |
| 18 to 34 Years | 0 (0.0%) | 0 (0.0%) |
| 35 to 64 Years | 45 (38.5%) | 10 (4.8%) |
| 65 to 74 Years | 12 (8.1%) | 0 (0.0%) |
| 75 Years and over | 7 (26.9%) | 13 (65.0%) |
Disability Class: Cognitive Difficulty
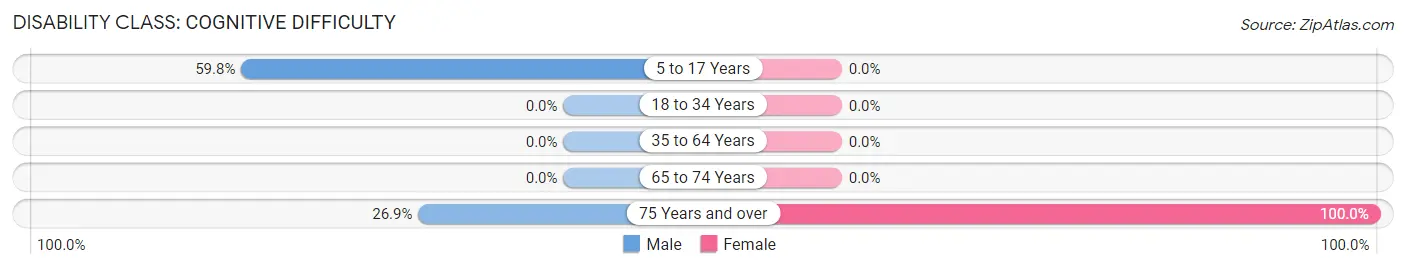
| Age Bracket | Male | Female |
| 5 to 17 Years | 58 (59.8%) | 0 (0.0%) |
| 18 to 34 Years | 0 (0.0%) | 0 (0.0%) |
| 35 to 64 Years | 0 (0.0%) | 0 (0.0%) |
| 65 to 74 Years | 0 (0.0%) | 0 (0.0%) |
| 75 Years and over | 7 (26.9%) | 20 (100.0%) |
Disability Class: Ambulatory Difficulty
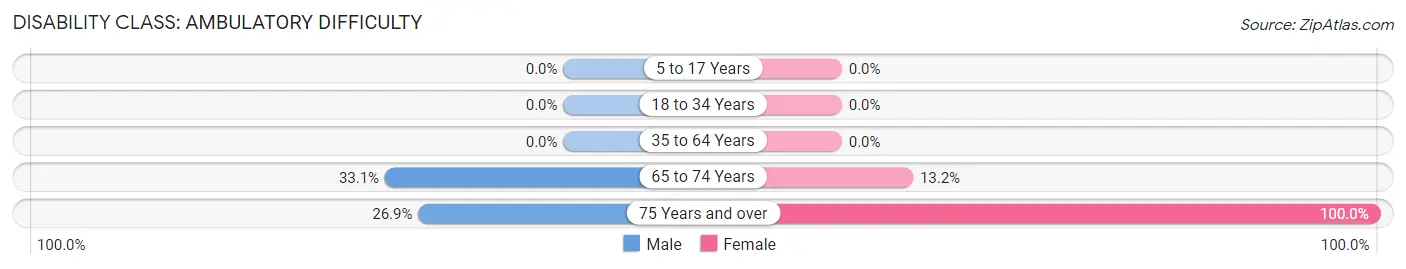
| Age Bracket | Male | Female |
| 5 to 17 Years | 0 (0.0%) | 0 (0.0%) |
| 18 to 34 Years | 0 (0.0%) | 0 (0.0%) |
| 35 to 64 Years | 0 (0.0%) | 0 (0.0%) |
| 65 to 74 Years | 49 (33.1%) | 14 (13.2%) |
| 75 Years and over | 7 (26.9%) | 20 (100.0%) |
Disability Class: Self-Care Difficulty
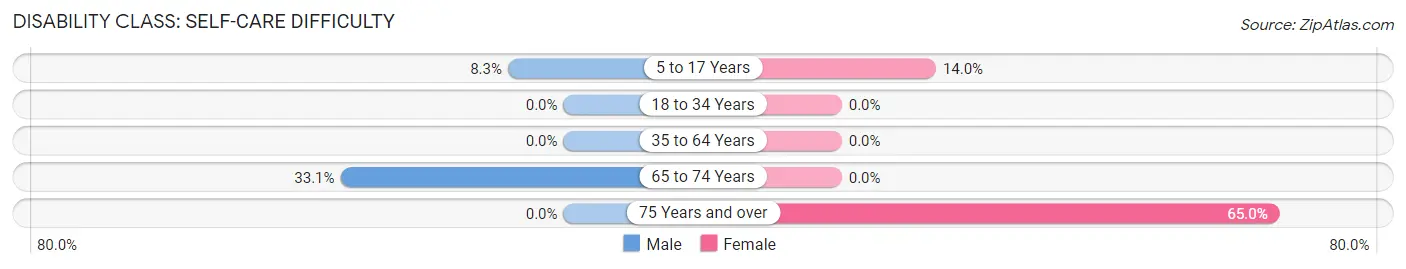
| Age Bracket | Male | Female |
| 5 to 17 Years | 8 (8.3%) | 13 (14.0%) |
| 18 to 34 Years | 0 (0.0%) | 0 (0.0%) |
| 35 to 64 Years | 0 (0.0%) | 0 (0.0%) |
| 65 to 74 Years | 49 (33.1%) | 0 (0.0%) |
| 75 Years and over | 0 (0.0%) | 13 (65.0%) |
Technology Access in Tuttletown
Computing Device Access in Tuttletown
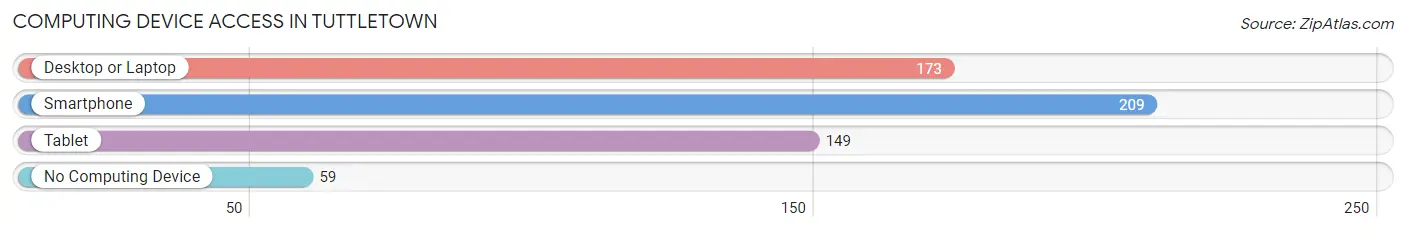
| Device Type | # Households | % Households |
| Desktop or Laptop | 173 | 64.5% |
| Smartphone | 209 | 78.0% |
| Tablet | 149 | 55.6% |
| No Computing Device | 59 | 22.0% |
| Total | 268 | 100.0% |
Internet Access in Tuttletown
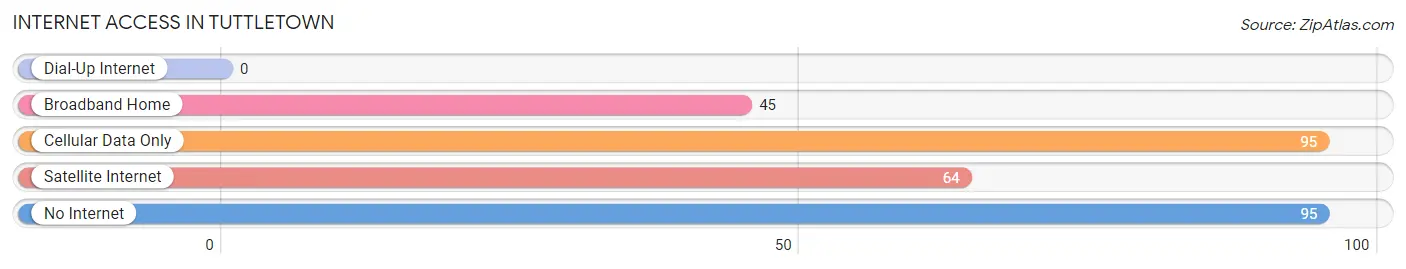
| Internet Type | # Households | % Households |
| Dial-Up Internet | 0 | 0.0% |
| Broadband Home | 45 | 16.8% |
| Cellular Data Only | 95 | 35.4% |
| Satellite Internet | 64 | 23.9% |
| No Internet | 95 | 35.4% |
| Total | 268 | 100.0% |
Tuttletown Summary
Tuttletown is a small unincorporated community located in Calaveras County, California. It is situated in the Sierra Nevada foothills, approximately 8 miles east of Angels Camp and 8 miles west of Copperopolis. The population of Tuttletown was estimated to be around 1,000 in 2020.
History
Tuttletown was founded in 1849 by William Tutt, a miner from Missouri. He named the town after himself and it quickly became a popular destination for miners and prospectors. The town was home to several saloons, stores, and a post office. In 1851, Tuttletown was the site of the first county fair in Calaveras County.
In the late 1800s, Tuttletown was a thriving community with a population of over 1,000 people. It was home to several businesses, including a hotel, a blacksmith shop, a livery stable, and a general store. The town also had a school, a church, and a cemetery.
Geography
Tuttletown is located in the Sierra Nevada foothills, approximately 8 miles east of Angels Camp and 8 miles west of Copperopolis. The town is situated at an elevation of 1,890 feet and is surrounded by rolling hills and oak woodlands. The climate is mild and dry, with hot summers and cool winters.
Economy
Tuttletown’s economy is largely based on tourism and agriculture. The town is home to several wineries, including the Tuttletown Winery, which produces award-winning wines. The town also has several restaurants, shops, and lodging options.
Agriculture is also an important part of the local economy. The area is known for its production of walnuts, almonds, and other tree nuts. Livestock production is also common in the area, with cattle, sheep, and goats being raised in the surrounding hills.
Demographics
Tuttletown’s population was estimated to be around 1,000 in 2020. The town is predominantly white, with a small Hispanic population. The median household income is around $50,000, and the median home value is around $250,000.
Tuttletown is a small, rural community with a rich history and a vibrant economy. It is a great place to live, work, and raise a family. The town is surrounded by beautiful scenery and offers a variety of activities for residents and visitors alike.
Common Questions
What is Per Capita Income in Tuttletown?
Per Capita income in Tuttletown is $23,116.
What is the Median Family Income in Tuttletown?
Median Family Income in Tuttletown is $74,042.
What is the Median Household income in Tuttletown?
Median Household Income in Tuttletown is $73,807.
What is Income or Wage Gap in Tuttletown?
Income or Wage Gap in Tuttletown is 67.3%.
Women in Tuttletown earn 32.7 cents for every dollar earned by a man.
What is Inequality or Gini Index in Tuttletown?
Inequality or Gini Index in Tuttletown is 0.32.
What is the Total Population of Tuttletown?
Total Population of Tuttletown is 946.
What is the Total Male Population of Tuttletown?
Total Male Population of Tuttletown is 504.
What is the Total Female Population of Tuttletown?
Total Female Population of Tuttletown is 442.
What is the Ratio of Males per 100 Females in Tuttletown?
There are 114.03 Males per 100 Females in Tuttletown.
What is the Ratio of Females per 100 Males in Tuttletown?
There are 87.70 Females per 100 Males in Tuttletown.
What is the Median Population Age in Tuttletown?
Median Population Age in Tuttletown is 38.7 Years.
What is the Average Family Size in Tuttletown
Average Family Size in Tuttletown is 3.8 People.
What is the Average Household Size in Tuttletown
Average Household Size in Tuttletown is 3.5 People.
How Large is the Labor Force in Tuttletown?
There are 386 People in the Labor Forcein in Tuttletown.
What is the Percentage of People in the Labor Force in Tuttletown?
46.6% of People are in the Labor Force in Tuttletown.
What is the Unemployment Rate in Tuttletown?
Unemployment Rate in Tuttletown is 9.3%.