Cities with the Highest Percentage of Population with a Degree in Computers and Mathematics in New Hampshire

RELATED REPORTS & OPTIONS

Computers and Mathematics
Population
Families and Households
Female Fertility
Female Fertility (Unmarried)
Race (Community Size)
Race (Percentage)
Ancestry (Community Size)
AfghanAfricanAlaska NativeAlaskan AthabascanAlbanianAleutAlsatianAmericanApacheArabArapahoArgentineanArmenianAssyrian / Chaldean / SyriacAustralianAustrianBahamianBangladeshiBarbadianBasqueBelgianBelizeanBermudanBhutaneseBlackfeetBolivianBrazilianBritishBritish West IndianBulgarianBurmeseCajunCambodianCanadianCape VerdeanCarpatho RusynCelticCentral AmericanCentral American IndianCherokeeCheyenneChickasawChileanChineseChippewaChoctawColombianColvilleComancheCosta RicanCreeCreekCroatianCrowCubanCypriotCzechCzechoslovakianDanishDelawareDominicanDutchDutch West IndianEastern EuropeanEcuadorianEgyptianEnglishEstonianEthiopianEuropeanFijianFilipinoFinnishFrenchFrench American IndianFrench CanadianGermanGerman RussianGhanaianGreekGuamanian / ChamorroGuatemalanGuyaneseHaitianHmongHonduranHopiHoumaHungarianIcelanderIndian (Asian)IndonesianInupiatIranianIraqiIrishIroquoisIsraeliItalianJamaicanJapaneseJordanianKenyanKiowaKoreanLaotianLatvianLebaneseLiberianLithuanianLumbeeLuxembourgerMacedonianMalaysianMalteseMarshalleseMenomineeMexicanMexican American IndianMongolianMoroccanNative HawaiianNavajoNepaleseNew ZealanderNicaraguanNigerianNorthern EuropeanNorwegianOkinawanOsageOttawaPaiutePakistaniPalestinianPanamanianParaguayanPennsylvania GermanPeruvianPimaPolishPortuguesePotawatomiPuebloPuerto RicanPuget Sound SalishRomanianRussianSalvadoranSamoanScandinavianScotch-IrishScottishSeminoleSenegaleseSerbianShoshoneSierra LeoneanSiouxSlavicSlovakSloveneSomaliSouth AfricanSouth AmericanSouth American IndianSoviet UnionSpaniardSpanishSpanish AmericanSpanish American IndianSri LankanSubsaharan AfricanSudaneseSwedishSwissSyrianTaiwaneseThaiTlingit-HaidaTohono O'OdhamTonganTrinidadian and TobagonianTsimshianTurkishU.S. Virgin IslanderUgandanUkrainianUruguayanUteVenezuelanVietnameseWelshWest IndianYakamaYaquiYugoslavianYumanYup'ikZimbabwean
Ancestry (Percentage)
AfghanAfricanAlaska NativeAlaskan AthabascanAlbanianAleutAlsatianAmericanApacheArabArapahoArgentineanArmenianAssyrian / Chaldean / SyriacAustralianAustrianBahamianBangladeshiBarbadianBasqueBelgianBelizeanBermudanBhutaneseBlackfeetBolivianBrazilianBritishBritish West IndianBulgarianBurmeseCajunCambodianCanadianCape VerdeanCarpatho RusynCelticCentral AmericanCentral American IndianCherokeeCheyenneChickasawChileanChineseChippewaChoctawColombianColvilleComancheCosta RicanCreeCreekCroatianCrowCubanCypriotCzechCzechoslovakianDanishDelawareDominicanDutchDutch West IndianEastern EuropeanEcuadorianEgyptianEnglishEstonianEthiopianEuropeanFijianFilipinoFinnishFrenchFrench American IndianFrench CanadianGermanGerman RussianGhanaianGreekGuamanian / ChamorroGuatemalanGuyaneseHaitianHmongHonduranHopiHoumaHungarianIcelanderIndian (Asian)IndonesianInupiatIranianIraqiIrishIroquoisIsraeliItalianJamaicanJapaneseJordanianKenyanKiowaKoreanLaotianLatvianLebaneseLiberianLithuanianLumbeeLuxembourgerMacedonianMalaysianMalteseMarshalleseMenomineeMexicanMexican American IndianMongolianMoroccanNative HawaiianNavajoNepaleseNew ZealanderNicaraguanNigerianNorthern EuropeanNorwegianOkinawanOsageOttawaPaiutePakistaniPalestinianPanamanianParaguayanPennsylvania GermanPeruvianPimaPolishPortuguesePotawatomiPuebloPuerto RicanPuget Sound SalishRomanianRussianSalvadoranSamoanScandinavianScotch-IrishScottishSeminoleSenegaleseSerbianShoshoneSierra LeoneanSiouxSlavicSlovakSloveneSomaliSouth AfricanSouth AmericanSouth American IndianSoviet UnionSpaniardSpanishSpanish AmericanSpanish American IndianSri LankanSubsaharan AfricanSudaneseSwedishSwissSyrianTaiwaneseThaiTlingit-HaidaTohono O'OdhamTonganTrinidadian and TobagonianTsimshianTurkishU.S. Virgin IslanderUgandanUkrainianUruguayanUteVenezuelanVietnameseWelshWest IndianYakamaYaquiYugoslavianYumanYup'ikZimbabwean
Immigrant Origin (Total)
AfghanistanAfricaAlbaniaArgentinaArmeniaAsiaAustraliaAustriaAzoresBahamasBangladeshBarbadosBelarusBelgiumBelizeBoliviaBosnia and HerzegovinaBrazilBulgariaBurma / MyanmarCabo VerdeCambodiaCameroonCanadaCaribbeanCentral AmericaChileChinaColombiaCongoCosta RicaCroatiaCubaCzechoslovakiaDenmarkDominicaDominican RepublicEastern AfricaEastern AsiaEastern EuropeEcuadorEgyptEl SalvadorEnglandEritreaEthiopiaEuropeFijiFranceGermanyGhanaGreeceGrenadaGuatemalaGuyanaHaitiHondurasHong KongHungaryIndiaIndonesiaIranIraqIrelandIsraelItalyJamaicaJapanJordanKazakhstanKenyaKoreaKuwaitLaosLatin AmericaLatviaLebanonLiberiaLithuaniaMalaysiaMexicoMicronesiaMiddle AfricaMoldovaMoroccoNepalNetherlandsNicaraguaNigeriaNorth MacedoniaNorthern AfricaNorthern EuropeNorwayOceaniaPakistanPanamaPeruPhilippinesPolandPortugalRomaniaRussiaSaudi ArabiaScotlandSenegalSerbiaSierra LeoneSingaporeSomaliaSouth AfricaSouth AmericaSouth Central AsiaSouth Eastern AsiaSouthern EuropeSpainSri LankaSt. Vincent and the GrenadinesSudanSwedenSwitzerlandSyriaTaiwanThailandTrinidad and TobagoTurkeyUgandaUkraineUruguayUzbekistanVenezuelaVietnamWest IndiesWestern AfricaWestern AsiaWestern EuropeYemenZaireZimbabwe
Immigrant Origin (Percentage)
AfghanistanAfricaAlbaniaArgentinaArmeniaAsiaAustraliaAustriaAzoresBahamasBangladeshBarbadosBelarusBelgiumBelizeBoliviaBosnia and HerzegovinaBrazilBulgariaBurma / MyanmarCabo VerdeCambodiaCameroonCanadaCaribbeanCentral AmericaChileChinaColombiaCongoCosta RicaCroatiaCubaCzechoslovakiaDenmarkDominicaDominican RepublicEastern AfricaEastern AsiaEastern EuropeEcuadorEgyptEl SalvadorEnglandEritreaEthiopiaEuropeFijiFranceGermanyGhanaGreeceGrenadaGuatemalaGuyanaHaitiHondurasHong KongHungaryIndiaIndonesiaIranIraqIrelandIsraelItalyJamaicaJapanJordanKazakhstanKenyaKoreaKuwaitLaosLatin AmericaLatviaLebanonLiberiaLithuaniaMalaysiaMexicoMicronesiaMiddle AfricaMoldovaMoroccoNepalNetherlandsNicaraguaNigeriaNorth MacedoniaNorthern AfricaNorthern EuropeNorwayOceaniaPakistanPanamaPeruPhilippinesPolandPortugalRomaniaRussiaSaudi ArabiaScotlandSenegalSerbiaSierra LeoneSingaporeSomaliaSouth AfricaSouth AmericaSouth Central AsiaSouth Eastern AsiaSouthern EuropeSpainSri LankaSt. Vincent and the GrenadinesSudanSwedenSwitzerlandSyriaTaiwanThailandTrinidad and TobagoTurkeyUgandaUkraineUruguayUzbekistanVenezuelaVietnamWest IndiesWestern AfricaWestern AsiaWestern EuropeYemenZaireZimbabwe
Income
Income (Families)
Income (Households)
Poverty
Poverty (Families)
Unemployment
Employment Occupations
Employment Industries
Employer Class
Commute Time
Commute Means
School Enrollment
Education by Degree Field
Occupancy
Finances
Physical Characteristics
New Hampshire
Compare Cities
Comparison Subject

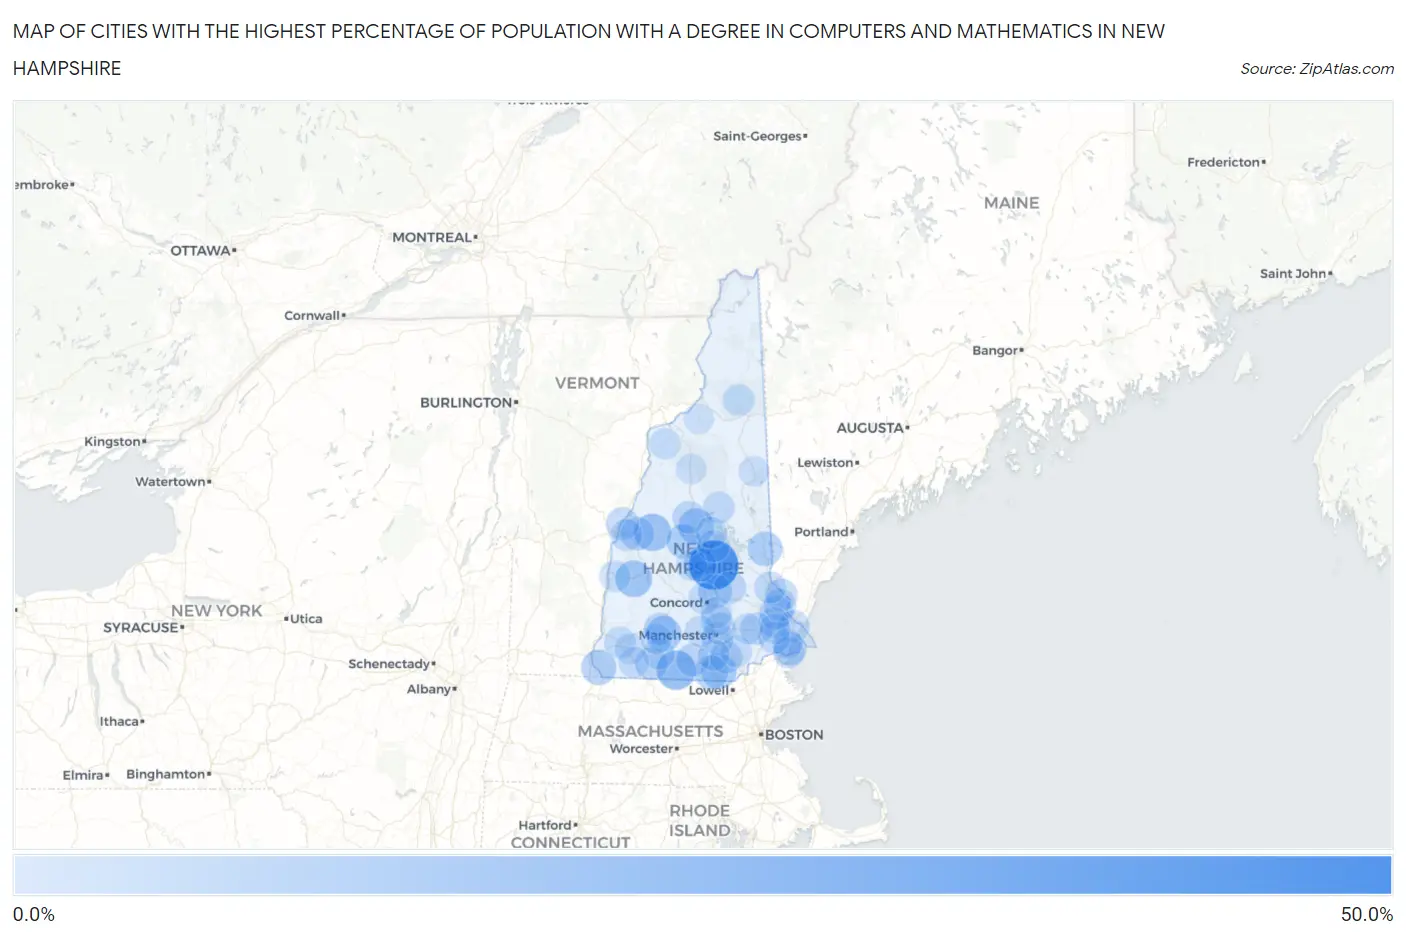
Map of Cities with the Highest Percentage of Population with a Degree in Computers and Mathematics in New Hampshire

0.0%
50.0%
Cities with the Highest Percentage of Population with a Degree in Computers and Mathematics in New Hampshire Map

Cities with the Highest Percentage of Population with a Degree in Computers and Mathematics in New Hampshire

City % Graduates vs State vs National
1.Belmont46.7%4.9%(+41.8)#14.9%(+41.8)#128
2.Greenville21.5%4.9%(+16.6)#24.9%(+16.6)#542
3.Canaan17.1%4.9%(+12.2)#34.9%(+12.2)#818
4.Newport15.4%4.9%(+10.5)#44.9%(+10.5)#1,002
5.Ashland13.3%4.9%(+8.40)#54.9%(+8.41)#1,280
6.Bennington12.7%4.9%(+7.82)#64.9%(+7.83)#1,385
7.Hudson12.3%4.9%(+7.40)#74.9%(+7.40)#1,473
8.Hinsdale11.4%4.9%(+6.54)#84.9%(+6.55)#1,664
9.Sanbornville10.9%4.9%(+6.00)#94.9%(+6.00)#1,817
10.Bristol10.5%4.9%(+5.62)#104.9%(+5.63)#1,931
11.Nashua9.7%4.9%(+4.78)#114.9%(+4.79)#2,267
12.Durham9.3%4.9%(+4.42)#124.9%(+4.42)#2,464
13.Loudon8.6%4.9%(+3.71)#134.9%(+3.72)#2,835
14.Enfield7.9%4.9%(+2.98)#144.9%(+2.99)#3,303
15.Tilton Northfield7.5%4.9%(+2.62)#154.9%(+2.62)#3,585
16.Hanover7.1%4.9%(+2.19)#164.9%(+2.20)#3,947
17.Hampton Beach7.1%4.9%(+2.17)#174.9%(+2.18)#3,966
18.Milford6.7%4.9%(+1.81)#184.9%(+1.82)#4,305
19.Jaffrey6.6%4.9%(+1.68)#194.9%(+1.68)#4,455
20.Plymouth6.2%4.9%(+1.33)#204.9%(+1.34)#4,869
21.Dover5.4%4.9%(+0.540)#214.9%(+0.548)#5,937
22.Epping5.3%4.9%(+0.370)#224.9%(+0.378)#6,193
23.Londonderry5.3%4.9%(+0.366)#234.9%(+0.374)#6,197
24.Manchester5.3%4.9%(+0.349)#244.9%(+0.357)#6,261
25.Somersworth5.2%4.9%(+0.342)#254.9%(+0.350)#6,268
26.Antrim5.2%4.9%(+0.292)#264.9%(+0.301)#6,349
27.Pittsfield5.2%4.9%(+0.283)#274.9%(+0.291)#6,366
28.South Hooksett5.1%4.9%(+0.164)#284.9%(+0.172)#6,559
29.Laconia4.8%4.9%(-0.093)#294.9%(-0.084)#7,044
30.Lebanon4.6%4.9%(-0.268)#304.9%(-0.259)#7,407
31.Center Sandwich4.6%4.9%(-0.287)#314.9%(-0.279)#7,447
32.Portsmouth4.6%4.9%(-0.346)#324.9%(-0.337)#7,548
33.Exeter4.5%4.9%(-0.433)#334.9%(-0.425)#7,733
34.Rochester4.4%4.9%(-0.465)#344.9%(-0.457)#7,804
35.Berlin4.2%4.9%(-0.679)#354.9%(-0.671)#8,256
36.Keene4.1%4.9%(-0.783)#364.9%(-0.774)#8,498
37.Derry4.0%4.9%(-0.913)#374.9%(-0.904)#8,781
38.Hooksett3.9%4.9%(-0.959)#384.9%(-0.950)#8,877
39.Klondike Corner3.9%4.9%(-1.00)#394.9%(-0.994)#8,994
40.Peterborough3.9%4.9%(-1.05)#404.9%(-1.04)#9,088
41.Meredith3.8%4.9%(-1.06)#414.9%(-1.05)#9,100
42.Seabrook Beach3.5%4.9%(-1.39)#424.9%(-1.39)#9,916
43.Concord3.4%4.9%(-1.46)#434.9%(-1.46)#10,095
44.Lisbon3.4%4.9%(-1.48)#444.9%(-1.47)#10,132
45.East Merrimack3.4%4.9%(-1.49)#454.9%(-1.48)#10,148
46.Claremont3.2%4.9%(-1.72)#464.9%(-1.71)#10,751
47.Goffstown3.0%4.9%(-1.86)#474.9%(-1.85)#11,079
48.Franklin2.8%4.9%(-2.15)#484.9%(-2.14)#11,794
49.Newmarket2.7%4.9%(-2.15)#494.9%(-2.15)#11,811
50.Suncook2.7%4.9%(-2.18)#504.9%(-2.17)#11,852
51.Marlborough2.4%4.9%(-2.50)#514.9%(-2.49)#12,644
52.Raymond2.3%4.9%(-2.57)#524.9%(-2.56)#12,786
53.Troy2.3%4.9%(-2.62)#534.9%(-2.61)#12,894
54.Hancock2.3%4.9%(-2.65)#544.9%(-2.64)#12,958
55.Newfields2.2%4.9%(-2.70)#554.9%(-2.69)#13,088
56.North Conway1.8%4.9%(-3.13)#564.9%(-3.12)#14,076
57.Hampton1.6%4.9%(-3.32)#574.9%(-3.31)#14,515
58.Lincoln1.5%4.9%(-3.40)#584.9%(-3.40)#14,681
59.Whitefield0.97%4.9%(-3.93)#594.9%(-3.92)#15,586

Common Questions

What are the Top 10 Cities with the Highest Percentage of Population with a Degree in Computers and Mathematics in New Hampshire?
Top 10 Cities with the Highest Percentage of Population with a Degree in Computers and Mathematics in New Hampshire are:
#1
46.7%
#2
21.5%
#3
17.1%
#4
15.4%
#5
13.3%
#6
12.7%
#7
12.3%
#8
11.4%
#9
10.9%
#10
10.5%
What city has the Highest Percentage of Population with a Degree in Computers and Mathematics in New Hampshire?
Belmont has the Highest Percentage of Population with a Degree in Computers and Mathematics in New Hampshire with 46.7%.
What is the Percentage of Population with a Degree in Computers and Mathematics in the State of New Hampshire?
Percentage of Population with a Degree in Computers and Mathematics in New Hampshire is 4.9%.
What is the Percentage of Population with a Degree in Computers and Mathematics in the United States?
Percentage of Population with a Degree in Computers and Mathematics in the United States is 4.9%.