Easton, CA Map & Demographics
Easton Map
Easton Overview
$41,145
PER CAPITA INCOME
$85,227
AVG FAMILY INCOME
$82,368
AVG HOUSEHOLD INCOME
18.0%
WAGE / INCOME GAP [ % ]
82.0¢/ $1
WAGE / INCOME GAP [ $ ]
$6,833
FAMILY INCOME DEFICIT
0.58
INEQUALITY / GINI INDEX
2,454
TOTAL POPULATION
1,160
MALE POPULATION
1,294
FEMALE POPULATION
89.64
MALES / 100 FEMALES
111.55
FEMALES / 100 MALES
31.8
MEDIAN AGE
4.1
AVG FAMILY SIZE
3.9
AVG HOUSEHOLD SIZE
1,292
LABOR FORCE [ PEOPLE ]
67.1%
PERCENT IN LABOR FORCE
8.1%
UNEMPLOYMENT RATE
Income in Easton
Income Overview in Easton
Per Capita Income in Easton is $41,145, while median incomes of families and households are $85,227 and $82,368 respectively.
| Characteristic | Number | Measure |
| Per Capita Income | 2,454 | $41,145 |
| Median Family Income | 552 | $85,227 |
| Mean Family Income | 552 | $163,144 |
| Median Household Income | 626 | $82,368 |
| Mean Household Income | 626 | $153,908 |
| Income Deficit | 552 | $6,833 |
| Wage / Income Gap (%) | 2,454 | 17.98% |
| Wage / Income Gap ($) | 2,454 | 82.02¢ per $1 |
| Gini / Inequality Index | 2,454 | 0.58 |
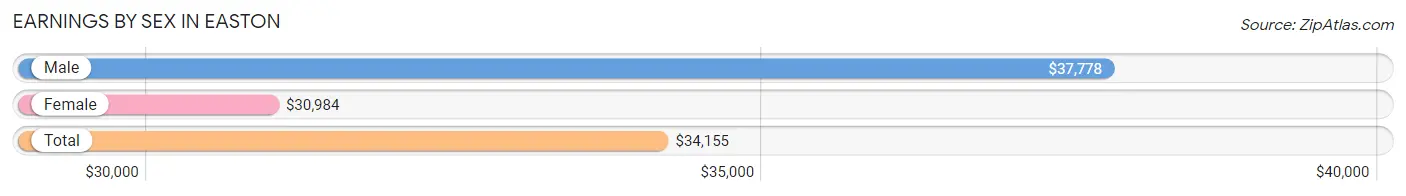
Earnings by Sex in Easton
Average Earnings in Easton are $34,155, $37,778 for men and $30,984 for women, a difference of 18.0%.
| Sex | Number | Average Earnings |
| Male | 696 (52.9%) | $37,778 |
| Female | 620 (47.1%) | $30,984 |
| Total | 1,316 (100.0%) | $34,155 |
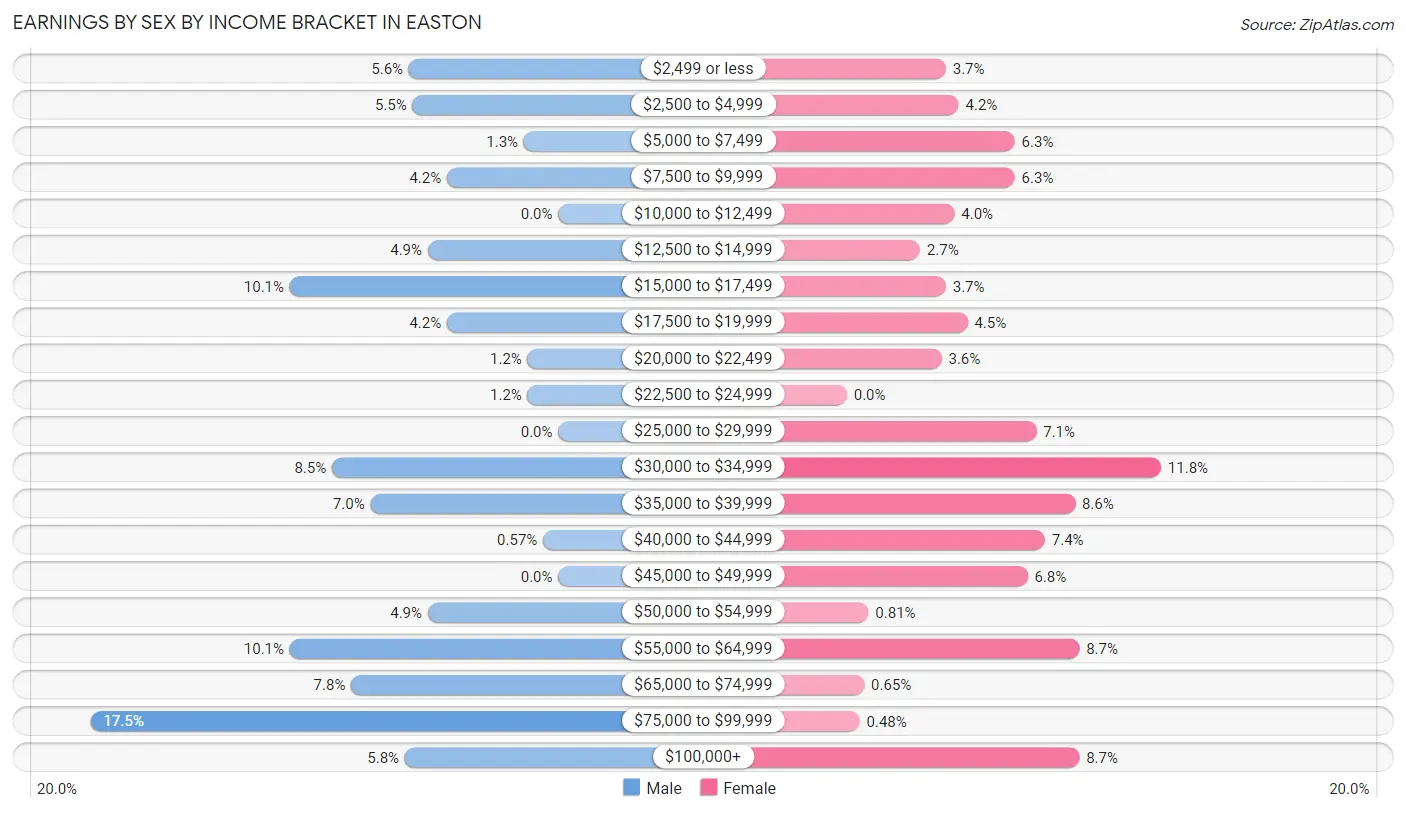
Earnings by Sex by Income Bracket in Easton
The most common earnings brackets in Easton are $75,000 to $99,999 for men (122 | 17.5%) and $30,000 to $34,999 for women (73 | 11.8%).
| Income | Male | Female |
| $2,499 or less | 39 (5.6%) | 23 (3.7%) |
| $2,500 to $4,999 | 38 (5.5%) | 26 (4.2%) |
| $5,000 to $7,499 | 9 (1.3%) | 39 (6.3%) |
| $7,500 to $9,999 | 29 (4.2%) | 39 (6.3%) |
| $10,000 to $12,499 | 0 (0.0%) | 25 (4.0%) |
| $12,500 to $14,999 | 34 (4.9%) | 17 (2.7%) |
| $15,000 to $17,499 | 70 (10.1%) | 23 (3.7%) |
| $17,500 to $19,999 | 29 (4.2%) | 28 (4.5%) |
| $20,000 to $22,499 | 8 (1.1%) | 22 (3.5%) |
| $22,500 to $24,999 | 8 (1.1%) | 0 (0.0%) |
| $25,000 to $29,999 | 0 (0.0%) | 44 (7.1%) |
| $30,000 to $34,999 | 59 (8.5%) | 73 (11.8%) |
| $35,000 to $39,999 | 49 (7.0%) | 53 (8.6%) |
| $40,000 to $44,999 | 4 (0.6%) | 46 (7.4%) |
| $45,000 to $49,999 | 0 (0.0%) | 42 (6.8%) |
| $50,000 to $54,999 | 34 (4.9%) | 5 (0.8%) |
| $55,000 to $64,999 | 70 (10.1%) | 54 (8.7%) |
| $65,000 to $74,999 | 54 (7.8%) | 4 (0.6%) |
| $75,000 to $99,999 | 122 (17.5%) | 3 (0.5%) |
| $100,000+ | 40 (5.8%) | 54 (8.7%) |
| Total | 696 (100.0%) | 620 (100.0%) |
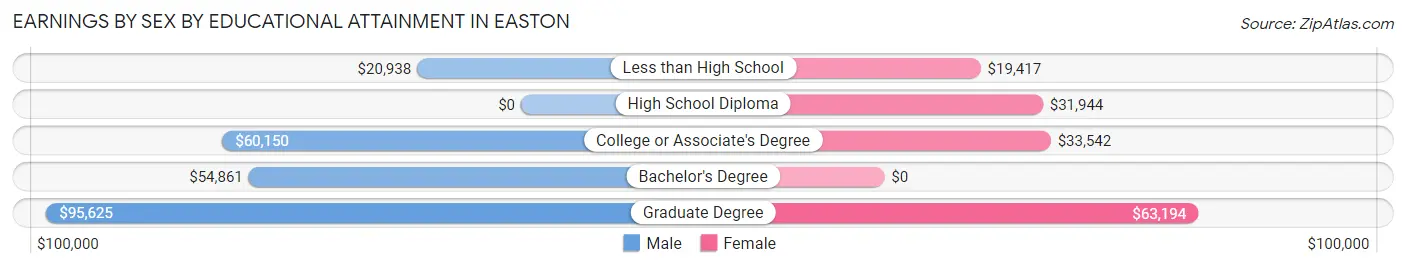
Earnings by Sex by Educational Attainment in Easton
Average earnings in Easton are $54,485 for men and $31,578 for women, a difference of 42.0%. Men with an educational attainment of graduate degree enjoy the highest average annual earnings of $95,625, while those with less than high school education earn the least with $20,938. Women with an educational attainment of graduate degree earn the most with the average annual earnings of $63,194, while those with less than high school education have the smallest earnings of $19,417.
| Educational Attainment | Male Income | Female Income |
| Less than High School | $20,938 | $19,417 |
| High School Diploma | - | - |
| College or Associate's Degree | $60,150 | $33,542 |
| Bachelor's Degree | $54,861 | $0 |
| Graduate Degree | $95,625 | $63,194 |
| Total | $54,485 | $31,578 |
Family Income in Easton
Family Income Brackets in Easton
According to the Easton family income data, there are 139 families falling into the $50,000 to $74,999 income range, which is the most common income bracket and makes up 25.2% of all families.
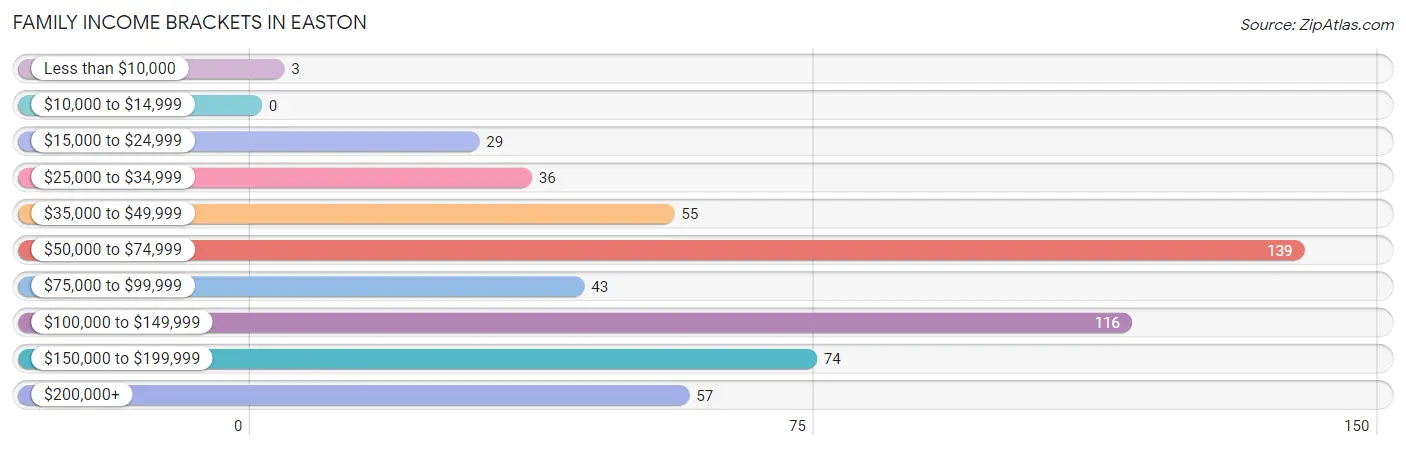
| Income Bracket | # Families | % Families |
| Less than $10,000 | 3 | 0.5% |
| $10,000 to $14,999 | 0 | 0.0% |
| $15,000 to $24,999 | 29 | 5.3% |
| $25,000 to $34,999 | 36 | 6.5% |
| $35,000 to $49,999 | 55 | 10.0% |
| $50,000 to $74,999 | 139 | 25.2% |
| $75,000 to $99,999 | 43 | 7.8% |
| $100,000 to $149,999 | 116 | 21.0% |
| $150,000 to $199,999 | 74 | 13.4% |
| $200,000+ | 57 | 10.3% |
Family Income by Famaliy Size in Easton
5-person families (82 | 14.9%) account for the highest median family income in Easton with $156,800 per family, while 3-person families (106 | 19.2%) have the highest median income of $36,625 per family member.
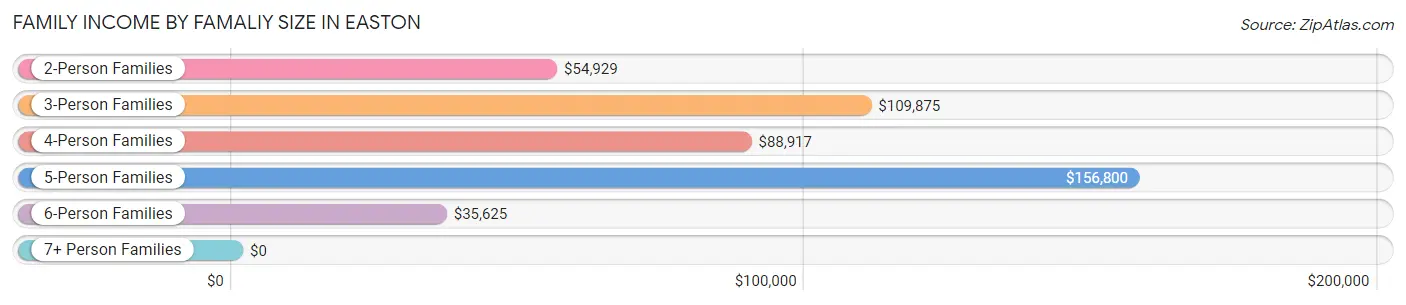
| Income Bracket | # Families | Median Income |
| 2-Person Families | 154 (27.9%) | $54,929 |
| 3-Person Families | 106 (19.2%) | $109,875 |
| 4-Person Families | 147 (26.6%) | $88,917 |
| 5-Person Families | 82 (14.9%) | $156,800 |
| 6-Person Families | 38 (6.9%) | $35,625 |
| 7+ Person Families | 25 (4.5%) | $0 |
| Total | 552 (100.0%) | $85,227 |
Family Income by Number of Earners in Easton
The median family income in Easton is $85,227, with families comprising 3+ earners (127) having the highest median family income of $149,250, while families with 1 earner (160) have the lowest median family income of $56,250, accounting for 23.0% and 29.0% of families, respectively.
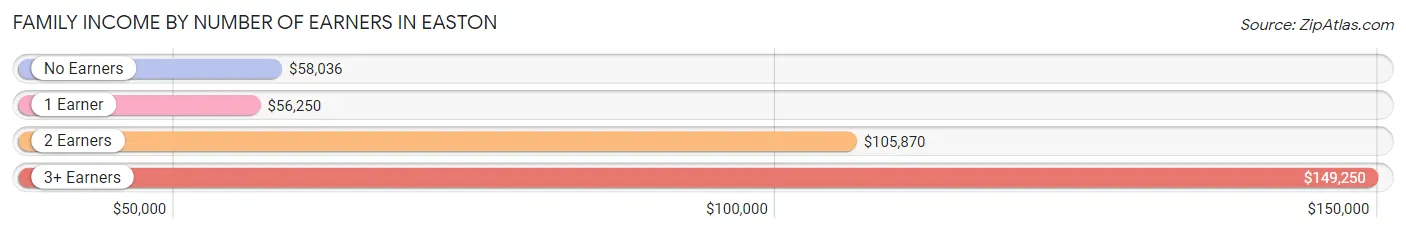
| Number of Earners | # Families | Median Income |
| No Earners | 51 (9.2%) | $58,036 |
| 1 Earner | 160 (29.0%) | $56,250 |
| 2 Earners | 214 (38.8%) | $105,870 |
| 3+ Earners | 127 (23.0%) | $149,250 |
| Total | 552 (100.0%) | $85,227 |
Household Income in Easton
Household Income Brackets in Easton
With 135 households falling in the category, the $100,000 to $149,999 income range is the most frequent in Easton, accounting for 21.6% of all households. In contrast, only 3 households (0.5%) fall into the less than $10,000 income bracket, making it the least populous group.

| Income Bracket | # Households | % Households |
| Less than $10,000 | 3 | 0.5% |
| $10,000 to $14,999 | 8 | 1.3% |
| $15,000 to $24,999 | 35 | 5.6% |
| $25,000 to $34,999 | 50 | 8.0% |
| $35,000 to $49,999 | 75 | 12.0% |
| $50,000 to $74,999 | 116 | 18.5% |
| $75,000 to $99,999 | 69 | 11.0% |
| $100,000 to $149,999 | 135 | 21.6% |
| $150,000 to $199,999 | 74 | 11.8% |
| $200,000+ | 61 | 9.7% |
Household Income by Householder Age in Easton
The median household income in Easton is $82,368, with the highest median household income of $109,250 found in the 45 to 64 years age bracket for the primary householder. A total of 286 households (45.7%) fall into this category. Meanwhile, the 65+ years age bracket for the primary householder has the lowest median household income of $46,058, with 101 households (16.1%) in this group.
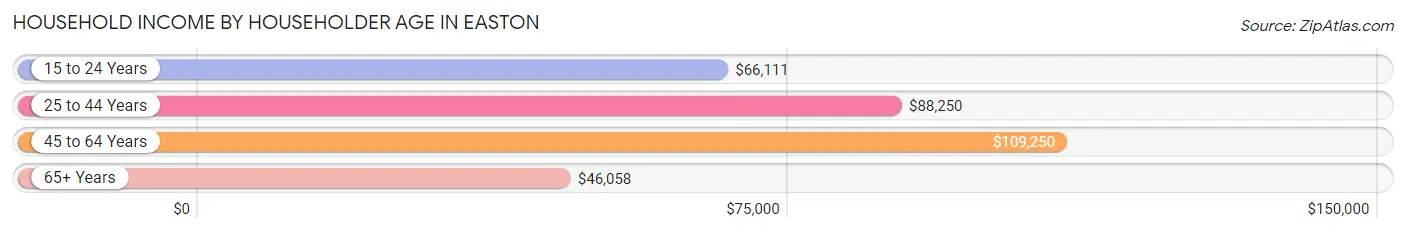
| Income Bracket | # Households | Median Income |
| 15 to 24 Years | 30 (4.8%) | $66,111 |
| 25 to 44 Years | 209 (33.4%) | $88,250 |
| 45 to 64 Years | 286 (45.7%) | $109,250 |
| 65+ Years | 101 (16.1%) | $46,058 |
| Total | 626 (100.0%) | $82,368 |
Poverty in Easton
Income Below Poverty by Sex and Age in Easton
With 17.6% poverty level for males and 20.0% for females among the residents of Easton, 15 year old males and 5 year old females are the most vulnerable to poverty, with 2 males (100.0%) and 30 females (53.6%) in their respective age groups living below the poverty level.
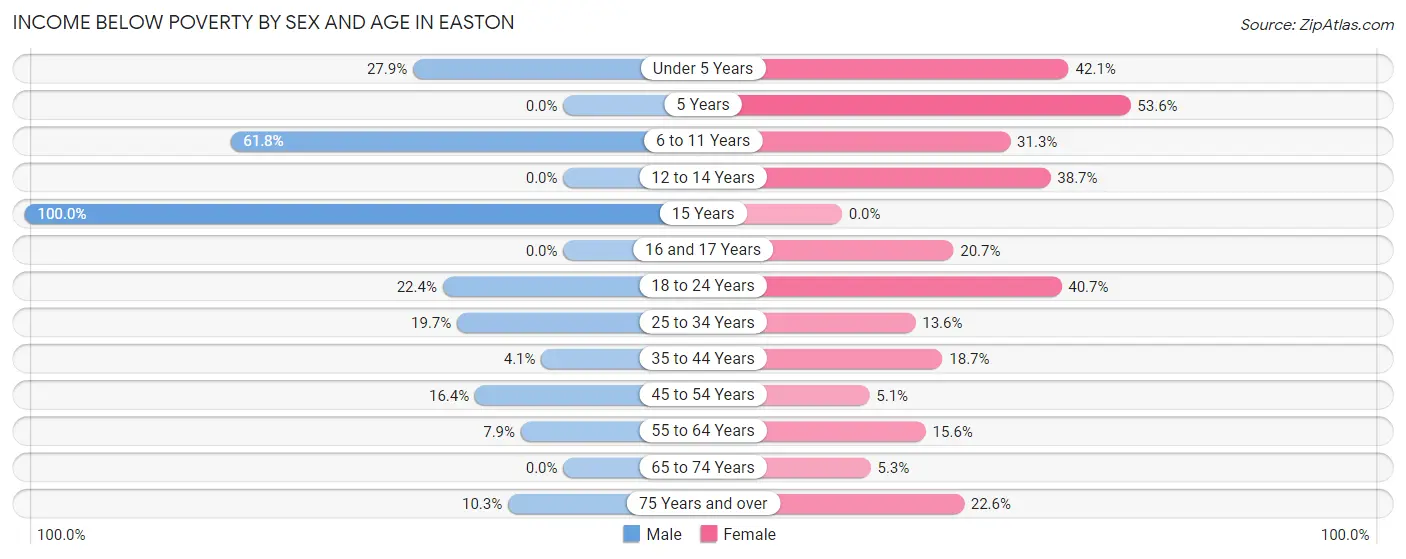
| Age Bracket | Male | Female |
| Under 5 Years | 24 (27.9%) | 40 (42.1%) |
| 5 Years | 0 (0.0%) | 30 (53.6%) |
| 6 to 11 Years | 55 (61.8%) | 15 (31.2%) |
| 12 to 14 Years | 0 (0.0%) | 12 (38.7%) |
| 15 Years | 2 (100.0%) | 0 (0.0%) |
| 16 and 17 Years | 0 (0.0%) | 18 (20.7%) |
| 18 to 24 Years | 45 (22.4%) | 33 (40.7%) |
| 25 to 34 Years | 28 (19.7%) | 33 (13.6%) |
| 35 to 44 Years | 4 (4.1%) | 28 (18.7%) |
| 45 to 54 Years | 30 (16.4%) | 11 (5.1%) |
| 55 to 64 Years | 12 (7.9%) | 19 (15.6%) |
| 65 to 74 Years | 0 (0.0%) | 4 (5.3%) |
| 75 Years and over | 4 (10.3%) | 12 (22.6%) |
| Total | 204 (17.6%) | 255 (20.0%) |
Income Above Poverty by Sex and Age in Easton
According to the poverty statistics in Easton, males aged 5 years and females aged 15 years are the age groups that are most secure financially, with 100.0% of males and 100.0% of females in these age groups living above the poverty line.
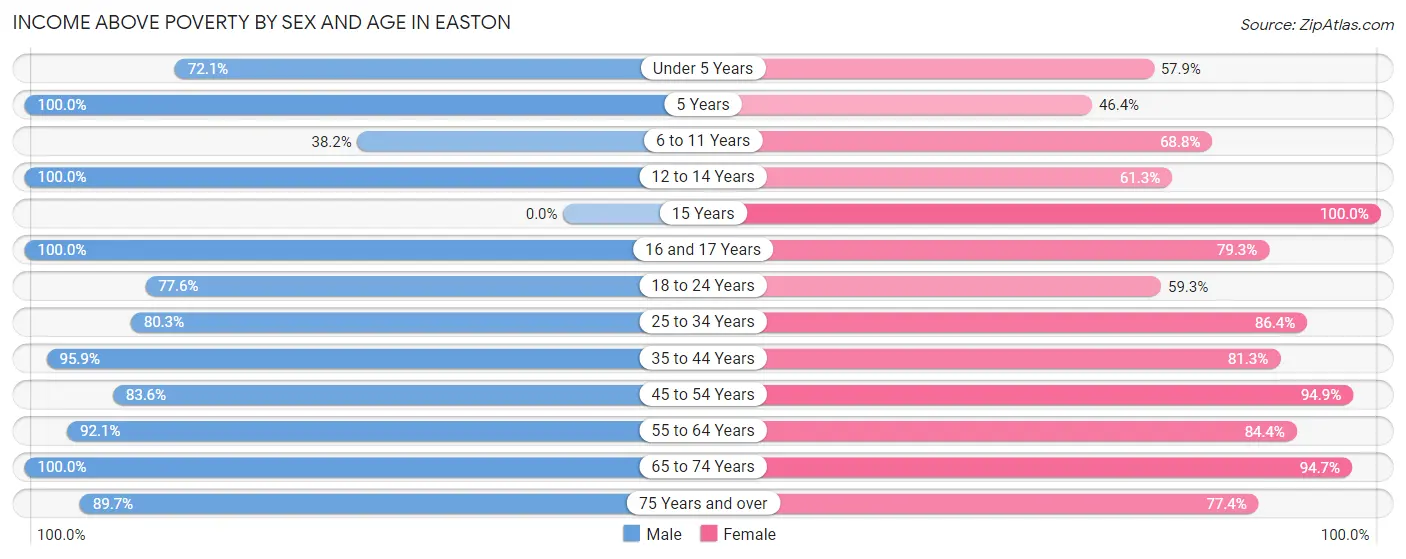
| Age Bracket | Male | Female |
| Under 5 Years | 62 (72.1%) | 55 (57.9%) |
| 5 Years | 6 (100.0%) | 26 (46.4%) |
| 6 to 11 Years | 34 (38.2%) | 33 (68.8%) |
| 12 to 14 Years | 73 (100.0%) | 19 (61.3%) |
| 15 Years | 0 (0.0%) | 21 (100.0%) |
| 16 and 17 Years | 14 (100.0%) | 69 (79.3%) |
| 18 to 24 Years | 156 (77.6%) | 48 (59.3%) |
| 25 to 34 Years | 114 (80.3%) | 209 (86.4%) |
| 35 to 44 Years | 94 (95.9%) | 122 (81.3%) |
| 45 to 54 Years | 153 (83.6%) | 204 (94.9%) |
| 55 to 64 Years | 140 (92.1%) | 103 (84.4%) |
| 65 to 74 Years | 72 (100.0%) | 71 (94.7%) |
| 75 Years and over | 35 (89.7%) | 41 (77.4%) |
| Total | 953 (82.4%) | 1,021 (80.0%) |
Income Below Poverty Among Married-Couple Families in Easton
The poverty statistics for married-couple families in Easton show that 10.6% or 44 of the total 416 families live below the poverty line. Families with 3 or 4 children have the highest poverty rate of 68.1%, comprising of 32 families. On the other hand, families with no children have the lowest poverty rate of 2.1%, which includes 4 families.
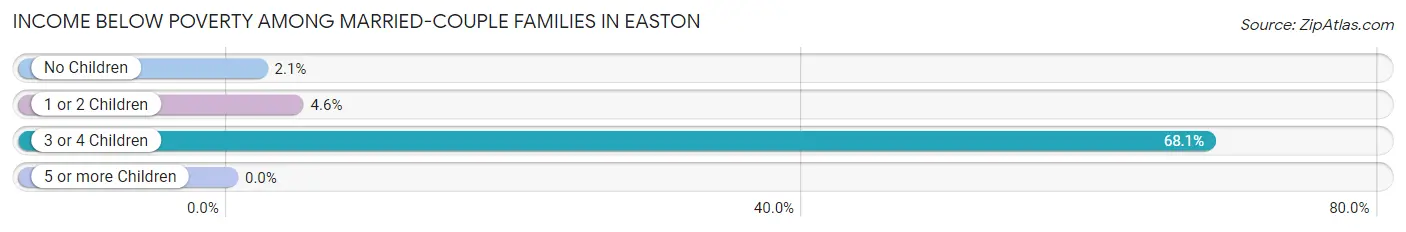
| Children | Above Poverty | Below Poverty |
| No Children | 190 (97.9%) | 4 (2.1%) |
| 1 or 2 Children | 167 (95.4%) | 8 (4.6%) |
| 3 or 4 Children | 15 (31.9%) | 32 (68.1%) |
| 5 or more Children | 0 (0.0%) | 0 (0.0%) |
| Total | 372 (89.4%) | 44 (10.6%) |
Income Below Poverty Among Single-Parent Households in Easton
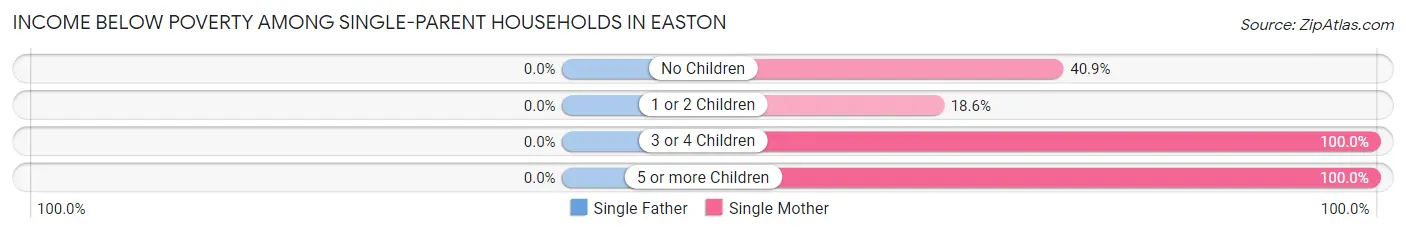
| Children | Single Father | Single Mother |
| No Children | 0 (0.0%) | 9 (40.9%) |
| 1 or 2 Children | 0 (0.0%) | 11 (18.6%) |
| 3 or 4 Children | 0 (0.0%) | 8 (100.0%) |
| 5 or more Children | 0 (0.0%) | 3 (100.0%) |
| Total | 0 (0.0%) | 31 (33.7%) |
Income Below Poverty Among Married-Couple vs Single-Parent Households in Easton
The poverty data for Easton shows that 44 of the married-couple family households (10.6%) and 31 of the single-parent households (22.8%) are living below the poverty level. Within the married-couple family households, those with 3 or 4 children have the highest poverty rate, with 32 households (68.1%) falling below the poverty line. Among the single-parent households, those with 5 or more children have the highest poverty rate, with 3 household (100.0%) living below poverty.
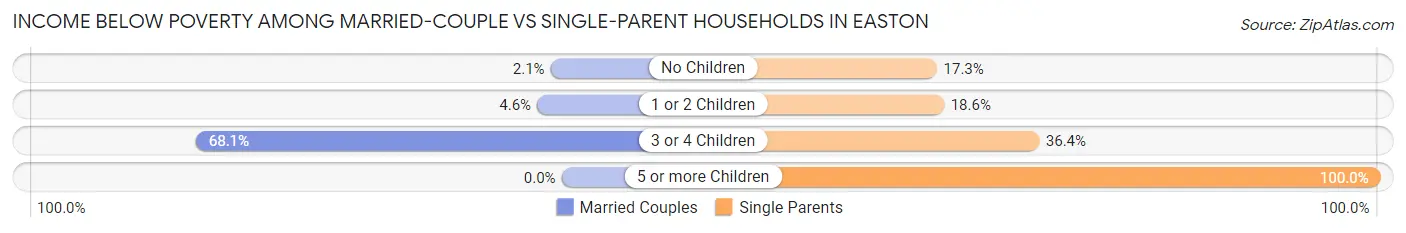
| Children | Married-Couple Families | Single-Parent Households |
| No Children | 4 (2.1%) | 9 (17.3%) |
| 1 or 2 Children | 8 (4.6%) | 11 (18.6%) |
| 3 or 4 Children | 32 (68.1%) | 8 (36.4%) |
| 5 or more Children | 0 (0.0%) | 3 (100.0%) |
| Total | 44 (10.6%) | 31 (22.8%) |
Race in Easton
The most populous races in Easton are Hispanic or Latino (1,607 | 65.5%), White / Caucasian (988 | 40.3%), and Some other Race (685 | 27.9%).
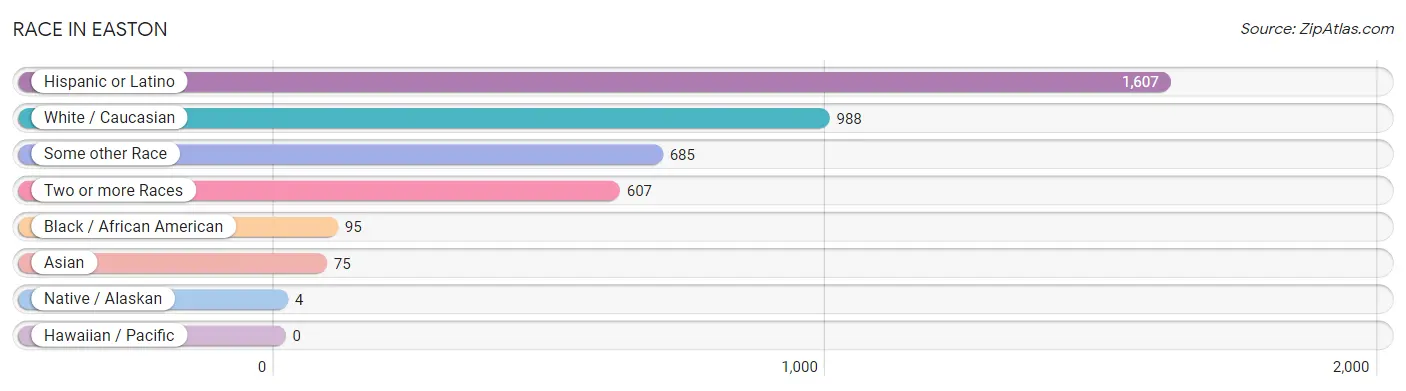
| Race | # Population | % Population |
| Asian | 75 | 3.1% |
| Black / African American | 95 | 3.9% |
| Hawaiian / Pacific | 0 | 0.0% |
| Hispanic or Latino | 1,607 | 65.5% |
| Native / Alaskan | 4 | 0.2% |
| White / Caucasian | 988 | 40.3% |
| Two or more Races | 607 | 24.7% |
| Some other Race | 685 | 27.9% |
| Total | 2,454 | 100.0% |
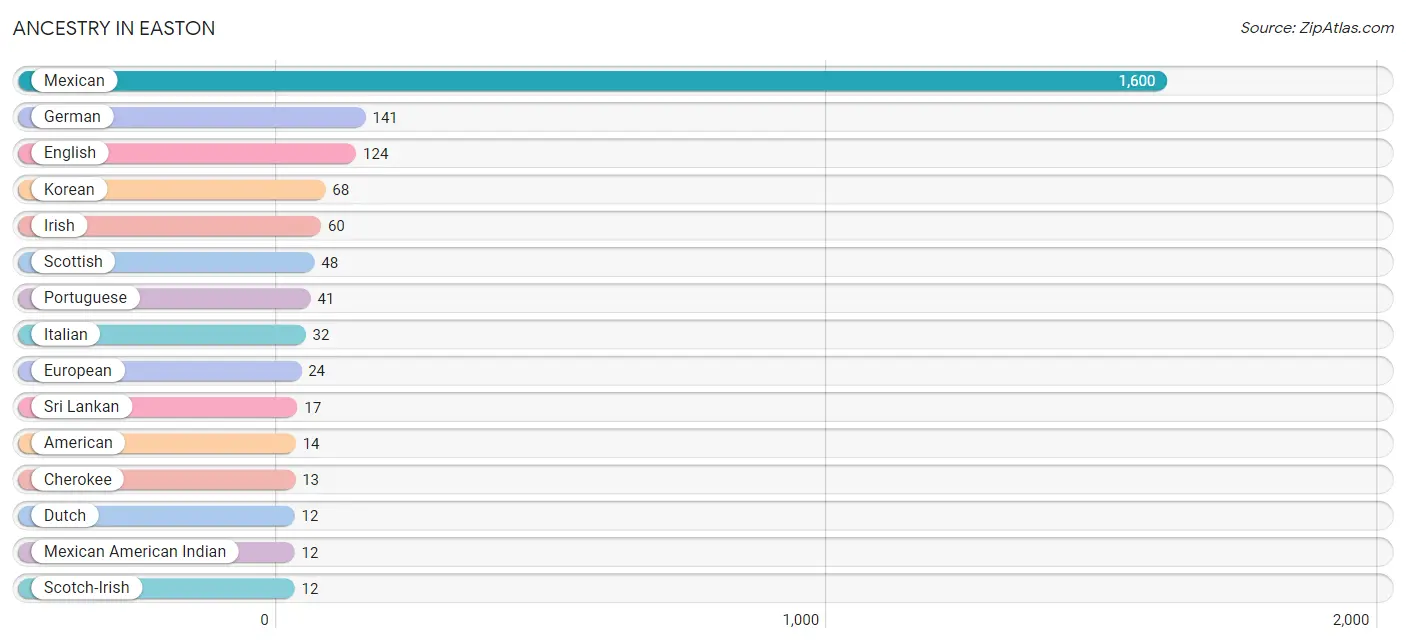
Ancestry in Easton
The most populous ancestries reported in Easton are Mexican (1,600 | 65.2%), German (141 | 5.8%), English (124 | 5.1%), Korean (68 | 2.8%), and Irish (60 | 2.4%), together accounting for 81.2% of all Easton residents.
| Ancestry | # Population | % Population |
| American | 14 | 0.6% |
| Armenian | 6 | 0.2% |
| Bangladeshi | 10 | 0.4% |
| Bhutanese | 8 | 0.3% |
| British | 1 | 0.0% |
| Canadian | 9 | 0.4% |
| Cherokee | 13 | 0.5% |
| Creek | 5 | 0.2% |
| Danish | 7 | 0.3% |
| Dutch | 12 | 0.5% |
| English | 124 | 5.1% |
| European | 24 | 1.0% |
| French | 10 | 0.4% |
| German | 141 | 5.8% |
| Irish | 60 | 2.4% |
| Italian | 32 | 1.3% |
| Korean | 68 | 2.8% |
| Mexican | 1,600 | 65.2% |
| Mexican American Indian | 12 | 0.5% |
| Norwegian | 8 | 0.3% |
| Polish | 6 | 0.2% |
| Portuguese | 41 | 1.7% |
| Puerto Rican | 7 | 0.3% |
| Russian | 3 | 0.1% |
| Scotch-Irish | 12 | 0.5% |
| Scottish | 48 | 2.0% |
| Sri Lankan | 17 | 0.7% | View All 27 Rows |
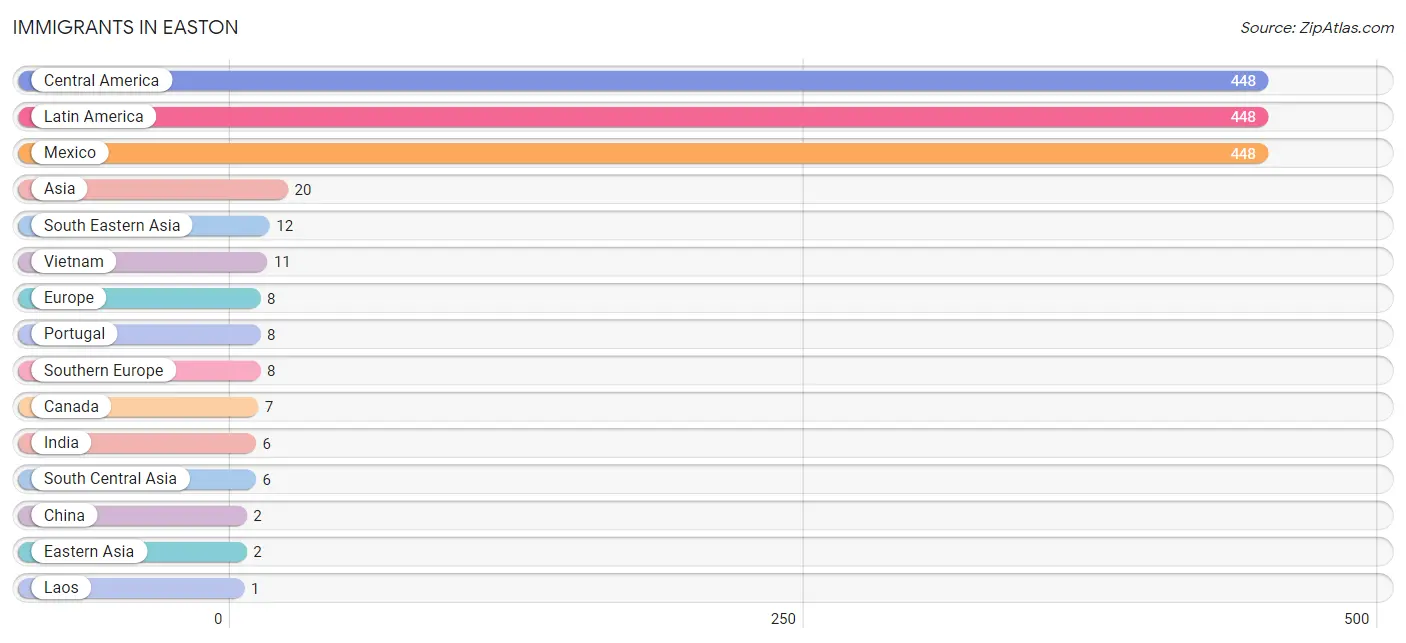
Immigrants in Easton
The most numerous immigrant groups reported in Easton came from Central America (448 | 18.3%), Latin America (448 | 18.3%), Mexico (448 | 18.3%), Asia (20 | 0.8%), and South Eastern Asia (12 | 0.5%), together accounting for 56.1% of all Easton residents.
| Immigration Origin | # Population | % Population |
| Asia | 20 | 0.8% |
| Canada | 7 | 0.3% |
| Central America | 448 | 18.3% |
| China | 2 | 0.1% |
| Eastern Asia | 2 | 0.1% |
| Europe | 8 | 0.3% |
| India | 6 | 0.2% |
| Laos | 1 | 0.0% |
| Latin America | 448 | 18.3% |
| Mexico | 448 | 18.3% |
| Portugal | 8 | 0.3% |
| South Central Asia | 6 | 0.2% |
| South Eastern Asia | 12 | 0.5% |
| Southern Europe | 8 | 0.3% |
| Vietnam | 11 | 0.4% | View All 15 Rows |
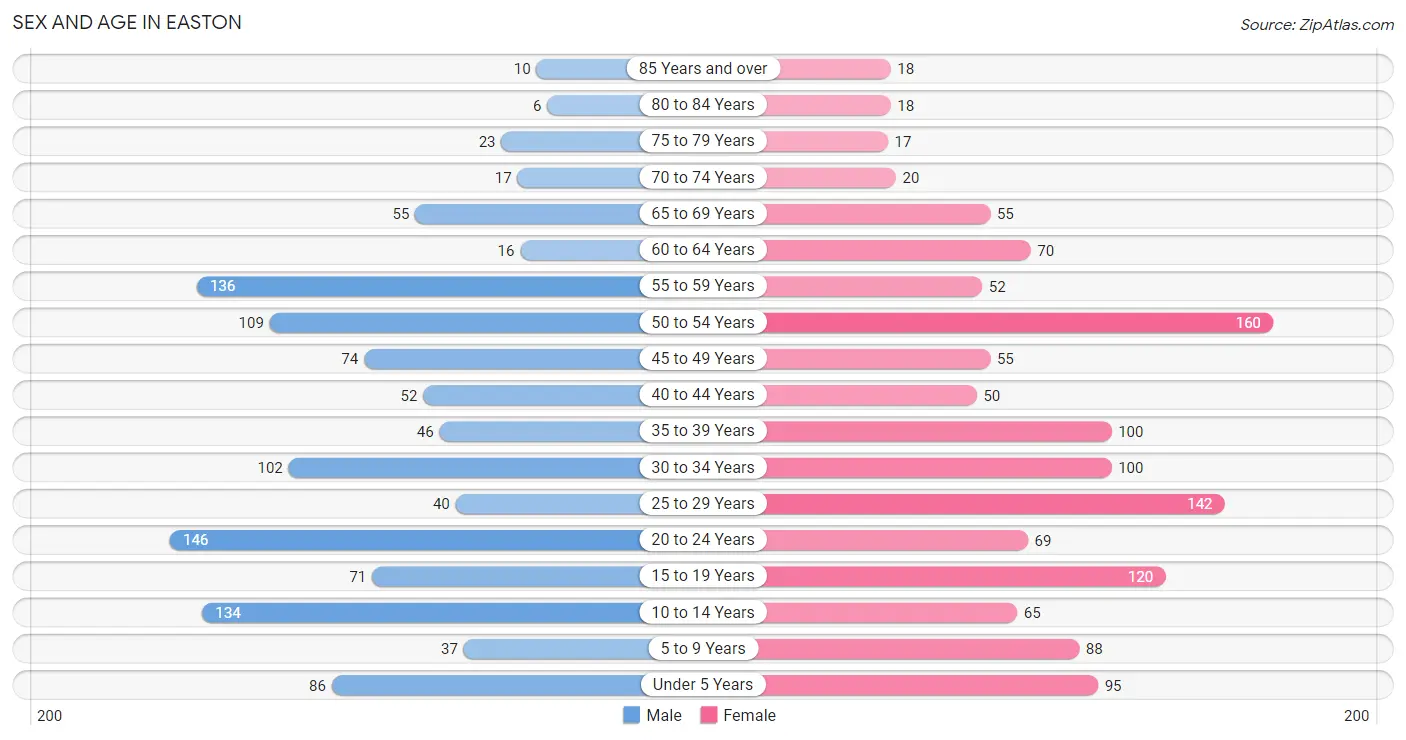
Sex and Age in Easton
Sex and Age in Easton
The most populous age groups in Easton are 20 to 24 Years (146 | 12.6%) for men and 50 to 54 Years (160 | 12.4%) for women.
| Age Bracket | Male | Female |
| Under 5 Years | 86 (7.4%) | 95 (7.3%) |
| 5 to 9 Years | 37 (3.2%) | 88 (6.8%) |
| 10 to 14 Years | 134 (11.6%) | 65 (5.0%) |
| 15 to 19 Years | 71 (6.1%) | 120 (9.3%) |
| 20 to 24 Years | 146 (12.6%) | 69 (5.3%) |
| 25 to 29 Years | 40 (3.5%) | 142 (11.0%) |
| 30 to 34 Years | 102 (8.8%) | 100 (7.7%) |
| 35 to 39 Years | 46 (4.0%) | 100 (7.7%) |
| 40 to 44 Years | 52 (4.5%) | 50 (3.9%) |
| 45 to 49 Years | 74 (6.4%) | 55 (4.3%) |
| 50 to 54 Years | 109 (9.4%) | 160 (12.4%) |
| 55 to 59 Years | 136 (11.7%) | 52 (4.0%) |
| 60 to 64 Years | 16 (1.4%) | 70 (5.4%) |
| 65 to 69 Years | 55 (4.7%) | 55 (4.3%) |
| 70 to 74 Years | 17 (1.5%) | 20 (1.5%) |
| 75 to 79 Years | 23 (2.0%) | 17 (1.3%) |
| 80 to 84 Years | 6 (0.5%) | 18 (1.4%) |
| 85 Years and over | 10 (0.9%) | 18 (1.4%) |
| Total | 1,160 (100.0%) | 1,294 (100.0%) |
Families and Households in Easton
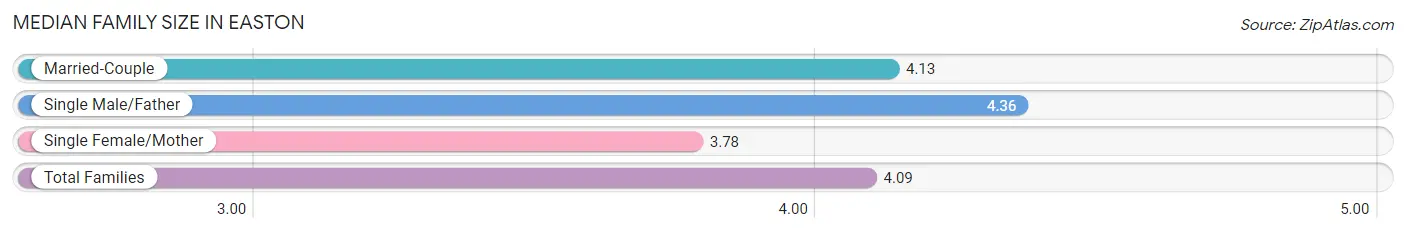
Median Family Size in Easton
The median family size in Easton is 4.09 persons per family, with single male/father families (44 | 8.0%) accounting for the largest median family size of 4.36 persons per family. On the other hand, single female/mother families (92 | 16.7%) represent the smallest median family size with 3.78 persons per family.
| Family Type | # Families | Family Size |
| Married-Couple | 416 (75.4%) | 4.13 |
| Single Male/Father | 44 (8.0%) | 4.36 |
| Single Female/Mother | 92 (16.7%) | 3.78 |
| Total Families | 552 (100.0%) | 4.09 |
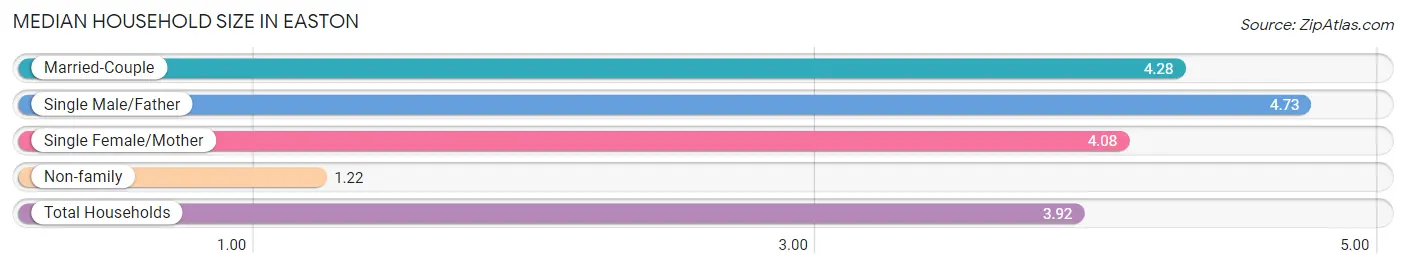
Median Household Size in Easton
The median household size in Easton is 3.92 persons per household, with single male/father households (44 | 7.0%) accounting for the largest median household size of 4.73 persons per household. non-family households (74 | 11.8%) represent the smallest median household size with 1.22 persons per household.
| Household Type | # Households | Household Size |
| Married-Couple | 416 (66.4%) | 4.28 |
| Single Male/Father | 44 (7.0%) | 4.73 |
| Single Female/Mother | 92 (14.7%) | 4.08 |
| Non-family | 74 (11.8%) | 1.22 |
| Total Households | 626 (100.0%) | 3.92 |
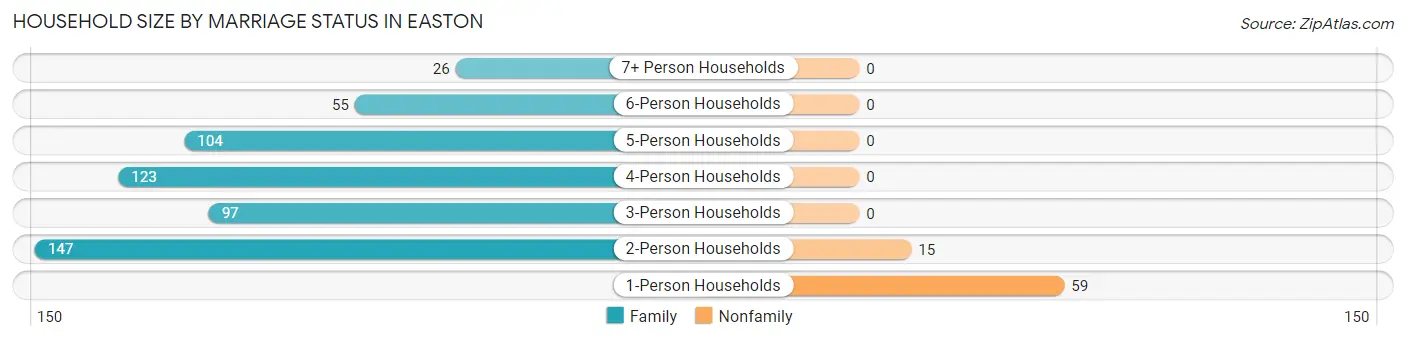
Household Size by Marriage Status in Easton
Out of a total of 626 households in Easton, 552 (88.2%) are family households, while 74 (11.8%) are nonfamily households. The most numerous type of family households are 2-person households, comprising 147, and the most common type of nonfamily households are 1-person households, comprising 59.
| Household Size | Family Households | Nonfamily Households |
| 1-Person Households | - | 59 (9.4%) |
| 2-Person Households | 147 (23.5%) | 15 (2.4%) |
| 3-Person Households | 97 (15.5%) | 0 (0.0%) |
| 4-Person Households | 123 (19.7%) | 0 (0.0%) |
| 5-Person Households | 104 (16.6%) | 0 (0.0%) |
| 6-Person Households | 55 (8.8%) | 0 (0.0%) |
| 7+ Person Households | 26 (4.2%) | 0 (0.0%) |
| Total | 552 (88.2%) | 74 (11.8%) |
Female Fertility in Easton
Fertility by Age in Easton
Average fertility rate in Easton is 72.0 births per 1,000 women. Women in the age bracket of 35 to 50 years have the highest fertility rate with 160.0 births per 1,000 women. Women in the age bracket of 35 to 50 years acount for 84.0% of all women with births.
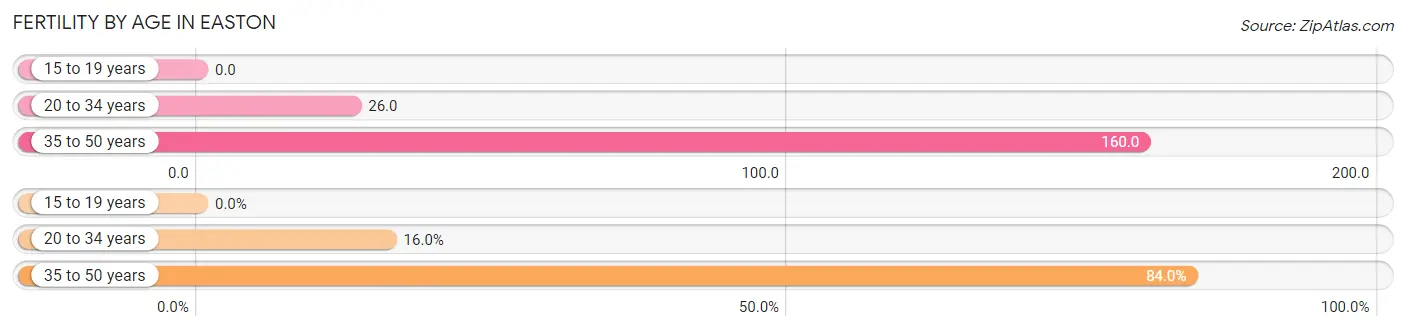
| Age Bracket | Women with Births | Births / 1,000 Women |
| 15 to 19 years | 0 (0.0%) | 0.0 |
| 20 to 34 years | 8 (16.0%) | 26.0 |
| 35 to 50 years | 42 (84.0%) | 160.0 |
| Total | 50 (100.0%) | 72.0 |
Fertility by Age by Marriage Status in Easton
44.0% of women with births (50) in Easton are married. The highest percentage of unmarried women with births falls into 20 to 34 years age bracket with 100.0% of them unmarried at the time of birth, while the lowest percentage of unmarried women with births belong to 35 to 50 years age bracket with 47.6% of them unmarried.
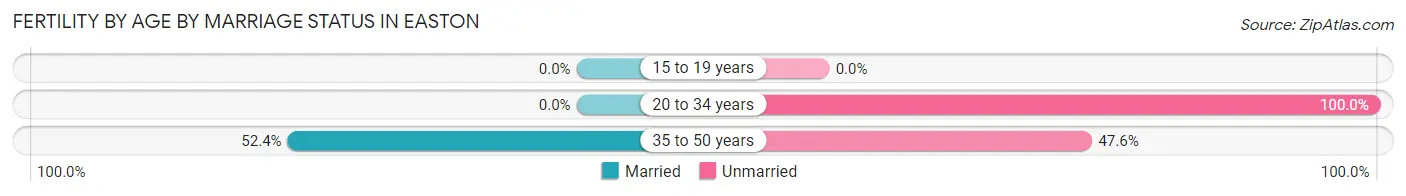
| Age Bracket | Married | Unmarried |
| 15 to 19 years | 0 (0.0%) | 0 (0.0%) |
| 20 to 34 years | 0 (0.0%) | 8 (100.0%) |
| 35 to 50 years | 22 (52.4%) | 20 (47.6%) |
| Total | 22 (44.0%) | 28 (56.0%) |
Fertility by Education in Easton
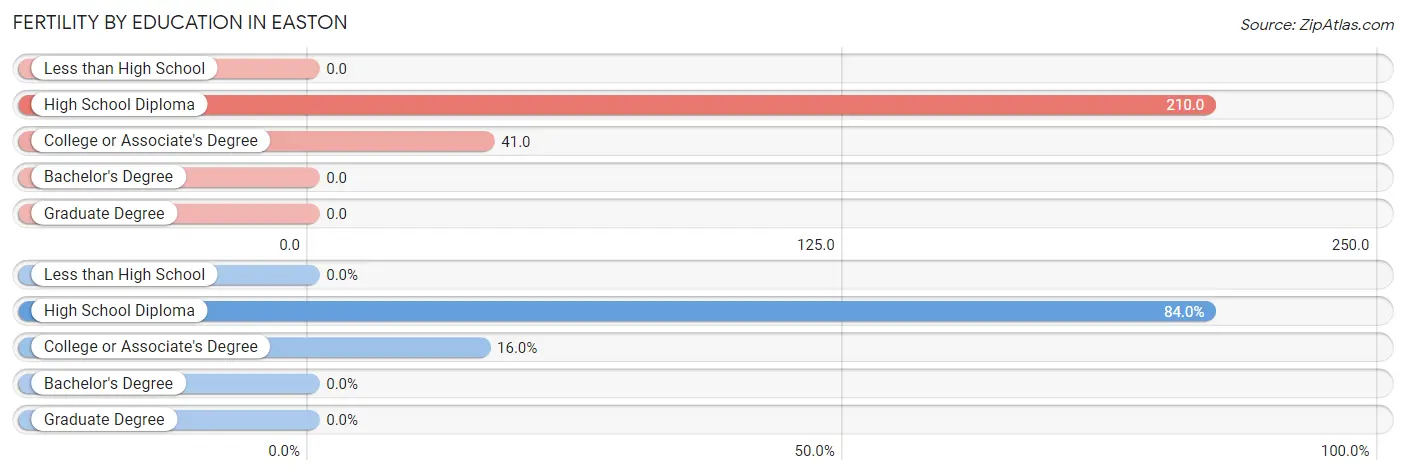
| Educational Attainment | Women with Births | Births / 1,000 Women |
| Less than High School | 0 (0.0%) | 0.0 |
| High School Diploma | 42 (84.0%) | 210.0 |
| College or Associate's Degree | 8 (16.0%) | 41.0 |
| Bachelor's Degree | 0 (0.0%) | 0.0 |
| Graduate Degree | 0 (0.0%) | 0.0 |
| Total | 50 (100.0%) | 72.0 |
Fertility by Education by Marriage Status in Easton
56.0% of women with births in Easton are unmarried. Women with the educational attainment of high school diploma are most likely to be married with 52.4% of them married at childbirth, while women with the educational attainment of college or associate's degree are least likely to be married with 100.0% of them unmarried at childbirth.
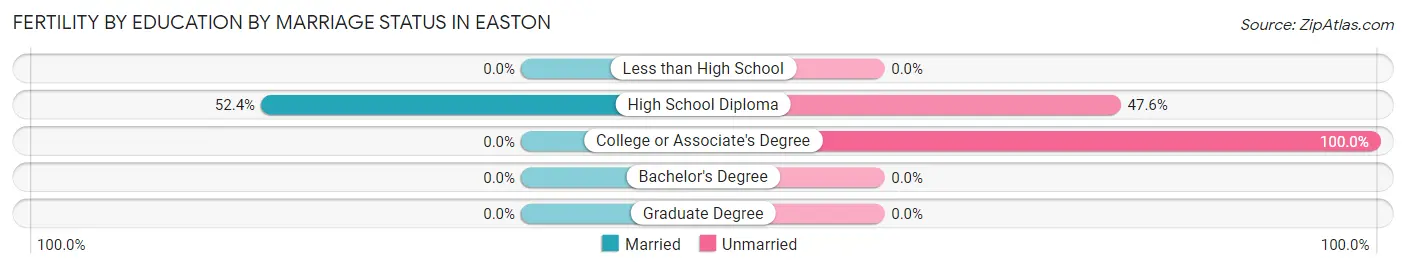
| Educational Attainment | Married | Unmarried |
| Less than High School | 0 (0.0%) | 0 (0.0%) |
| High School Diploma | 22 (52.4%) | 20 (47.6%) |
| College or Associate's Degree | 0 (0.0%) | 8 (100.0%) |
| Bachelor's Degree | 0 (0.0%) | 0 (0.0%) |
| Graduate Degree | 0 (0.0%) | 0 (0.0%) |
| Total | 22 (44.0%) | 28 (56.0%) |
Employment Characteristics in Easton
Employment by Class of Employer in Easton
Among the 1,158 employed individuals in Easton, private company employees (645 | 55.7%), local government employees (242 | 20.9%), and self-employed (not incorporated) (149 | 12.9%) make up the most common classes of employment.
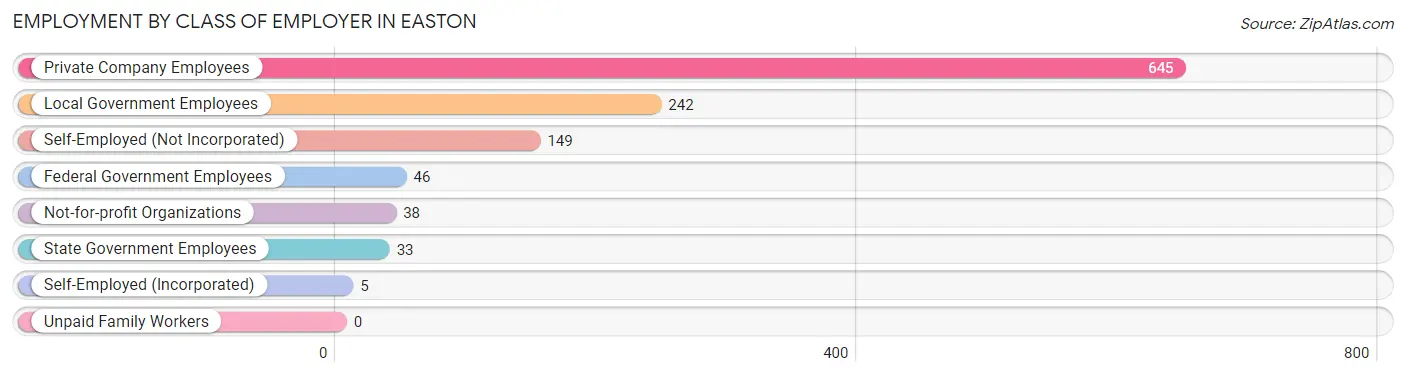
| Employer Class | # Employees | % Employees |
| Private Company Employees | 645 | 55.7% |
| Self-Employed (Incorporated) | 5 | 0.4% |
| Self-Employed (Not Incorporated) | 149 | 12.9% |
| Not-for-profit Organizations | 38 | 3.3% |
| Local Government Employees | 242 | 20.9% |
| State Government Employees | 33 | 2.9% |
| Federal Government Employees | 46 | 4.0% |
| Unpaid Family Workers | 0 | 0.0% |
| Total | 1,158 | 100.0% |
Employment Status by Age in Easton
According to the labor force statistics for Easton, out of the total population over 16 years of age (1,926), 67.1% or 1,292 individuals are in the labor force, with 8.1% or 105 of them unemployed. The age group with the highest labor force participation rate is 35 to 44 years, with 91.1% or 226 individuals in the labor force. Within the labor force, the 25 to 29 years age range has the highest percentage of unemployed individuals, with 23.3% or 30 of them being unemployed.
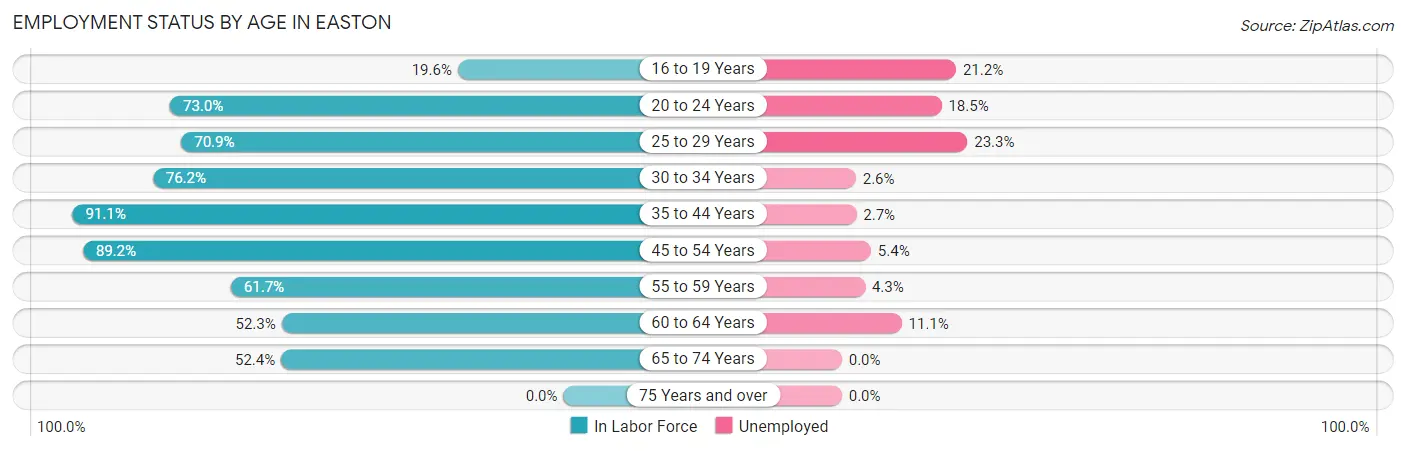
| Age Bracket | In Labor Force | Unemployed |
| 16 to 19 Years | 33 (19.6%) | 7 (21.2%) |
| 20 to 24 Years | 157 (73.0%) | 29 (18.5%) |
| 25 to 29 Years | 129 (70.9%) | 30 (23.3%) |
| 30 to 34 Years | 154 (76.2%) | 4 (2.6%) |
| 35 to 44 Years | 226 (91.1%) | 6 (2.7%) |
| 45 to 54 Years | 355 (89.2%) | 19 (5.4%) |
| 55 to 59 Years | 116 (61.7%) | 5 (4.3%) |
| 60 to 64 Years | 45 (52.3%) | 5 (11.1%) |
| 65 to 74 Years | 77 (52.4%) | 0 (0.0%) |
| 75 Years and over | 0 (0.0%) | 0 (0.0%) |
| Total | 1,292 (67.1%) | 105 (8.1%) |
Employment Status by Educational Attainment in Easton
According to labor force statistics for Easton, 78.6% of individuals (1,025) out of the total population between 25 and 64 years of age (1,304) are in the labor force, with 6.7% or 69 of them being unemployed. The group with the highest labor force participation rate are those with the educational attainment of bachelor's degree or higher, with 93.5% or 257 individuals in the labor force. Within the labor force, individuals with less than high school education have the highest percentage of unemployment, with 26.2% or 34 of them being unemployed.
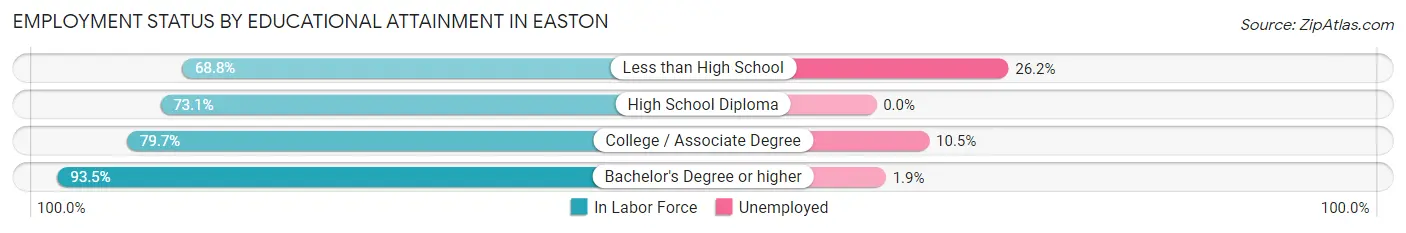
| Educational Attainment | In Labor Force | Unemployed |
| Less than High School | 130 (68.8%) | 50 (26.2%) |
| High School Diploma | 351 (73.1%) | 0 (0.0%) |
| College / Associate Degree | 287 (79.7%) | 38 (10.5%) |
| Bachelor's Degree or higher | 257 (93.5%) | 5 (1.9%) |
| Total | 1,025 (78.6%) | 87 (6.7%) |
Employment Occupations by Sex in Easton
Management, Business, Science and Arts Occupations
The most common Management, Business, Science and Arts occupations in Easton are Community & Social Service (134 | 11.3%), Health Diagnosing & Treating (103 | 8.7%), Management (79 | 6.7%), Education Instruction & Library (76 | 6.4%), and Health Technologists (73 | 6.1%).
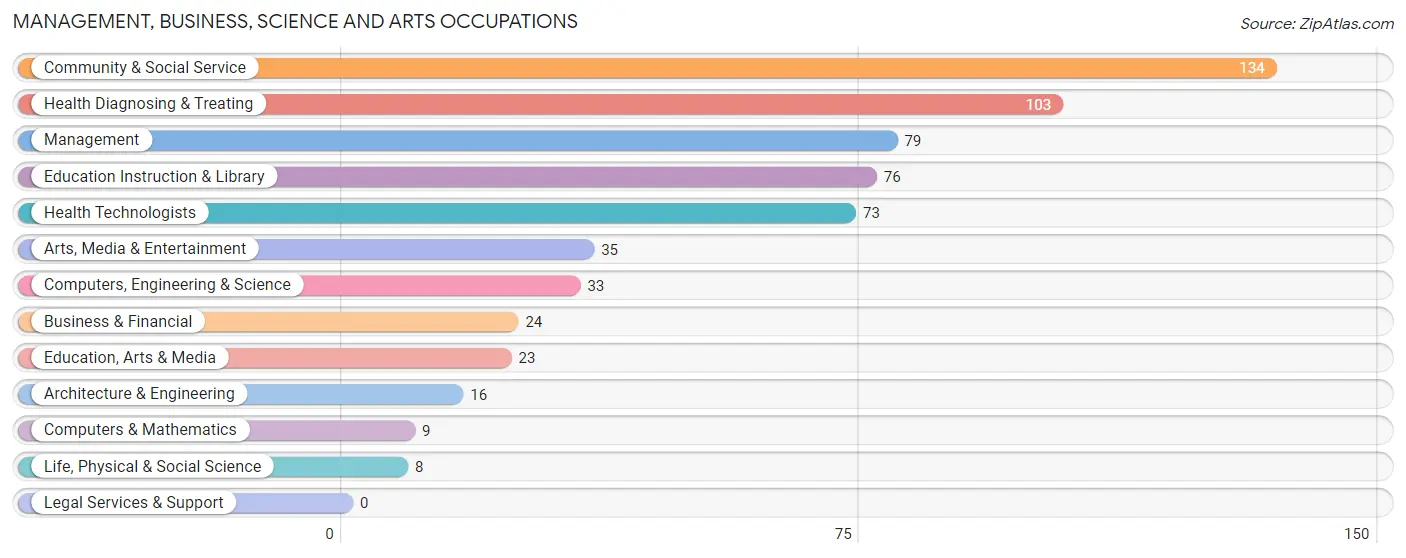
Management, Business, Science and Arts Occupations by Sex
Within the Management, Business, Science and Arts occupations in Easton, the most male-oriented occupations are Architecture & Engineering (100.0%), Education, Arts & Media (87.0%), and Computers, Engineering & Science (69.7%), while the most female-oriented occupations are Arts, Media & Entertainment (100.0%), Business & Financial (79.2%), and Health Diagnosing & Treating (77.7%).
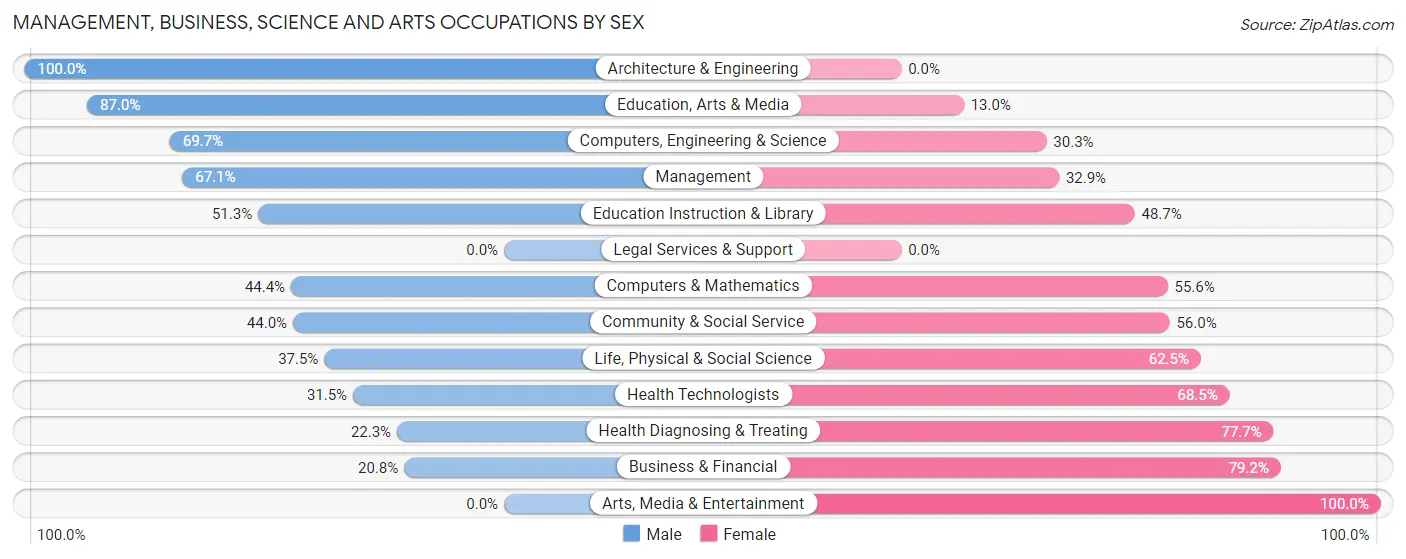
| Occupation | Male | Female |
| Management | 53 (67.1%) | 26 (32.9%) |
| Business & Financial | 5 (20.8%) | 19 (79.2%) |
| Computers, Engineering & Science | 23 (69.7%) | 10 (30.3%) |
| Computers & Mathematics | 4 (44.4%) | 5 (55.6%) |
| Architecture & Engineering | 16 (100.0%) | 0 (0.0%) |
| Life, Physical & Social Science | 3 (37.5%) | 5 (62.5%) |
| Community & Social Service | 59 (44.0%) | 75 (56.0%) |
| Education, Arts & Media | 20 (87.0%) | 3 (13.0%) |
| Legal Services & Support | 0 (0.0%) | 0 (0.0%) |
| Education Instruction & Library | 39 (51.3%) | 37 (48.7%) |
| Arts, Media & Entertainment | 0 (0.0%) | 35 (100.0%) |
| Health Diagnosing & Treating | 23 (22.3%) | 80 (77.7%) |
| Health Technologists | 23 (31.5%) | 50 (68.5%) |
| Total (Category) | 163 (43.7%) | 210 (56.3%) |
| Total (Overall) | 616 (51.9%) | 571 (48.1%) |
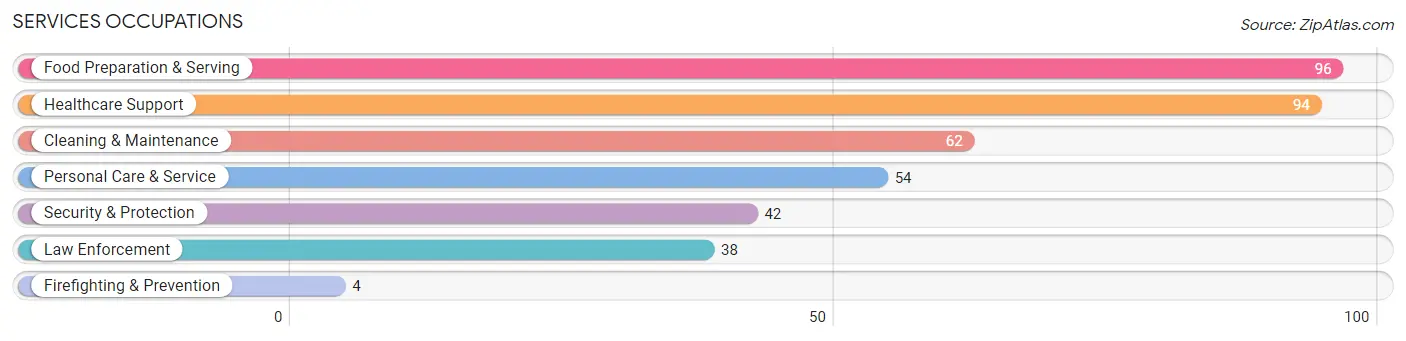
Services Occupations
The most common Services occupations in Easton are Food Preparation & Serving (96 | 8.1%), Healthcare Support (94 | 7.9%), Cleaning & Maintenance (62 | 5.2%), Personal Care & Service (54 | 4.5%), and Security & Protection (42 | 3.5%).
Services Occupations by Sex
Within the Services occupations in Easton, the most male-oriented occupations are Security & Protection (100.0%), Firefighting & Prevention (100.0%), and Law Enforcement (100.0%), while the most female-oriented occupations are Personal Care & Service (100.0%), Food Preparation & Serving (78.1%), and Healthcare Support (53.2%).
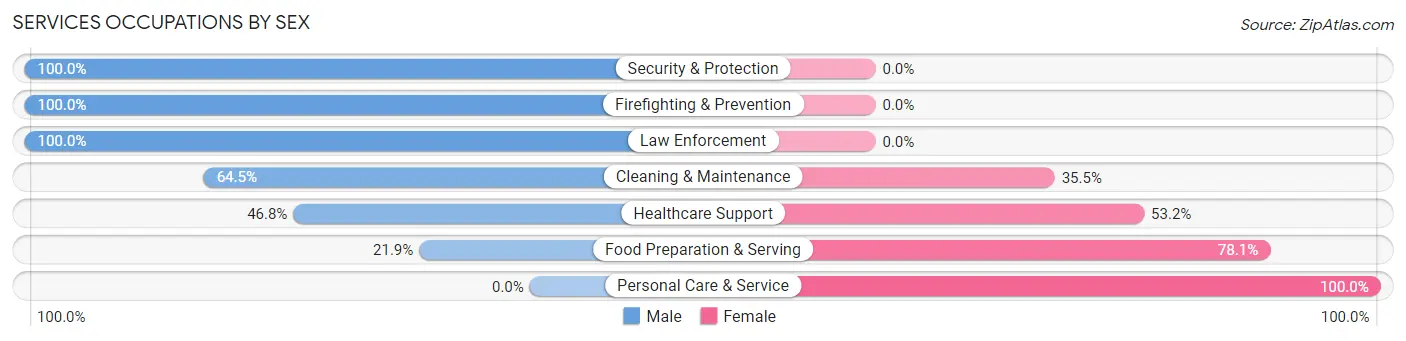
| Occupation | Male | Female |
| Healthcare Support | 44 (46.8%) | 50 (53.2%) |
| Security & Protection | 42 (100.0%) | 0 (0.0%) |
| Firefighting & Prevention | 4 (100.0%) | 0 (0.0%) |
| Law Enforcement | 38 (100.0%) | 0 (0.0%) |
| Food Preparation & Serving | 21 (21.9%) | 75 (78.1%) |
| Cleaning & Maintenance | 40 (64.5%) | 22 (35.5%) |
| Personal Care & Service | 0 (0.0%) | 54 (100.0%) |
| Total (Category) | 147 (42.2%) | 201 (57.8%) |
| Total (Overall) | 616 (51.9%) | 571 (48.1%) |
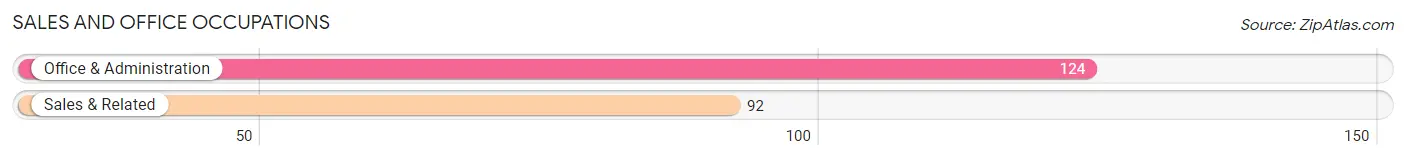
Sales and Office Occupations
The most common Sales and Office occupations in Easton are Office & Administration (124 | 10.4%), and Sales & Related (92 | 7.7%).
Sales and Office Occupations by Sex
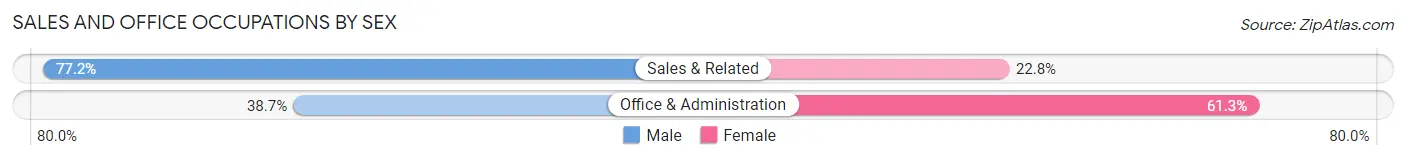
| Occupation | Male | Female |
| Sales & Related | 71 (77.2%) | 21 (22.8%) |
| Office & Administration | 48 (38.7%) | 76 (61.3%) |
| Total (Category) | 119 (55.1%) | 97 (44.9%) |
| Total (Overall) | 616 (51.9%) | 571 (48.1%) |
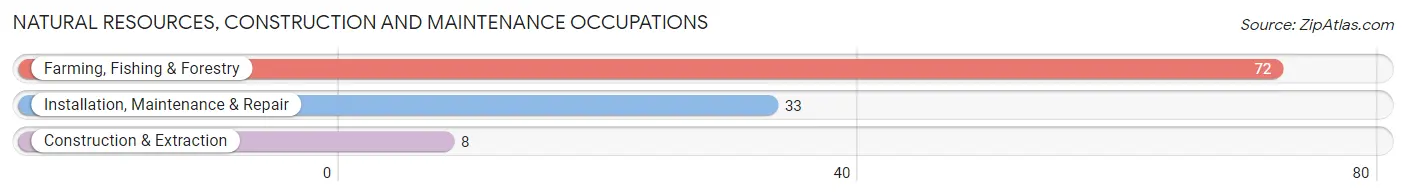
Natural Resources, Construction and Maintenance Occupations
The most common Natural Resources, Construction and Maintenance occupations in Easton are Farming, Fishing & Forestry (72 | 6.1%), Installation, Maintenance & Repair (33 | 2.8%), and Construction & Extraction (8 | 0.7%).
Natural Resources, Construction and Maintenance Occupations by Sex
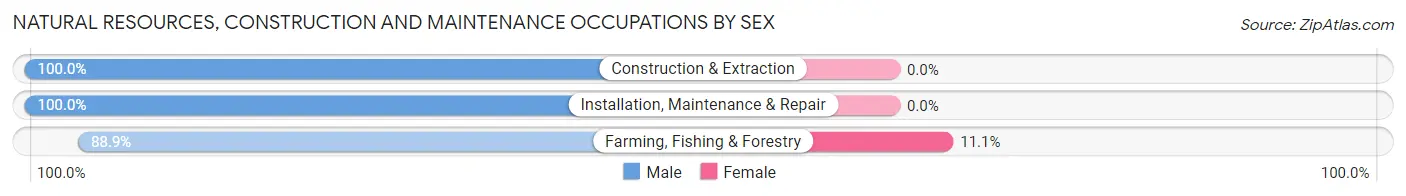
| Occupation | Male | Female |
| Farming, Fishing & Forestry | 64 (88.9%) | 8 (11.1%) |
| Construction & Extraction | 8 (100.0%) | 0 (0.0%) |
| Installation, Maintenance & Repair | 33 (100.0%) | 0 (0.0%) |
| Total (Category) | 105 (92.9%) | 8 (7.1%) |
| Total (Overall) | 616 (51.9%) | 571 (48.1%) |
Production, Transportation and Moving Occupations
The most common Production, Transportation and Moving occupations in Easton are Material Moving (48 | 4.0%), Transportation (47 | 4.0%), and Production (42 | 3.5%).
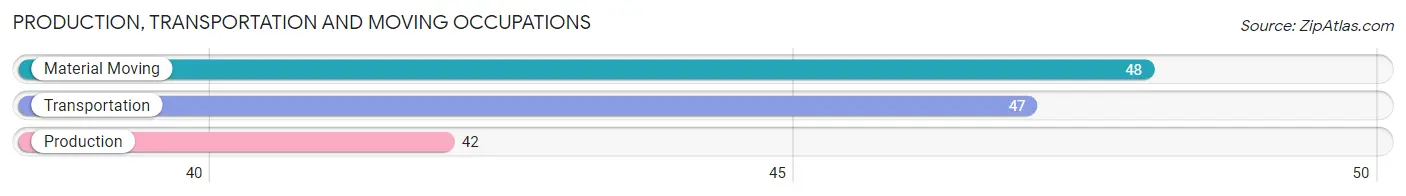
Production, Transportation and Moving Occupations by Sex
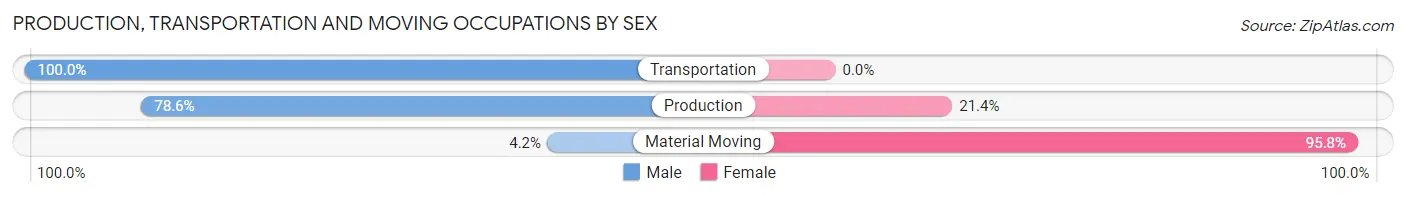
| Occupation | Male | Female |
| Production | 33 (78.6%) | 9 (21.4%) |
| Transportation | 47 (100.0%) | 0 (0.0%) |
| Material Moving | 2 (4.2%) | 46 (95.8%) |
| Total (Category) | 82 (59.9%) | 55 (40.2%) |
| Total (Overall) | 616 (51.9%) | 571 (48.1%) |
Employment Industries by Sex in Easton
Employment Industries in Easton
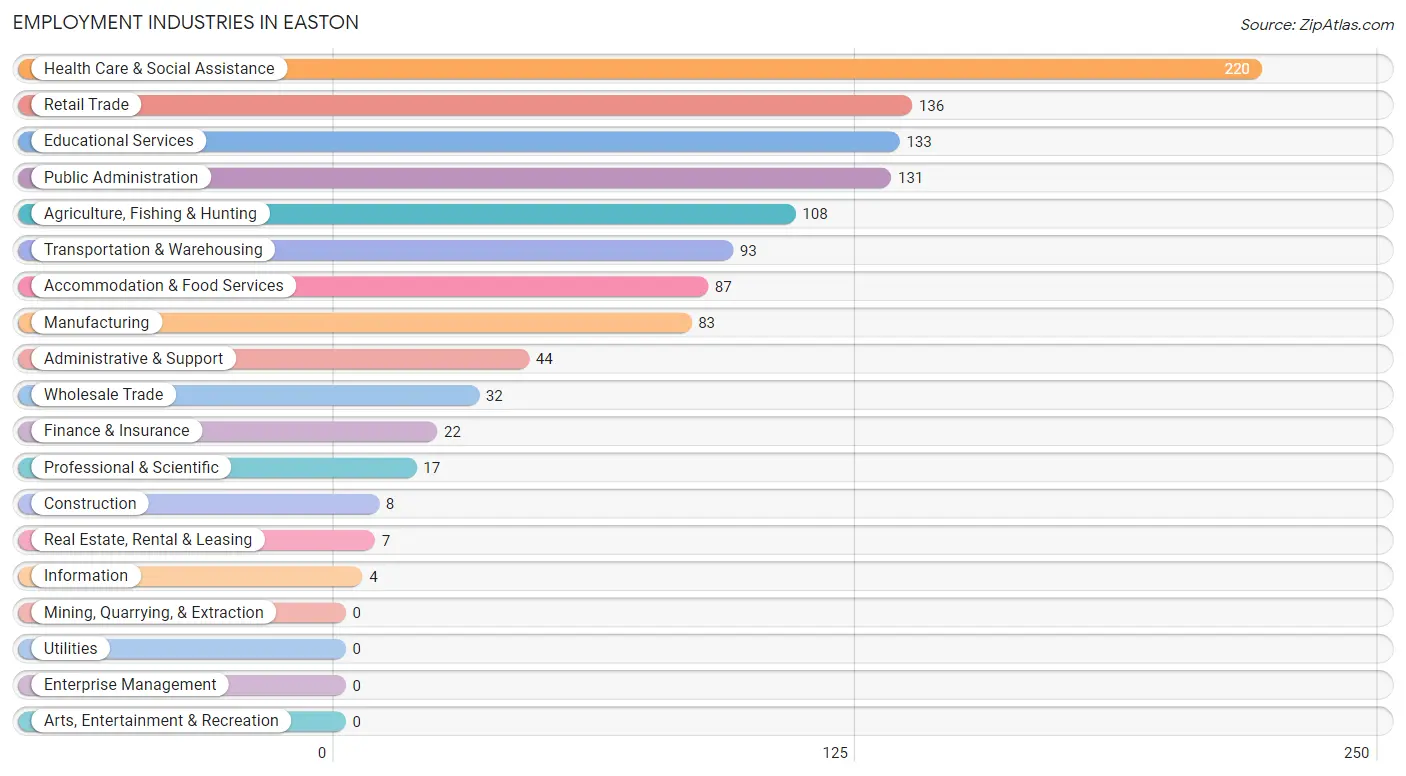
The major employment industries in Easton include Health Care & Social Assistance (220 | 18.5%), Retail Trade (136 | 11.5%), Educational Services (133 | 11.2%), Public Administration (131 | 11.0%), and Agriculture, Fishing & Hunting (108 | 9.1%).
Employment Industries by Sex in Easton
The Easton industries that see more men than women are Construction (100.0%), Real Estate, Rental & Leasing (100.0%), and Transportation & Warehousing (74.2%), whereas the industries that tend to have a higher number of women are Information (100.0%), Finance & Insurance (100.0%), and Wholesale Trade (81.2%).
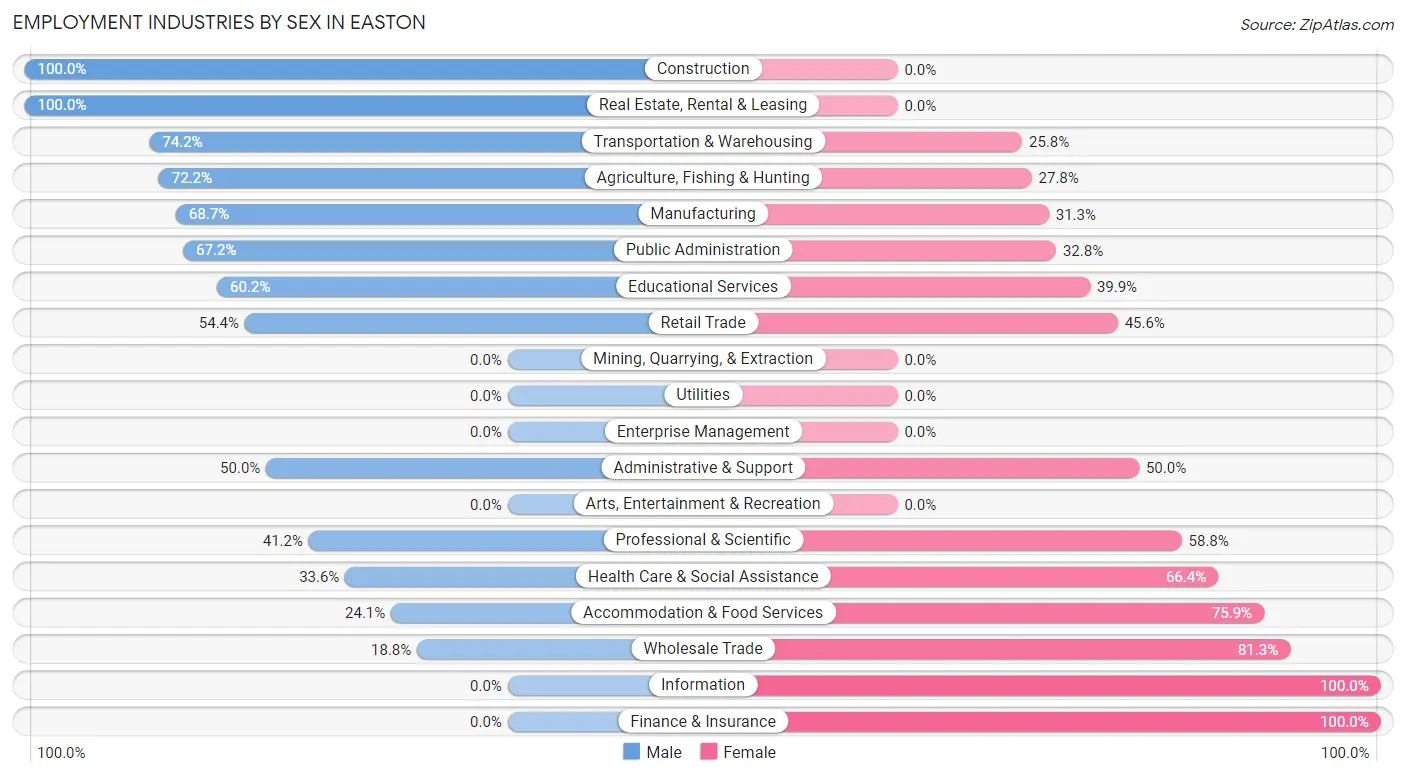
| Industry | Male | Female |
| Agriculture, Fishing & Hunting | 78 (72.2%) | 30 (27.8%) |
| Mining, Quarrying, & Extraction | 0 (0.0%) | 0 (0.0%) |
| Construction | 8 (100.0%) | 0 (0.0%) |
| Manufacturing | 57 (68.7%) | 26 (31.3%) |
| Wholesale Trade | 6 (18.8%) | 26 (81.2%) |
| Retail Trade | 74 (54.4%) | 62 (45.6%) |
| Transportation & Warehousing | 69 (74.2%) | 24 (25.8%) |
| Utilities | 0 (0.0%) | 0 (0.0%) |
| Information | 0 (0.0%) | 4 (100.0%) |
| Finance & Insurance | 0 (0.0%) | 22 (100.0%) |
| Real Estate, Rental & Leasing | 7 (100.0%) | 0 (0.0%) |
| Professional & Scientific | 7 (41.2%) | 10 (58.8%) |
| Enterprise Management | 0 (0.0%) | 0 (0.0%) |
| Administrative & Support | 22 (50.0%) | 22 (50.0%) |
| Educational Services | 80 (60.2%) | 53 (39.9%) |
| Health Care & Social Assistance | 74 (33.6%) | 146 (66.4%) |
| Arts, Entertainment & Recreation | 0 (0.0%) | 0 (0.0%) |
| Accommodation & Food Services | 21 (24.1%) | 66 (75.9%) |
| Public Administration | 88 (67.2%) | 43 (32.8%) |
| Total | 616 (51.9%) | 571 (48.1%) |
Education in Easton
School Enrollment in Easton
The most common levels of schooling among the 634 students in Easton are college / undergraduate (187 | 29.5%), middle school (156 | 24.6%), and high school (124 | 19.6%).
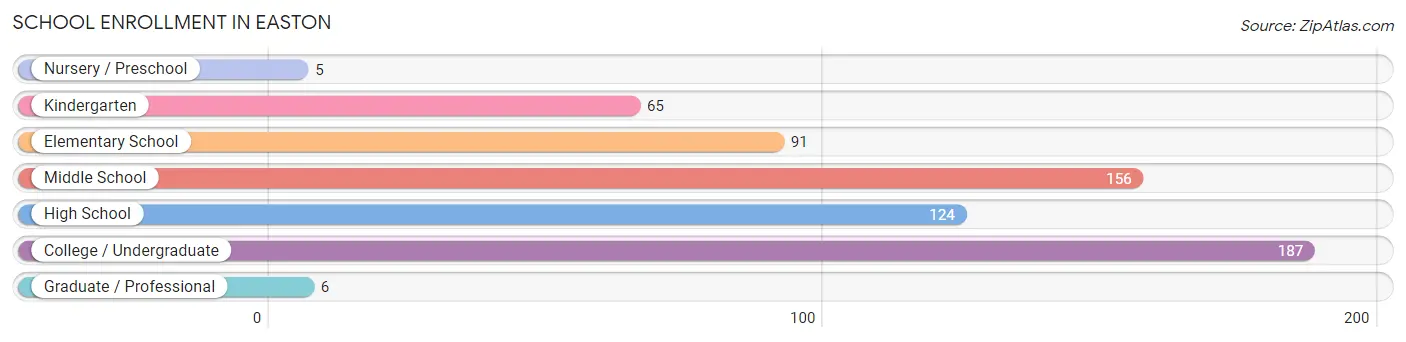
| School Level | # Students | % Students |
| Nursery / Preschool | 5 | 0.8% |
| Kindergarten | 65 | 10.2% |
| Elementary School | 91 | 14.3% |
| Middle School | 156 | 24.6% |
| High School | 124 | 19.6% |
| College / Undergraduate | 187 | 29.5% |
| Graduate / Professional | 6 | 0.9% |
| Total | 634 | 100.0% |
School Enrollment by Age by Funding Source in Easton
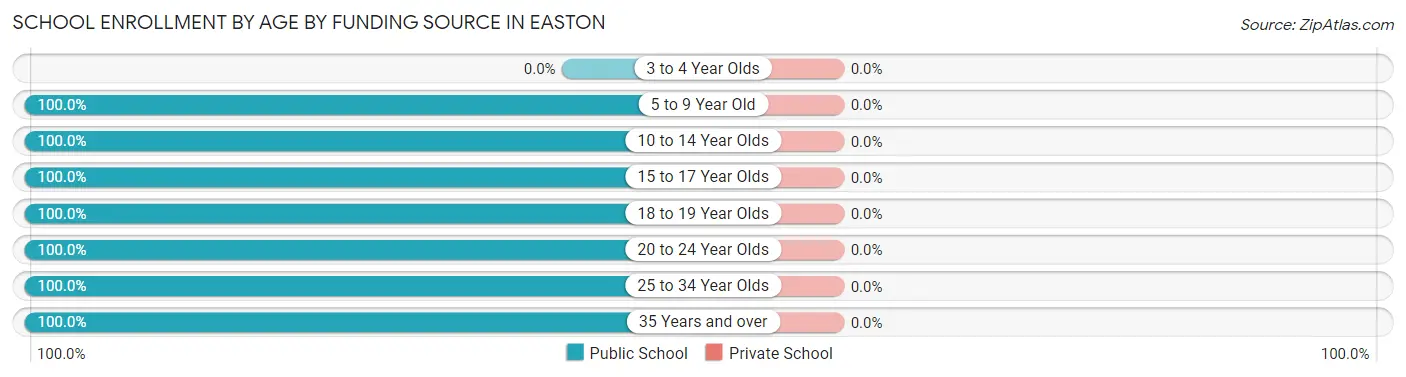
| Age Bracket | Public School | Private School |
| 3 to 4 Year Olds | 0 (0.0%) | 0 (0.0%) |
| 5 to 9 Year Old | 118 (100.0%) | 0 (0.0%) |
| 10 to 14 Year Olds | 199 (100.0%) | 0 (0.0%) |
| 15 to 17 Year Olds | 124 (100.0%) | 0 (0.0%) |
| 18 to 19 Year Olds | 16 (100.0%) | 0 (0.0%) |
| 20 to 24 Year Olds | 117 (100.0%) | 0 (0.0%) |
| 25 to 34 Year Olds | 54 (100.0%) | 0 (0.0%) |
| 35 Years and over | 6 (100.0%) | 0 (0.0%) |
| Total | 634 (100.0%) | 0 (0.0%) |
Educational Attainment by Field of Study in Easton
Science & technology (70 | 22.3%), computers & mathematics (49 | 15.6%), education (47 | 15.0%), business (44 | 14.0%), and arts & humanities (35 | 11.2%) are the most common fields of study among 314 individuals in Easton who have obtained a bachelor's degree or higher.
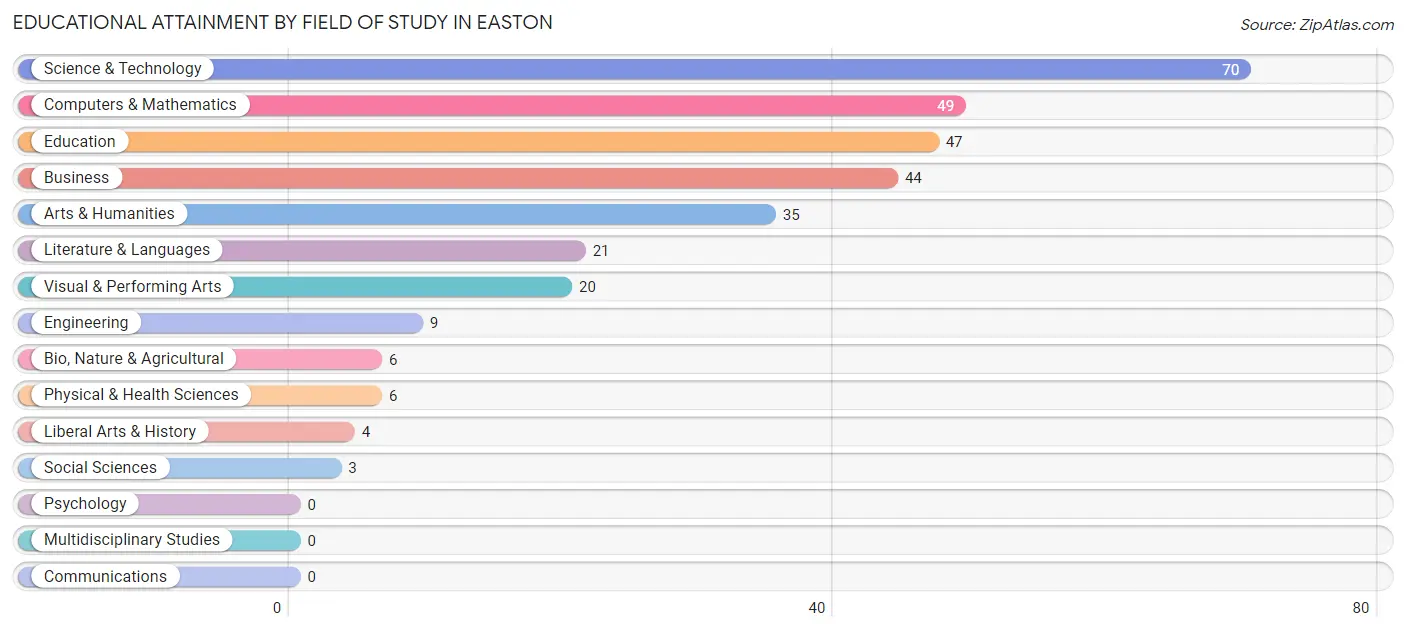
| Field of Study | # Graduates | % Graduates |
| Computers & Mathematics | 49 | 15.6% |
| Bio, Nature & Agricultural | 6 | 1.9% |
| Physical & Health Sciences | 6 | 1.9% |
| Psychology | 0 | 0.0% |
| Social Sciences | 3 | 1.0% |
| Engineering | 9 | 2.9% |
| Multidisciplinary Studies | 0 | 0.0% |
| Science & Technology | 70 | 22.3% |
| Business | 44 | 14.0% |
| Education | 47 | 15.0% |
| Literature & Languages | 21 | 6.7% |
| Liberal Arts & History | 4 | 1.3% |
| Visual & Performing Arts | 20 | 6.4% |
| Communications | 0 | 0.0% |
| Arts & Humanities | 35 | 11.2% |
| Total | 314 | 100.0% |
Transportation & Commute in Easton
Vehicle Availability by Sex in Easton
The most prevalent vehicle ownership categories in Easton are males with 2 vehicles (170, accounting for 28.6%) and females with 2 vehicles (215, making up 30.1%).
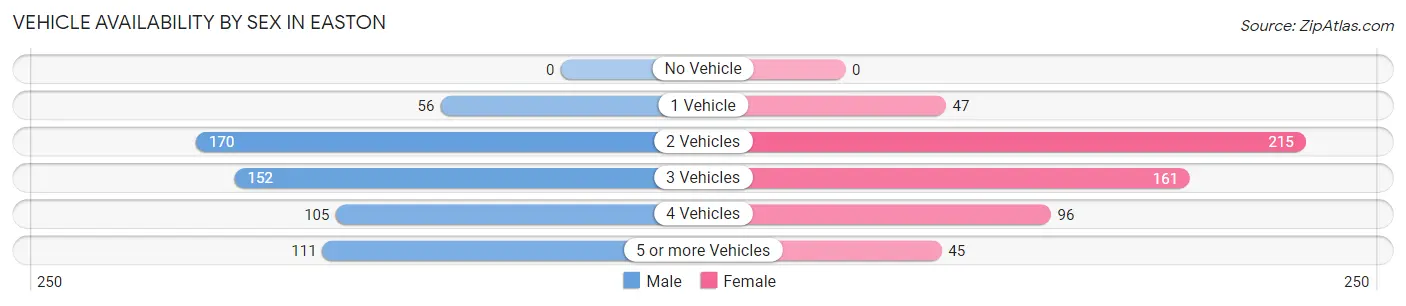
| Vehicles Available | Male | Female |
| No Vehicle | 0 (0.0%) | 0 (0.0%) |
| 1 Vehicle | 56 (9.4%) | 47 (8.3%) |
| 2 Vehicles | 170 (28.6%) | 215 (38.1%) |
| 3 Vehicles | 152 (25.6%) | 161 (28.5%) |
| 4 Vehicles | 105 (17.7%) | 96 (17.0%) |
| 5 or more Vehicles | 111 (18.7%) | 45 (8.0%) |
| Total | 594 (100.0%) | 564 (100.0%) |
Commute Time in Easton
The most frequently occuring commute durations in Easton are 20 to 24 minutes (179 commuters, 18.8%), 15 to 19 minutes (171 commuters, 18.0%), and 5 to 9 minutes (134 commuters, 14.1%).
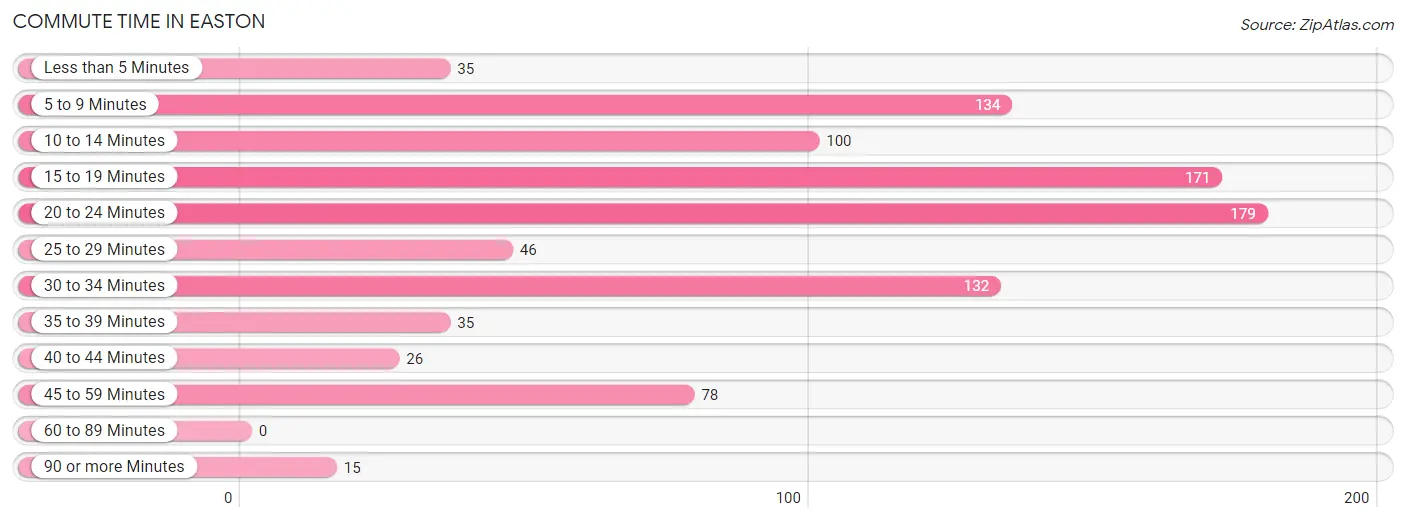
| Commute Time | # Commuters | % Commuters |
| Less than 5 Minutes | 35 | 3.7% |
| 5 to 9 Minutes | 134 | 14.1% |
| 10 to 14 Minutes | 100 | 10.5% |
| 15 to 19 Minutes | 171 | 18.0% |
| 20 to 24 Minutes | 179 | 18.8% |
| 25 to 29 Minutes | 46 | 4.8% |
| 30 to 34 Minutes | 132 | 13.9% |
| 35 to 39 Minutes | 35 | 3.7% |
| 40 to 44 Minutes | 26 | 2.7% |
| 45 to 59 Minutes | 78 | 8.2% |
| 60 to 89 Minutes | 0 | 0.0% |
| 90 or more Minutes | 15 | 1.6% |
Commute Time by Sex in Easton
The most common commute times in Easton are 15 to 19 minutes (115 commuters, 22.9%) for males and 10 to 14 minutes (78 commuters, 17.4%) for females.
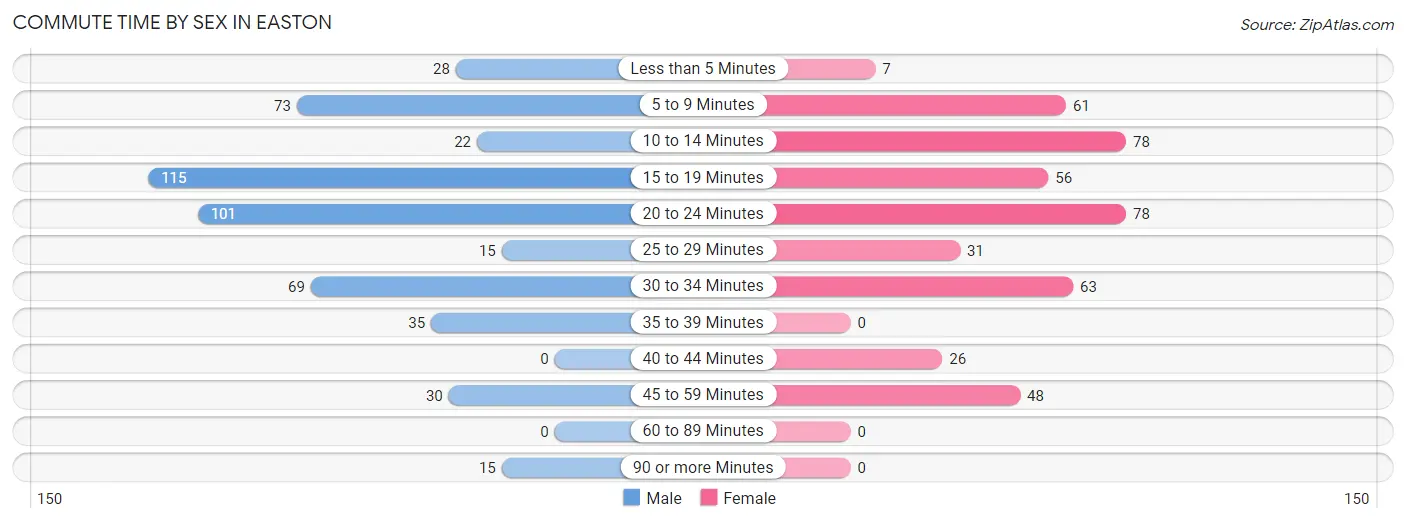
| Commute Time | Male | Female |
| Less than 5 Minutes | 28 (5.6%) | 7 (1.6%) |
| 5 to 9 Minutes | 73 (14.5%) | 61 (13.6%) |
| 10 to 14 Minutes | 22 (4.4%) | 78 (17.4%) |
| 15 to 19 Minutes | 115 (22.9%) | 56 (12.5%) |
| 20 to 24 Minutes | 101 (20.1%) | 78 (17.4%) |
| 25 to 29 Minutes | 15 (3.0%) | 31 (6.9%) |
| 30 to 34 Minutes | 69 (13.7%) | 63 (14.1%) |
| 35 to 39 Minutes | 35 (7.0%) | 0 (0.0%) |
| 40 to 44 Minutes | 0 (0.0%) | 26 (5.8%) |
| 45 to 59 Minutes | 30 (6.0%) | 48 (10.7%) |
| 60 to 89 Minutes | 0 (0.0%) | 0 (0.0%) |
| 90 or more Minutes | 15 (3.0%) | 0 (0.0%) |
Time of Departure to Work by Sex in Easton
The most frequent times of departure to work in Easton are 7:00 AM to 7:29 AM (138, 27.4%) for males and 7:00 AM to 7:29 AM (206, 46.0%) for females.
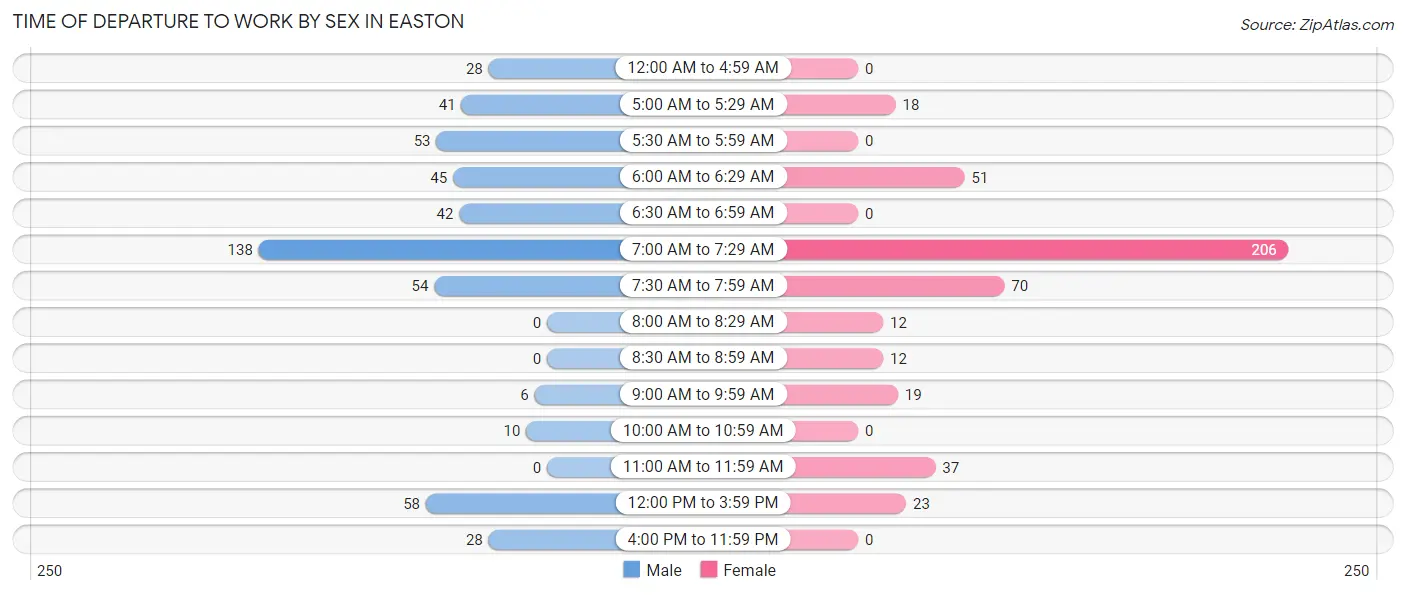
| Time of Departure | Male | Female |
| 12:00 AM to 4:59 AM | 28 (5.6%) | 0 (0.0%) |
| 5:00 AM to 5:29 AM | 41 (8.2%) | 18 (4.0%) |
| 5:30 AM to 5:59 AM | 53 (10.5%) | 0 (0.0%) |
| 6:00 AM to 6:29 AM | 45 (8.9%) | 51 (11.4%) |
| 6:30 AM to 6:59 AM | 42 (8.4%) | 0 (0.0%) |
| 7:00 AM to 7:29 AM | 138 (27.4%) | 206 (46.0%) |
| 7:30 AM to 7:59 AM | 54 (10.7%) | 70 (15.6%) |
| 8:00 AM to 8:29 AM | 0 (0.0%) | 12 (2.7%) |
| 8:30 AM to 8:59 AM | 0 (0.0%) | 12 (2.7%) |
| 9:00 AM to 9:59 AM | 6 (1.2%) | 19 (4.2%) |
| 10:00 AM to 10:59 AM | 10 (2.0%) | 0 (0.0%) |
| 11:00 AM to 11:59 AM | 0 (0.0%) | 37 (8.3%) |
| 12:00 PM to 3:59 PM | 58 (11.5%) | 23 (5.1%) |
| 4:00 PM to 11:59 PM | 28 (5.6%) | 0 (0.0%) |
| Total | 503 (100.0%) | 448 (100.0%) |
Housing Occupancy in Easton
Occupancy by Ownership in Easton
Of the total 626 dwellings in Easton, owner-occupied units account for 417 (66.6%), while renter-occupied units make up 209 (33.4%).
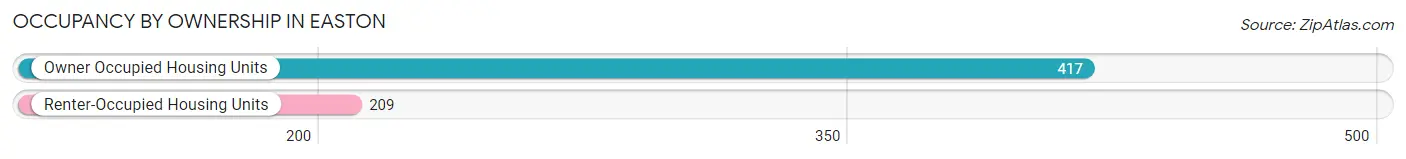
| Occupancy | # Housing Units | % Housing Units |
| Owner Occupied Housing Units | 417 | 66.6% |
| Renter-Occupied Housing Units | 209 | 33.4% |
| Total Occupied Housing Units | 626 | 100.0% |
Occupancy by Household Size in Easton
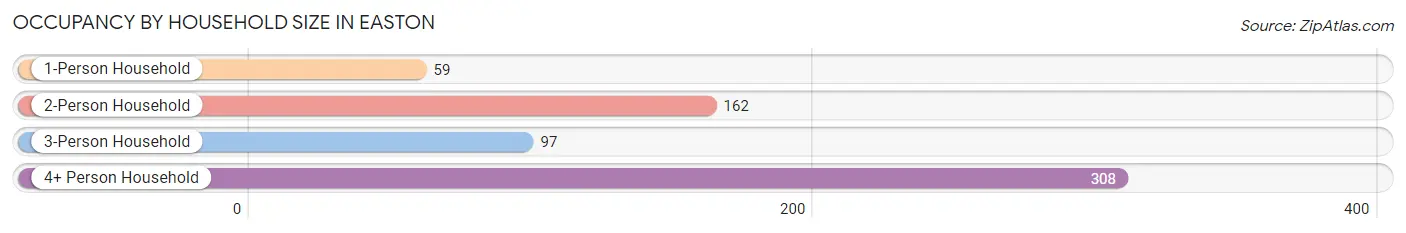
| Household Size | # Housing Units | % Housing Units |
| 1-Person Household | 59 | 9.4% |
| 2-Person Household | 162 | 25.9% |
| 3-Person Household | 97 | 15.5% |
| 4+ Person Household | 308 | 49.2% |
| Total Housing Units | 626 | 100.0% |
Occupancy by Ownership by Household Size in Easton
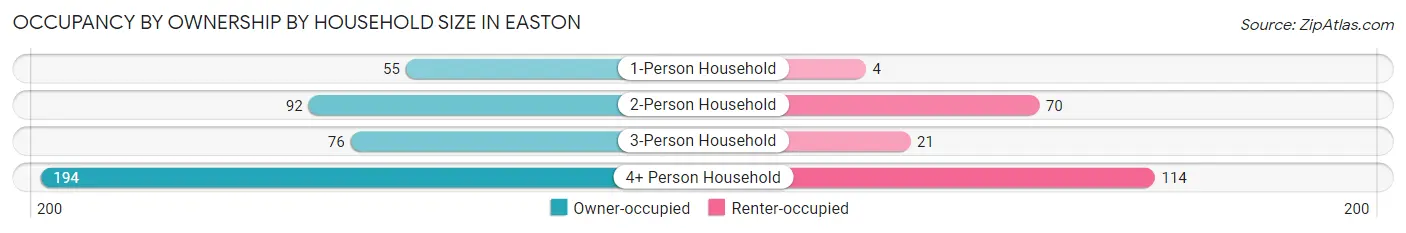
| Household Size | Owner-occupied | Renter-occupied |
| 1-Person Household | 55 (93.2%) | 4 (6.8%) |
| 2-Person Household | 92 (56.8%) | 70 (43.2%) |
| 3-Person Household | 76 (78.3%) | 21 (21.6%) |
| 4+ Person Household | 194 (63.0%) | 114 (37.0%) |
| Total Housing Units | 417 (66.6%) | 209 (33.4%) |
Occupancy by Educational Attainment in Easton
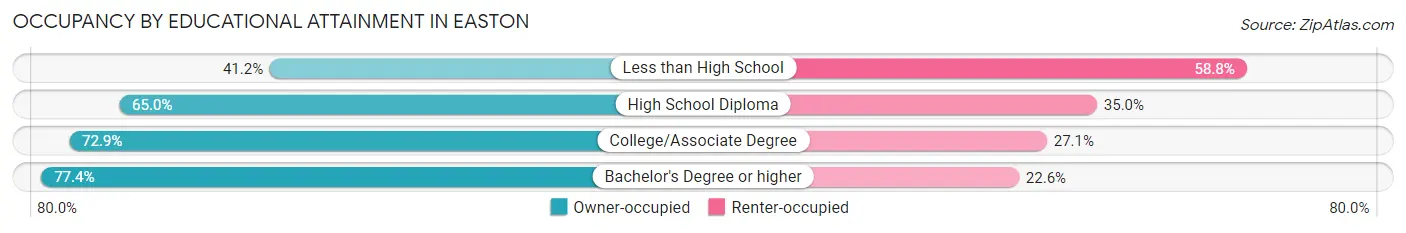
| Household Size | Owner-occupied | Renter-occupied |
| Less than High School | 40 (41.2%) | 57 (58.8%) |
| High School Diploma | 130 (65.0%) | 70 (35.0%) |
| College/Associate Degree | 124 (72.9%) | 46 (27.1%) |
| Bachelor's Degree or higher | 123 (77.4%) | 36 (22.6%) |
Occupancy by Age of Householder in Easton
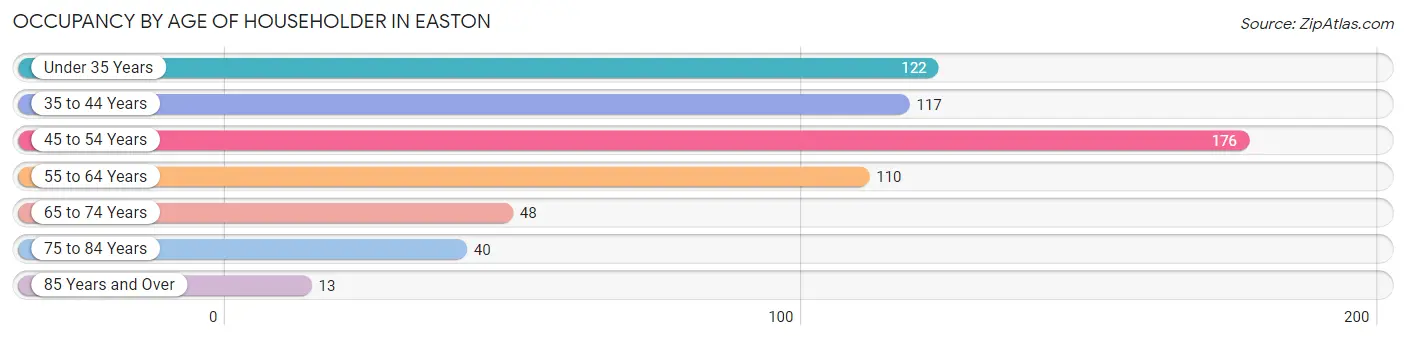
| Age Bracket | # Households | % Households |
| Under 35 Years | 122 | 19.5% |
| 35 to 44 Years | 117 | 18.7% |
| 45 to 54 Years | 176 | 28.1% |
| 55 to 64 Years | 110 | 17.6% |
| 65 to 74 Years | 48 | 7.7% |
| 75 to 84 Years | 40 | 6.4% |
| 85 Years and Over | 13 | 2.1% |
| Total | 626 | 100.0% |
Housing Finances in Easton
Median Income by Occupancy in Easton
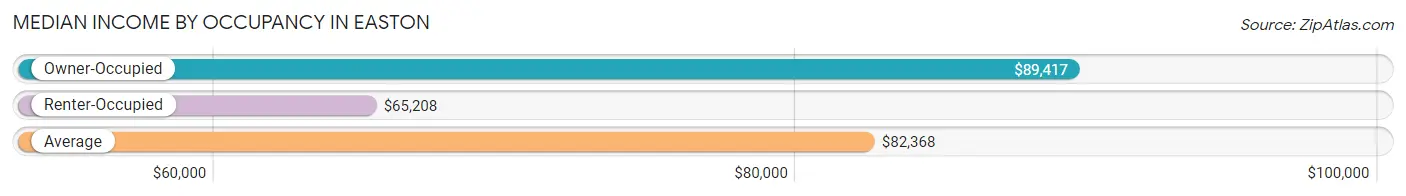
| Occupancy Type | # Households | Median Income |
| Owner-Occupied | 417 (66.6%) | $89,417 |
| Renter-Occupied | 209 (33.4%) | $65,208 |
| Average | 626 (100.0%) | $82,368 |
Occupancy by Householder Income Bracket in Easton
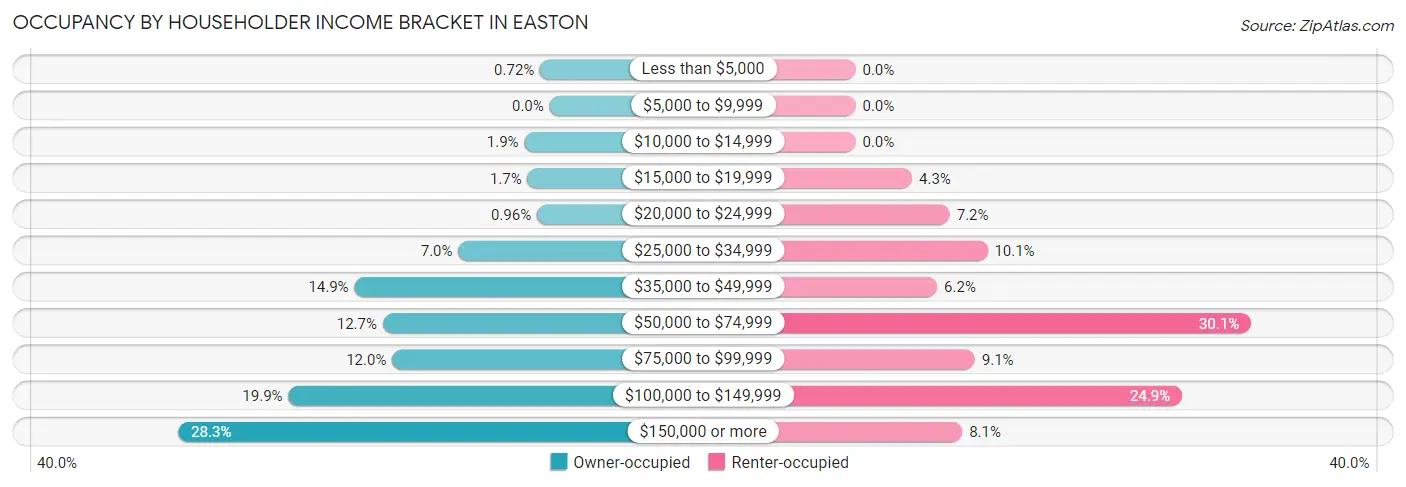
| Income Bracket | Owner-occupied | Renter-occupied |
| Less than $5,000 | 3 (0.7%) | 0 (0.0%) |
| $5,000 to $9,999 | 0 (0.0%) | 0 (0.0%) |
| $10,000 to $14,999 | 8 (1.9%) | 0 (0.0%) |
| $15,000 to $19,999 | 7 (1.7%) | 9 (4.3%) |
| $20,000 to $24,999 | 4 (1.0%) | 15 (7.2%) |
| $25,000 to $34,999 | 29 (7.0%) | 21 (10.1%) |
| $35,000 to $49,999 | 62 (14.9%) | 13 (6.2%) |
| $50,000 to $74,999 | 53 (12.7%) | 63 (30.1%) |
| $75,000 to $99,999 | 50 (12.0%) | 19 (9.1%) |
| $100,000 to $149,999 | 83 (19.9%) | 52 (24.9%) |
| $150,000 or more | 118 (28.3%) | 17 (8.1%) |
| Total | 417 (100.0%) | 209 (100.0%) |
Monthly Housing Cost Tiers in Easton
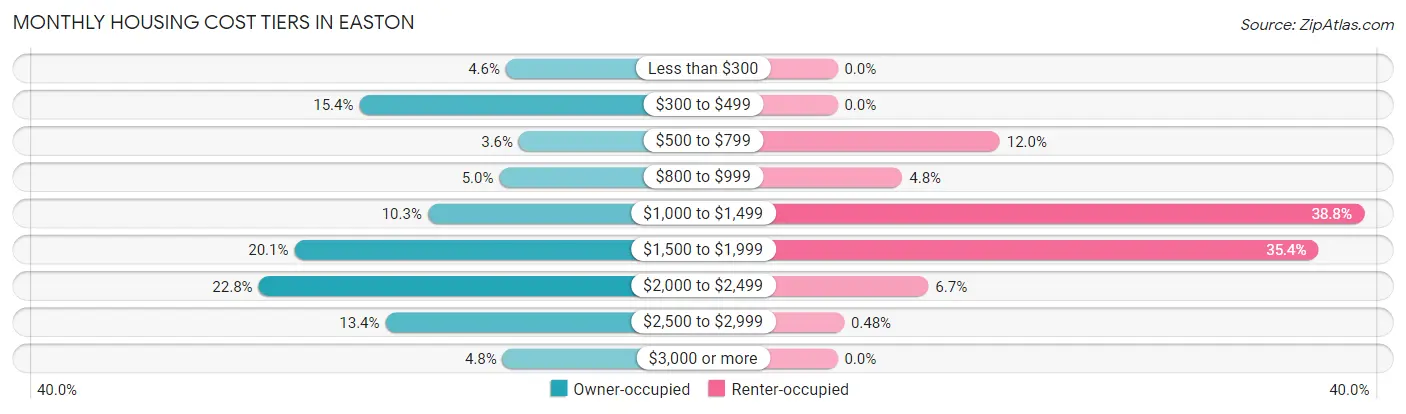
| Monthly Cost | Owner-occupied | Renter-occupied |
| Less than $300 | 19 (4.6%) | 0 (0.0%) |
| $300 to $499 | 64 (15.3%) | 0 (0.0%) |
| $500 to $799 | 15 (3.6%) | 25 (12.0%) |
| $800 to $999 | 21 (5.0%) | 10 (4.8%) |
| $1,000 to $1,499 | 43 (10.3%) | 81 (38.8%) |
| $1,500 to $1,999 | 84 (20.1%) | 74 (35.4%) |
| $2,000 to $2,499 | 95 (22.8%) | 14 (6.7%) |
| $2,500 to $2,999 | 56 (13.4%) | 1 (0.5%) |
| $3,000 or more | 20 (4.8%) | 0 (0.0%) |
| Total | 417 (100.0%) | 209 (100.0%) |
Physical Housing Characteristics in Easton
Housing Structures in Easton
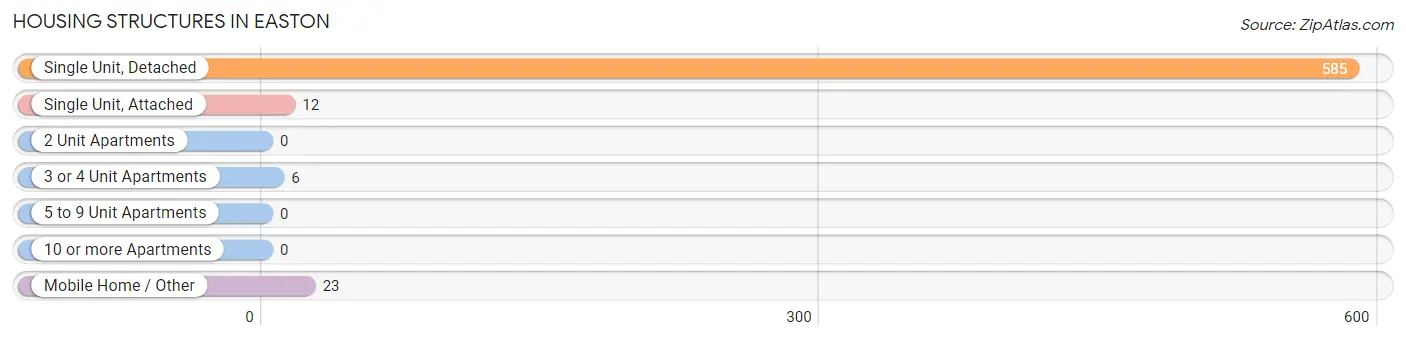
| Structure Type | # Housing Units | % Housing Units |
| Single Unit, Detached | 585 | 93.4% |
| Single Unit, Attached | 12 | 1.9% |
| 2 Unit Apartments | 0 | 0.0% |
| 3 or 4 Unit Apartments | 6 | 1.0% |
| 5 to 9 Unit Apartments | 0 | 0.0% |
| 10 or more Apartments | 0 | 0.0% |
| Mobile Home / Other | 23 | 3.7% |
| Total | 626 | 100.0% |
Housing Structures by Occupancy in Easton
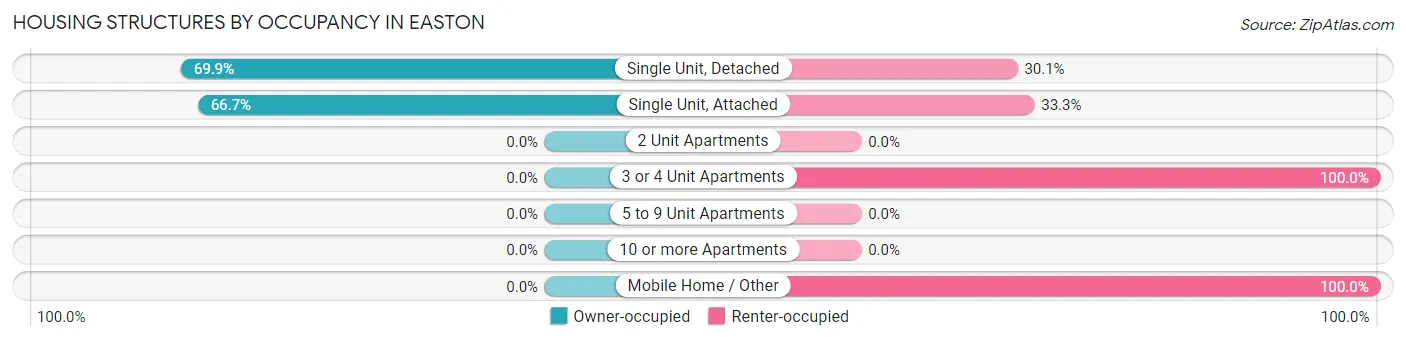
| Structure Type | Owner-occupied | Renter-occupied |
| Single Unit, Detached | 409 (69.9%) | 176 (30.1%) |
| Single Unit, Attached | 8 (66.7%) | 4 (33.3%) |
| 2 Unit Apartments | 0 (0.0%) | 0 (0.0%) |
| 3 or 4 Unit Apartments | 0 (0.0%) | 6 (100.0%) |
| 5 to 9 Unit Apartments | 0 (0.0%) | 0 (0.0%) |
| 10 or more Apartments | 0 (0.0%) | 0 (0.0%) |
| Mobile Home / Other | 0 (0.0%) | 23 (100.0%) |
| Total | 417 (66.6%) | 209 (33.4%) |
Housing Structures by Number of Rooms in Easton
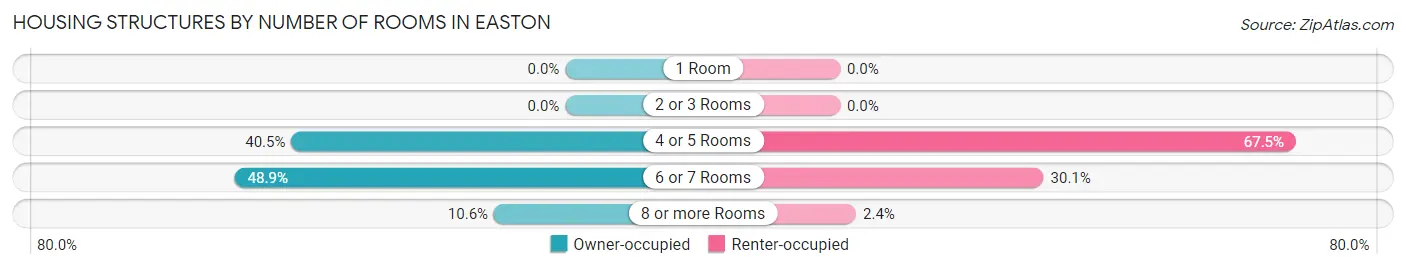
| Number of Rooms | Owner-occupied | Renter-occupied |
| 1 Room | 0 (0.0%) | 0 (0.0%) |
| 2 or 3 Rooms | 0 (0.0%) | 0 (0.0%) |
| 4 or 5 Rooms | 169 (40.5%) | 141 (67.5%) |
| 6 or 7 Rooms | 204 (48.9%) | 63 (30.1%) |
| 8 or more Rooms | 44 (10.5%) | 5 (2.4%) |
| Total | 417 (100.0%) | 209 (100.0%) |
Housing Structure by Heating Type in Easton
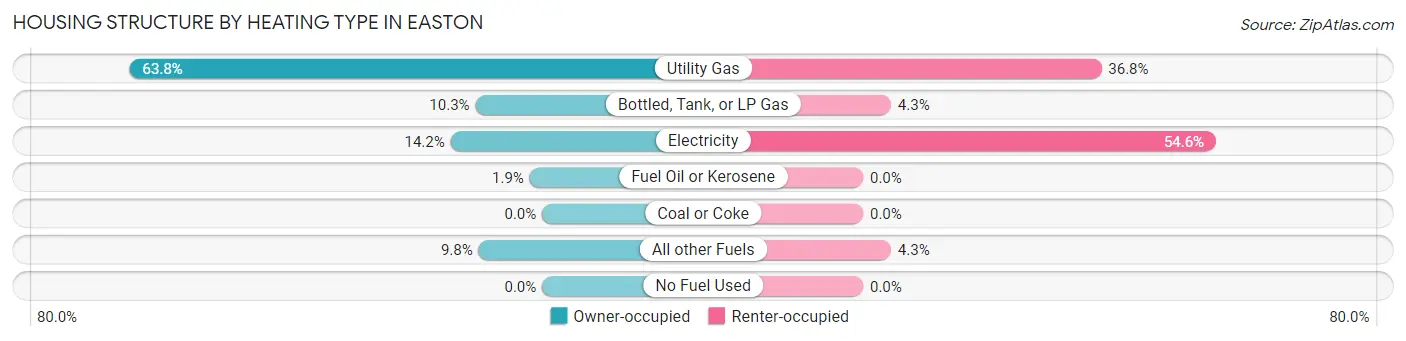
| Heating Type | Owner-occupied | Renter-occupied |
| Utility Gas | 266 (63.8%) | 77 (36.8%) |
| Bottled, Tank, or LP Gas | 43 (10.3%) | 9 (4.3%) |
| Electricity | 59 (14.1%) | 114 (54.5%) |
| Fuel Oil or Kerosene | 8 (1.9%) | 0 (0.0%) |
| Coal or Coke | 0 (0.0%) | 0 (0.0%) |
| All other Fuels | 41 (9.8%) | 9 (4.3%) |
| No Fuel Used | 0 (0.0%) | 0 (0.0%) |
| Total | 417 (100.0%) | 209 (100.0%) |
Household Vehicle Usage in Easton
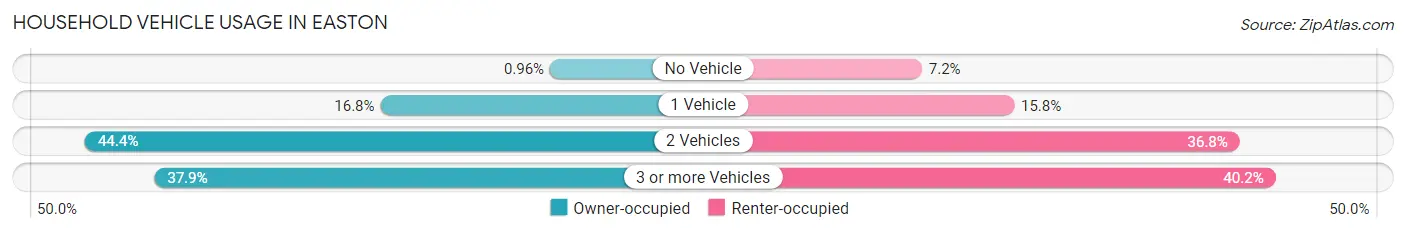
| Vehicles per Household | Owner-occupied | Renter-occupied |
| No Vehicle | 4 (1.0%) | 15 (7.2%) |
| 1 Vehicle | 70 (16.8%) | 33 (15.8%) |
| 2 Vehicles | 185 (44.4%) | 77 (36.8%) |
| 3 or more Vehicles | 158 (37.9%) | 84 (40.2%) |
| Total | 417 (100.0%) | 209 (100.0%) |
Real Estate & Mortgages in Easton
Real Estate and Mortgage Overview in Easton
| Characteristic | Without Mortgage | With Mortgage |
| Housing Units | 104 | 313 |
| Median Property Value | $192,900 | $305,000 |
| Median Household Income | $72,083 | $111 |
| Monthly Housing Costs | $428 | $20 |
| Real Estate Taxes | $1,109 | $12 |
Property Value by Mortgage Status in Easton
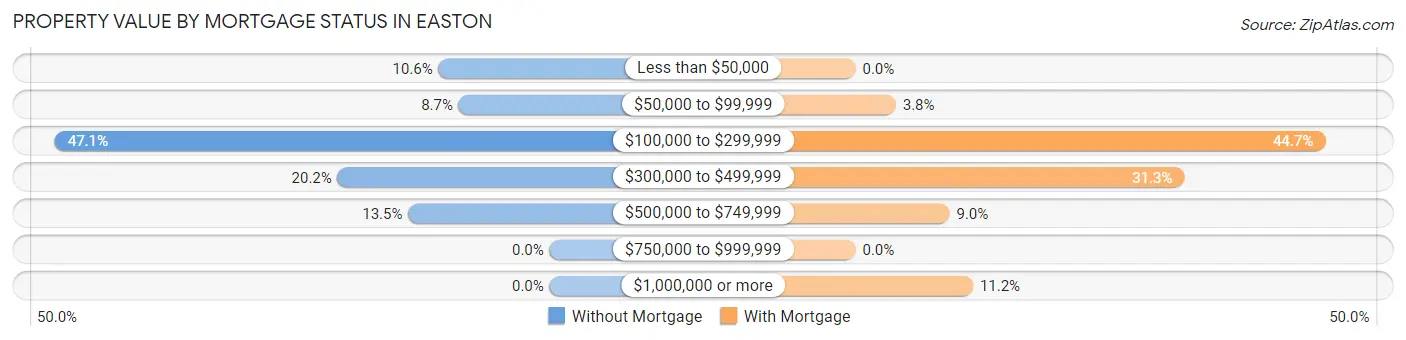
| Property Value | Without Mortgage | With Mortgage |
| Less than $50,000 | 11 (10.6%) | 0 (0.0%) |
| $50,000 to $99,999 | 9 (8.6%) | 12 (3.8%) |
| $100,000 to $299,999 | 49 (47.1%) | 140 (44.7%) |
| $300,000 to $499,999 | 21 (20.2%) | 98 (31.3%) |
| $500,000 to $749,999 | 14 (13.5%) | 28 (8.9%) |
| $750,000 to $999,999 | 0 (0.0%) | 0 (0.0%) |
| $1,000,000 or more | 0 (0.0%) | 35 (11.2%) |
| Total | 104 (100.0%) | 313 (100.0%) |
Household Income by Mortgage Status in Easton
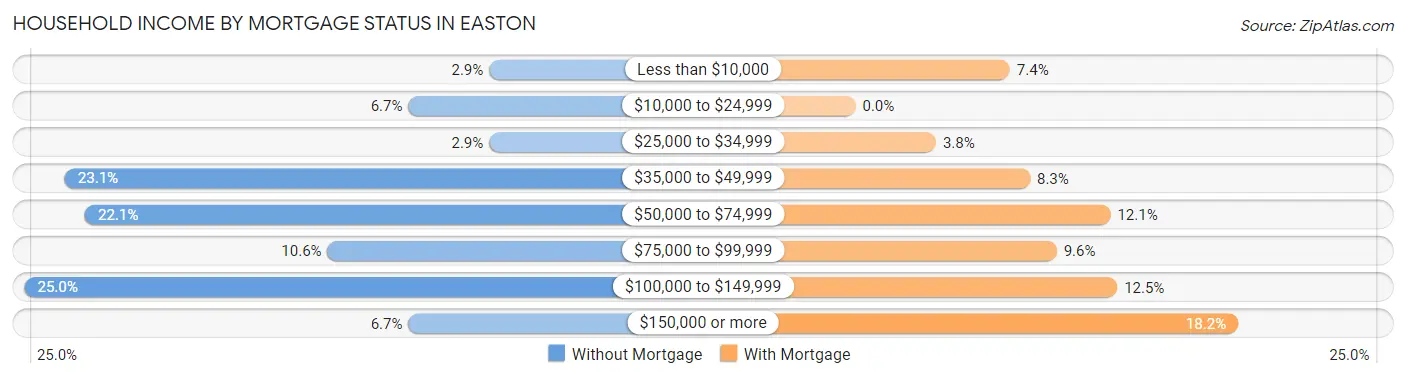
| Household Income | Without Mortgage | With Mortgage |
| Less than $10,000 | 3 (2.9%) | 23 (7.3%) |
| $10,000 to $24,999 | 7 (6.7%) | 0 (0.0%) |
| $25,000 to $34,999 | 3 (2.9%) | 12 (3.8%) |
| $35,000 to $49,999 | 24 (23.1%) | 26 (8.3%) |
| $50,000 to $74,999 | 23 (22.1%) | 38 (12.1%) |
| $75,000 to $99,999 | 11 (10.6%) | 30 (9.6%) |
| $100,000 to $149,999 | 26 (25.0%) | 39 (12.5%) |
| $150,000 or more | 7 (6.7%) | 57 (18.2%) |
| Total | 104 (100.0%) | 313 (100.0%) |
Property Value to Household Income Ratio in Easton
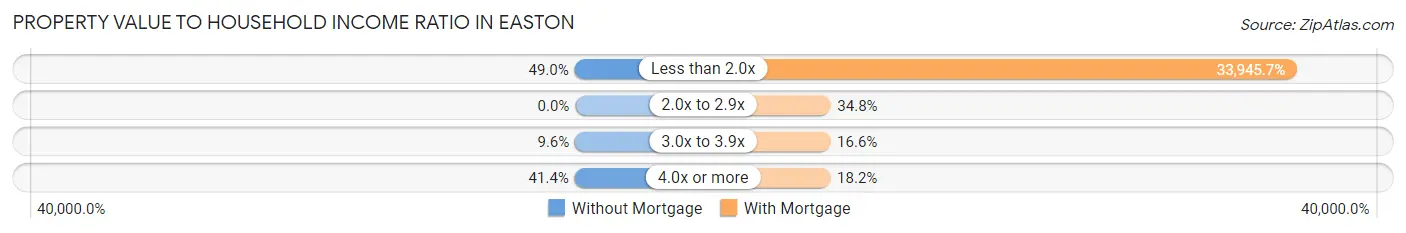
| Value-to-Income Ratio | Without Mortgage | With Mortgage |
| Less than 2.0x | 51 (49.0%) | 106,250 (33,945.7%) |
| 2.0x to 2.9x | 0 (0.0%) | 109 (34.8%) |
| 3.0x to 3.9x | 10 (9.6%) | 52 (16.6%) |
| 4.0x or more | 43 (41.3%) | 57 (18.2%) |
| Total | 104 (100.0%) | 313 (100.0%) |
Real Estate Taxes by Mortgage Status in Easton
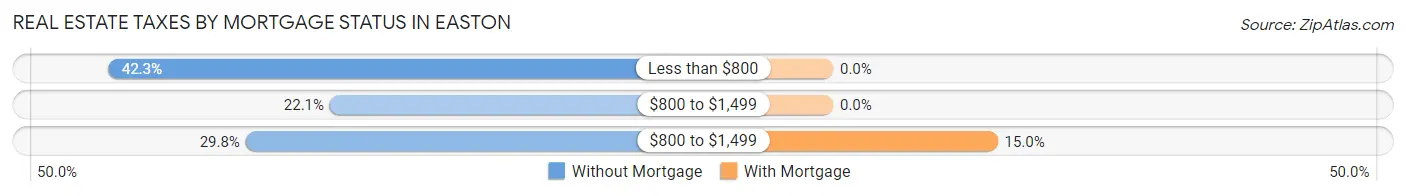
| Property Taxes | Without Mortgage | With Mortgage |
| Less than $800 | 44 (42.3%) | 0 (0.0%) |
| $800 to $1,499 | 23 (22.1%) | 0 (0.0%) |
| $800 to $1,499 | 31 (29.8%) | 47 (15.0%) |
| Total | 104 (100.0%) | 313 (100.0%) |
Health & Disability in Easton
Health Insurance Coverage by Age in Easton
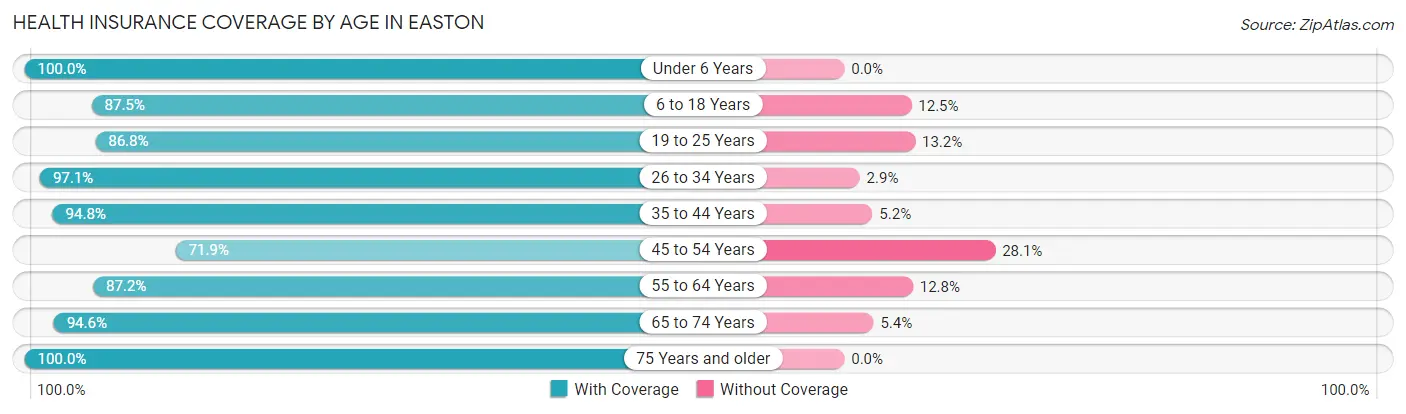
| Age Bracket | With Coverage | Without Coverage |
| Under 6 Years | 243 (100.0%) | 0 (0.0%) |
| 6 to 18 Years | 364 (87.5%) | 52 (12.5%) |
| 19 to 25 Years | 250 (86.8%) | 38 (13.2%) |
| 26 to 34 Years | 338 (97.1%) | 10 (2.9%) |
| 35 to 44 Years | 235 (94.8%) | 13 (5.2%) |
| 45 to 54 Years | 286 (71.9%) | 112 (28.1%) |
| 55 to 64 Years | 239 (87.2%) | 35 (12.8%) |
| 65 to 74 Years | 139 (94.6%) | 8 (5.4%) |
| 75 Years and older | 92 (100.0%) | 0 (0.0%) |
| Total | 2,186 (89.1%) | 268 (10.9%) |
Health Insurance Coverage by Citizenship Status in Easton
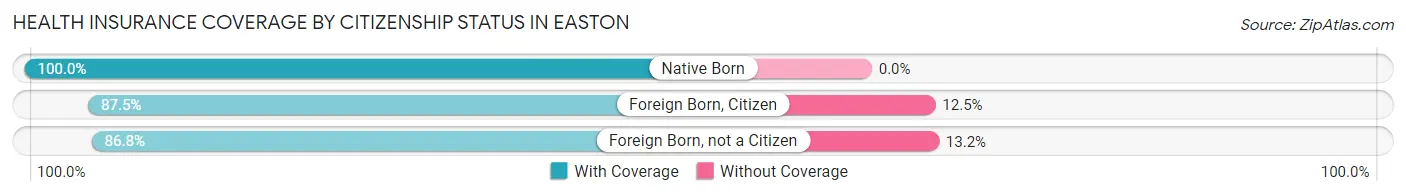
| Citizenship Status | With Coverage | Without Coverage |
| Native Born | 243 (100.0%) | 0 (0.0%) |
| Foreign Born, Citizen | 364 (87.5%) | 52 (12.5%) |
| Foreign Born, not a Citizen | 250 (86.8%) | 38 (13.2%) |
Health Insurance Coverage by Household Income in Easton
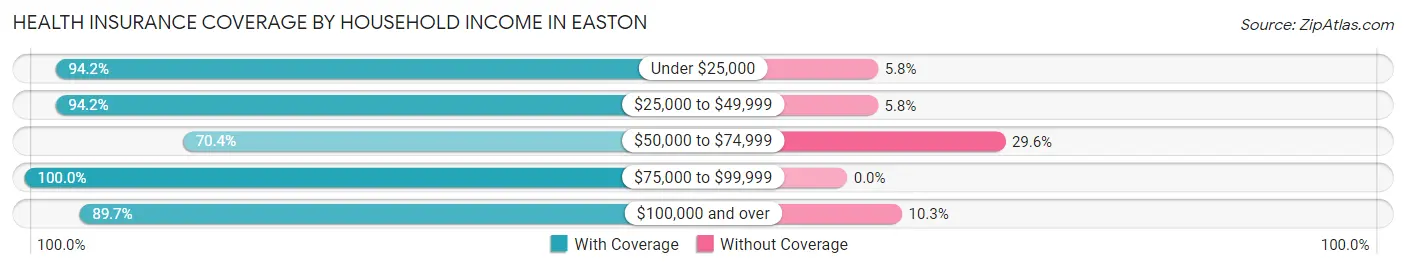
| Household Income | With Coverage | Without Coverage |
| Under $25,000 | 81 (94.2%) | 5 (5.8%) |
| $25,000 to $49,999 | 507 (94.2%) | 31 (5.8%) |
| $50,000 to $74,999 | 266 (70.4%) | 112 (29.6%) |
| $75,000 to $99,999 | 282 (100.0%) | 0 (0.0%) |
| $100,000 and over | 1,050 (89.7%) | 120 (10.3%) |
Public vs Private Health Insurance Coverage by Age in Easton
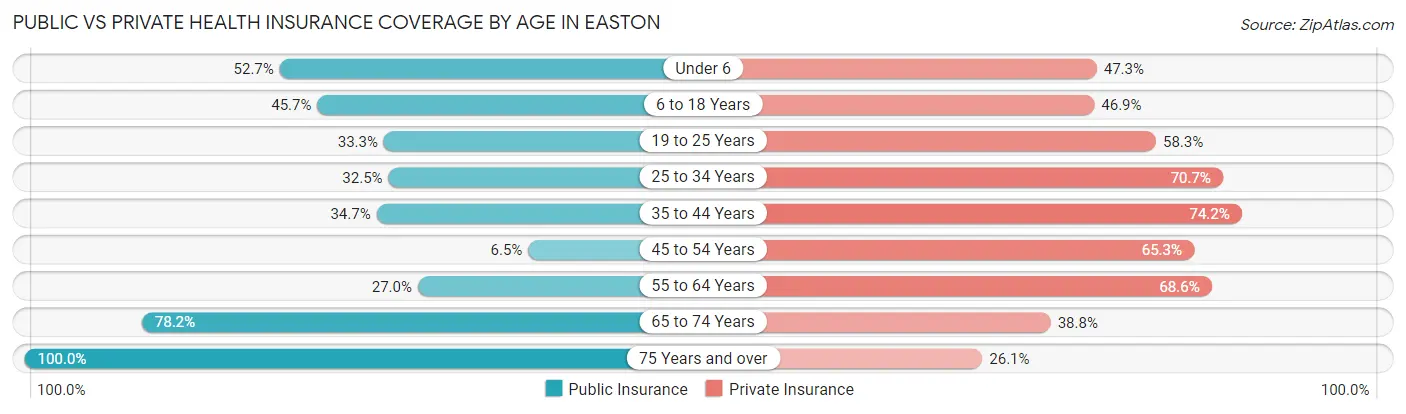
| Age Bracket | Public Insurance | Private Insurance |
| Under 6 | 128 (52.7%) | 115 (47.3%) |
| 6 to 18 Years | 190 (45.7%) | 195 (46.9%) |
| 19 to 25 Years | 96 (33.3%) | 168 (58.3%) |
| 25 to 34 Years | 113 (32.5%) | 246 (70.7%) |
| 35 to 44 Years | 86 (34.7%) | 184 (74.2%) |
| 45 to 54 Years | 26 (6.5%) | 260 (65.3%) |
| 55 to 64 Years | 74 (27.0%) | 188 (68.6%) |
| 65 to 74 Years | 115 (78.2%) | 57 (38.8%) |
| 75 Years and over | 92 (100.0%) | 24 (26.1%) |
| Total | 920 (37.5%) | 1,437 (58.6%) |
Disability Status by Sex by Age in Easton
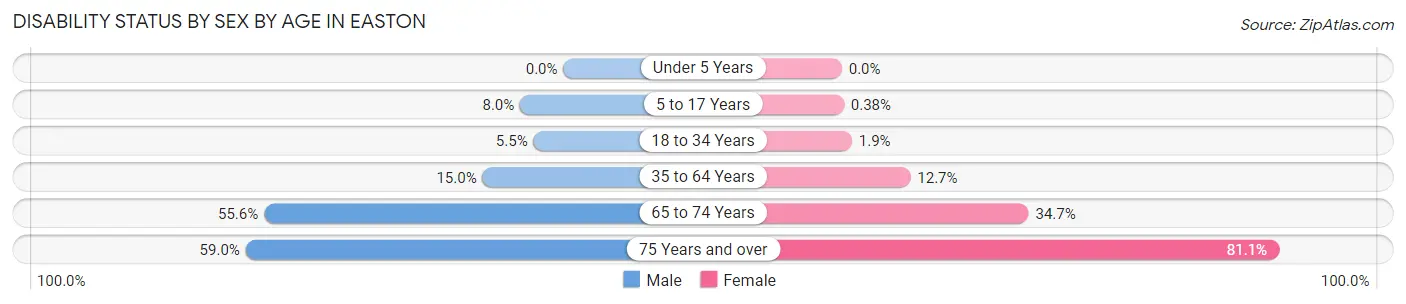
| Age Bracket | Male | Female |
| Under 5 Years | 0 (0.0%) | 0 (0.0%) |
| 5 to 17 Years | 15 (8.0%) | 1 (0.4%) |
| 18 to 34 Years | 19 (5.5%) | 6 (1.9%) |
| 35 to 64 Years | 65 (15.0%) | 62 (12.7%) |
| 65 to 74 Years | 40 (55.6%) | 26 (34.7%) |
| 75 Years and over | 23 (59.0%) | 43 (81.1%) |
Disability Class by Sex by Age in Easton
Disability Class: Hearing Difficulty
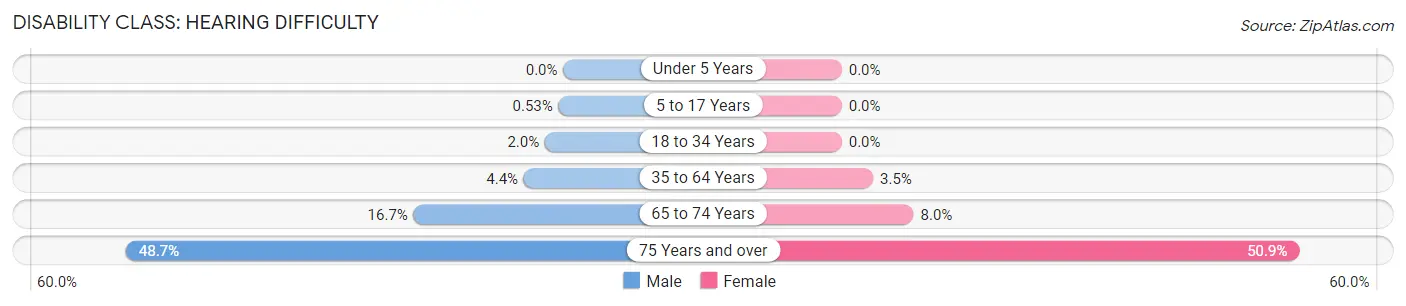
| Age Bracket | Male | Female |
| Under 5 Years | 0 (0.0%) | 0 (0.0%) |
| 5 to 17 Years | 1 (0.5%) | 0 (0.0%) |
| 18 to 34 Years | 7 (2.0%) | 0 (0.0%) |
| 35 to 64 Years | 19 (4.4%) | 17 (3.5%) |
| 65 to 74 Years | 12 (16.7%) | 6 (8.0%) |
| 75 Years and over | 19 (48.7%) | 27 (50.9%) |
Disability Class: Vision Difficulty
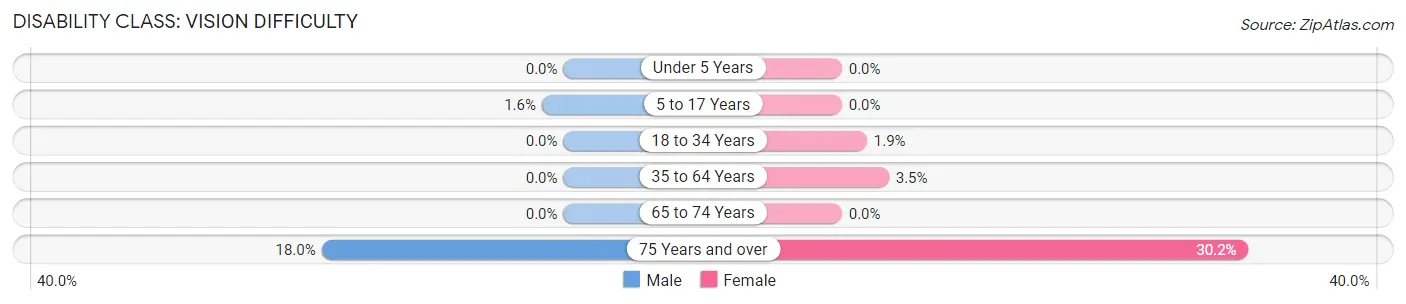
| Age Bracket | Male | Female |
| Under 5 Years | 0 (0.0%) | 0 (0.0%) |
| 5 to 17 Years | 3 (1.6%) | 0 (0.0%) |
| 18 to 34 Years | 0 (0.0%) | 6 (1.9%) |
| 35 to 64 Years | 0 (0.0%) | 17 (3.5%) |
| 65 to 74 Years | 0 (0.0%) | 0 (0.0%) |
| 75 Years and over | 7 (17.9%) | 16 (30.2%) |
Disability Class: Cognitive Difficulty
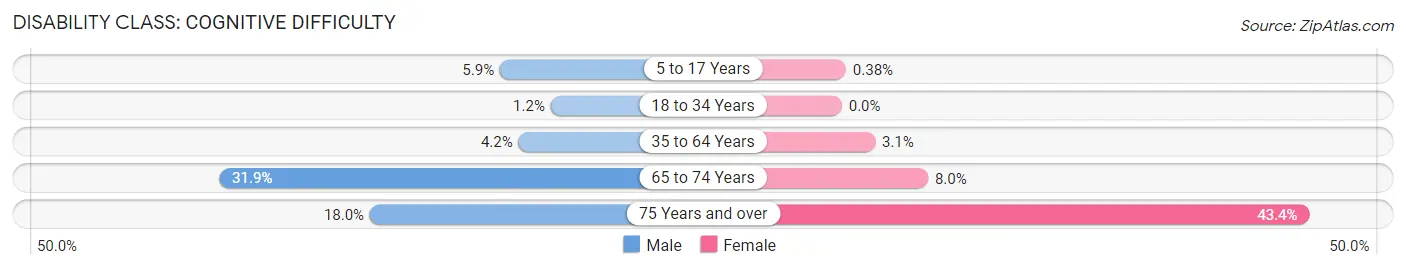
| Age Bracket | Male | Female |
| 5 to 17 Years | 11 (5.9%) | 1 (0.4%) |
| 18 to 34 Years | 4 (1.2%) | 0 (0.0%) |
| 35 to 64 Years | 18 (4.2%) | 15 (3.1%) |
| 65 to 74 Years | 23 (31.9%) | 6 (8.0%) |
| 75 Years and over | 7 (17.9%) | 23 (43.4%) |
Disability Class: Ambulatory Difficulty
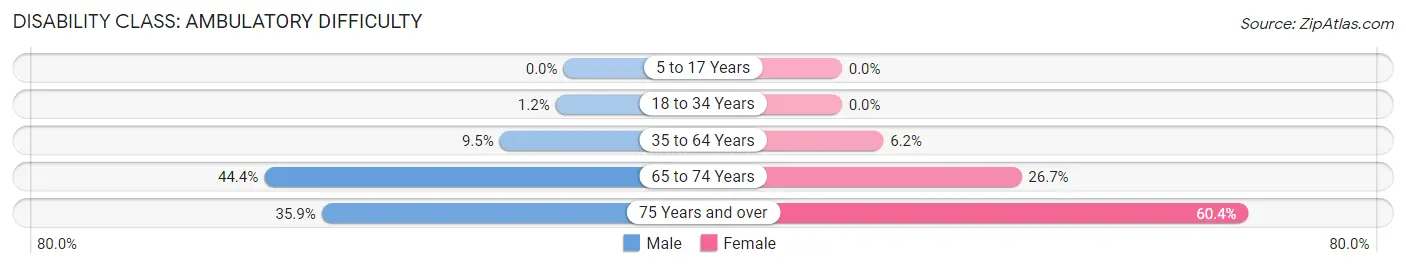
| Age Bracket | Male | Female |
| 5 to 17 Years | 0 (0.0%) | 0 (0.0%) |
| 18 to 34 Years | 4 (1.2%) | 0 (0.0%) |
| 35 to 64 Years | 41 (9.5%) | 30 (6.2%) |
| 65 to 74 Years | 32 (44.4%) | 20 (26.7%) |
| 75 Years and over | 14 (35.9%) | 32 (60.4%) |
Disability Class: Self-Care Difficulty
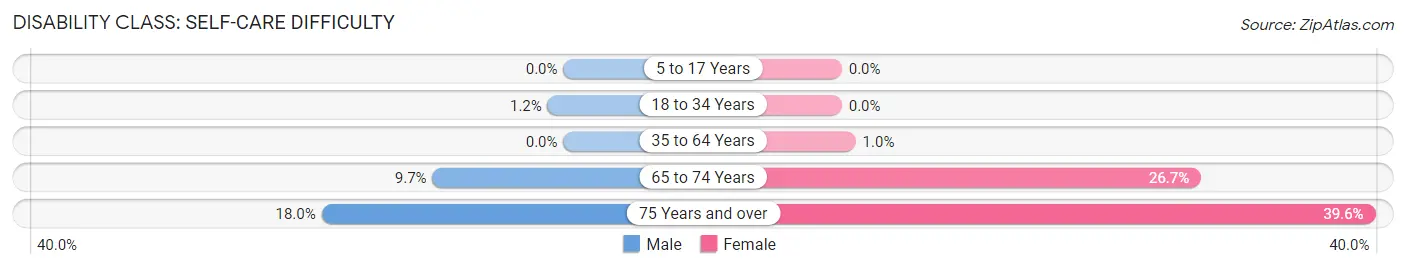
| Age Bracket | Male | Female |
| 5 to 17 Years | 0 (0.0%) | 0 (0.0%) |
| 18 to 34 Years | 4 (1.2%) | 0 (0.0%) |
| 35 to 64 Years | 0 (0.0%) | 5 (1.0%) |
| 65 to 74 Years | 7 (9.7%) | 20 (26.7%) |
| 75 Years and over | 7 (17.9%) | 21 (39.6%) |
Technology Access in Easton
Computing Device Access in Easton
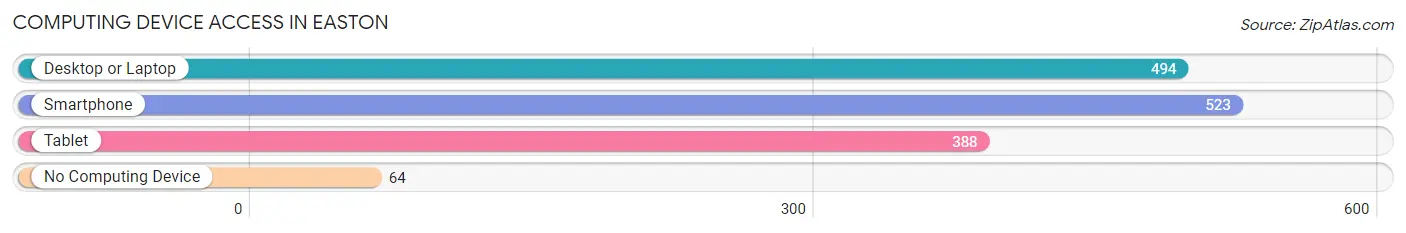
| Device Type | # Households | % Households |
| Desktop or Laptop | 494 | 78.9% |
| Smartphone | 523 | 83.6% |
| Tablet | 388 | 62.0% |
| No Computing Device | 64 | 10.2% |
| Total | 626 | 100.0% |
Internet Access in Easton
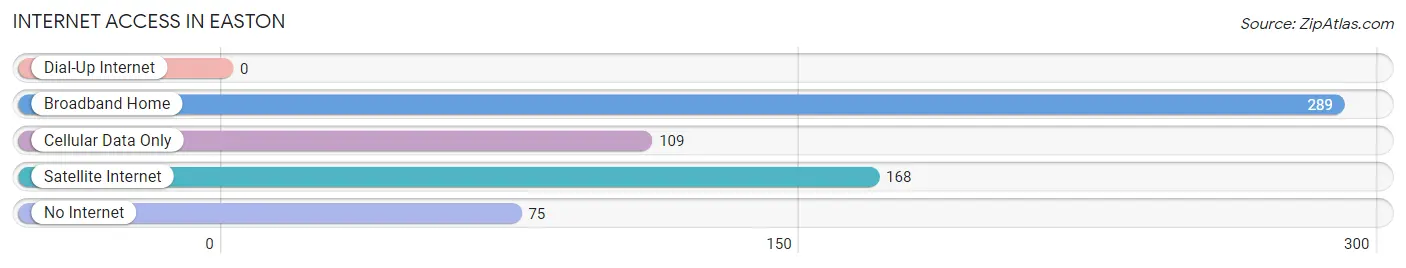
| Internet Type | # Households | % Households |
| Dial-Up Internet | 0 | 0.0% |
| Broadband Home | 289 | 46.2% |
| Cellular Data Only | 109 | 17.4% |
| Satellite Internet | 168 | 26.8% |
| No Internet | 75 | 12.0% |
| Total | 626 | 100.0% |
Easton Summary
Easton is a small town located in Fresno County, California. It is situated in the San Joaquin Valley, approximately 20 miles east of Fresno. The town was founded in 1872 and has a population of approximately 1,500 people.
History
Easton was founded in 1872 by a group of settlers from the Easton area of Pennsylvania. The town was named after the Pennsylvania town and was originally a farming community. The town was incorporated in 1891 and has remained a small, rural community ever since.
The town was originally a farming community, with the main crops being wheat, barley, and alfalfa. In the early 1900s, the town began to diversify its economy by adding a cannery, a creamery, and a brickyard. The town also had a railroad station, which allowed for the transportation of goods and people.
In the 1950s, the town began to experience a population decline as people moved away to larger cities. This decline continued until the late 1980s when the town began to experience a resurgence in population. This was due to the influx of people from the nearby cities of Fresno and Visalia.
Geography
Easton is located in the San Joaquin Valley, approximately 20 miles east of Fresno. The town is situated on the banks of the San Joaquin River and is surrounded by rolling hills and farmland. The town is located at an elevation of approximately 300 feet above sea level.
The climate in Easton is generally mild, with temperatures ranging from the mid-50s in the winter to the mid-90s in the summer. The town receives an average of 10 inches of rain per year.
Economy
The economy of Easton is largely based on agriculture. The main crops grown in the area are wheat, barley, and alfalfa. The town also has a cannery, a creamery, and a brickyard.
The town also has a few small businesses, including a grocery store, a hardware store, and a few restaurants. The town also has a few small manufacturing companies.
Demographics
As of the 2010 census, the population of Easton was 1,500. The racial makeup of the town was 75.2% White, 0.7% African American, 0.7% Native American, 0.7% Asian, 0.7% Pacific Islander, and 21.3% from other races. The median household income was $37,500.
The town is served by the Easton Unified School District, which consists of two elementary schools, one middle school, and one high school. The town also has a library and a post office.
Conclusion
Easton is a small town located in Fresno County, California. It was founded in 1872 and has a population of approximately 1,500 people. The town is situated in the San Joaquin Valley and is surrounded by rolling hills and farmland. The economy of Easton is largely based on agriculture, with the main crops being wheat, barley, and alfalfa. The town also has a few small businesses and manufacturing companies. The racial makeup of the town is 75.2% White, 0.7% African American, 0.7% Native American, 0.7% Asian, 0.7% Pacific Islander, and 21.3% from other races. The median household income was $37,500. Easton is served by the Easton Unified School District, which consists of two elementary schools, one middle school, and one high school. The town also has a library and a post office.
Common Questions
What is Per Capita Income in Easton?
Per Capita income in Easton is $41,145.
What is the Median Family Income in Easton?
Median Family Income in Easton is $85,227.
What is the Median Household income in Easton?
Median Household Income in Easton is $82,368.
What is Income or Wage Gap in Easton?
Income or Wage Gap in Easton is 18.0%.
Women in Easton earn 82.0 cents for every dollar earned by a man.
What is Family Income Deficit in Easton?
Family Income Deficit in Easton is $6,833.
Families that are below poverty line in Easton earn $6,833 less on average than the poverty threshold level.
What is Inequality or Gini Index in Easton?
Inequality or Gini Index in Easton is 0.58.
What is the Total Population of Easton?
Total Population of Easton is 2,454.
What is the Total Male Population of Easton?
Total Male Population of Easton is 1,160.
What is the Total Female Population of Easton?
Total Female Population of Easton is 1,294.
What is the Ratio of Males per 100 Females in Easton?
There are 89.64 Males per 100 Females in Easton.
What is the Ratio of Females per 100 Males in Easton?
There are 111.55 Females per 100 Males in Easton.
What is the Median Population Age in Easton?
Median Population Age in Easton is 31.8 Years.
What is the Average Family Size in Easton
Average Family Size in Easton is 4.1 People.
What is the Average Household Size in Easton
Average Household Size in Easton is 3.9 People.
How Large is the Labor Force in Easton?
There are 1,292 People in the Labor Forcein in Easton.
What is the Percentage of People in the Labor Force in Easton?
67.1% of People are in the Labor Force in Easton.
What is the Unemployment Rate in Easton?
Unemployment Rate in Easton is 8.1%.