Cities with the Highest Percentage of Population with a Degree in Computers and Mathematics in Minnesota
RELATED REPORTS & OPTIONS
Computers and Mathematics
Minnesota
Compare Cities
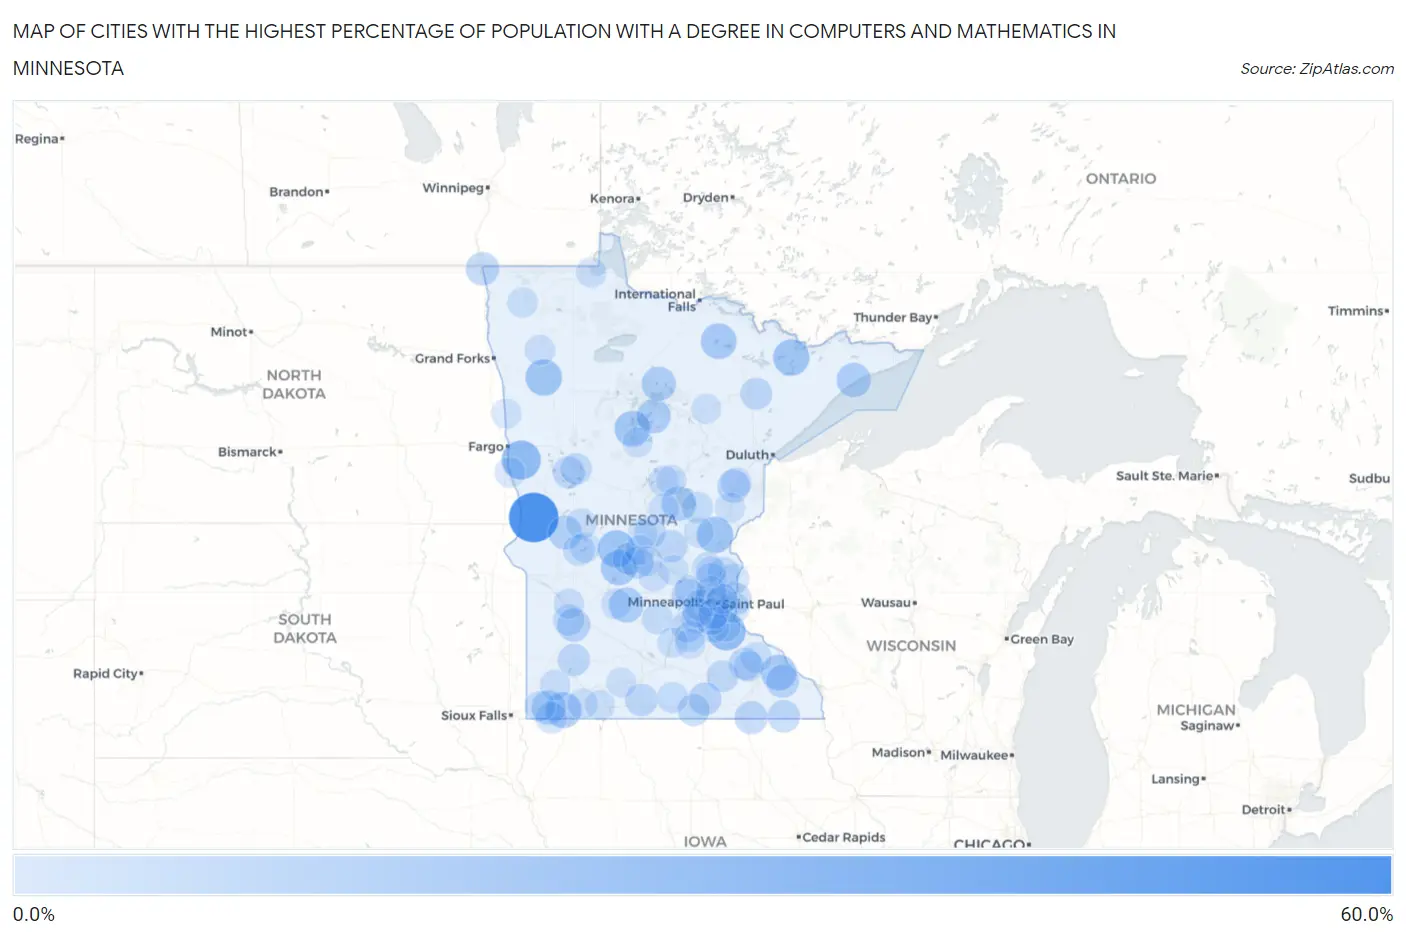
Map of Cities with the Highest Percentage of Population with a Degree in Computers and Mathematics in Minnesota
0.0%
60.0%
Cities with the Highest Percentage of Population with a Degree in Computers and Mathematics in Minnesota
| City | % Graduates | vs State | vs National | |
| 1. | Tintah | 55.6% | 4.5%(+51.0)#1 | 4.9%(+50.7)#83 |
| 2. | Baker | 28.6% | 4.5%(+24.0)#2 | 4.9%(+23.7)#318 |
| 3. | New Trier | 27.3% | 4.5%(+22.7)#3 | 4.9%(+22.4)#353 |
| 4. | Meire Grove | 23.1% | 4.5%(+18.5)#4 | 4.9%(+18.2)#481 |
| 5. | Mentor | 22.2% | 4.5%(+17.7)#5 | 4.9%(+17.3)#513 |
| 6. | Grasston | 22.2% | 4.5%(+17.7)#6 | 4.9%(+17.3)#514 |
| 7. | Winton | 21.7% | 4.5%(+17.2)#7 | 4.9%(+16.8)#531 |
| 8. | Walker | 20.4% | 4.5%(+15.8)#8 | 4.9%(+15.5)#588 |
| 9. | Rushmore | 20.0% | 4.5%(+15.5)#9 | 4.9%(+15.1)#599 |
| 10. | Nett Lake | 20.0% | 4.5%(+15.5)#10 | 4.9%(+15.1)#606 |
| 11. | Elba | 20.0% | 4.5%(+15.5)#11 | 4.9%(+15.1)#619 |
| 12. | Regal | 20.0% | 4.5%(+15.5)#12 | 4.9%(+15.1)#624 |
| 13. | Pickwick | 19.4% | 4.5%(+14.8)#13 | 4.9%(+14.5)#650 |
| 14. | Cosmos | 17.6% | 4.5%(+13.1)#14 | 4.9%(+12.8)#779 |
| 15. | Vineland | 17.2% | 4.5%(+12.7)#15 | 4.9%(+12.3)#806 |
| 16. | Lutsen | 16.9% | 4.5%(+12.4)#16 | 4.9%(+12.0)#839 |
| 17. | Magnolia | 16.7% | 4.5%(+12.1)#17 | 4.9%(+11.8)#865 |
| 18. | Federal Dam | 16.7% | 4.5%(+12.1)#18 | 4.9%(+11.8)#868 |
| 19. | Squaw Lake | 16.7% | 4.5%(+12.1)#19 | 4.9%(+11.8)#872 |
| 20. | Hoffman | 15.5% | 4.5%(+11.0)#20 | 4.9%(+10.6)#984 |
| 21. | Hanley Falls | 14.3% | 4.5%(+9.76)#21 | 4.9%(+9.39)#1,122 |
| 22. | St Vincent | 14.3% | 4.5%(+9.76)#22 | 4.9%(+9.39)#1,138 |
| 23. | Le Roy | 13.4% | 4.5%(+8.90)#23 | 4.9%(+8.54)#1,251 |
| 24. | Utica | 13.3% | 4.5%(+8.81)#24 | 4.9%(+8.44)#1,274 |
| 25. | Clarks Grove | 13.1% | 4.5%(+8.57)#25 | 4.9%(+8.20)#1,317 |
| 26. | Lauderdale | 12.9% | 4.5%(+8.39)#26 | 4.9%(+8.02)#1,353 |
| 27. | Sturgeon Lake | 12.9% | 4.5%(+8.38)#27 | 4.9%(+8.01)#1,358 |
| 28. | Northrop | 12.5% | 4.5%(+7.97)#28 | 4.9%(+7.61)#1,447 |
| 29. | St Anthony City Stearns County | 12.5% | 4.5%(+7.97)#29 | 4.9%(+7.61)#1,453 |
| 30. | Bayport | 12.5% | 4.5%(+7.94)#30 | 4.9%(+7.58)#1,455 |
| 31. | St Martin | 12.1% | 4.5%(+7.59)#31 | 4.9%(+7.23)#1,506 |
| 32. | Pine Island | 12.1% | 4.5%(+7.55)#32 | 4.9%(+7.18)#1,510 |
| 33. | Canton | 12.1% | 4.5%(+7.54)#33 | 4.9%(+7.17)#1,515 |
| 34. | Tracy | 11.7% | 4.5%(+7.18)#34 | 4.9%(+6.81)#1,600 |
| 35. | Foley | 11.7% | 4.5%(+7.17)#35 | 4.9%(+6.81)#1,605 |
| 36. | Richmond | 11.5% | 4.5%(+7.01)#36 | 4.9%(+6.64)#1,635 |
| 37. | Loretto | 11.4% | 4.5%(+6.83)#37 | 4.9%(+6.46)#1,684 |
| 38. | Jordan | 11.2% | 4.5%(+6.63)#38 | 4.9%(+6.26)#1,719 |
| 39. | Dent | 11.1% | 4.5%(+6.58)#39 | 4.9%(+6.22)#1,757 |
| 40. | Conger | 11.1% | 4.5%(+6.58)#40 | 4.9%(+6.22)#1,769 |
| 41. | Mckinley | 11.1% | 4.5%(+6.58)#41 | 4.9%(+6.22)#1,770 |
| 42. | Royalton | 10.6% | 4.5%(+6.08)#42 | 4.9%(+5.71)#1,909 |
| 43. | Claremont | 10.3% | 4.5%(+5.82)#43 | 4.9%(+5.45)#2,000 |
| 44. | Hazel Run | 10.0% | 4.5%(+5.47)#44 | 4.9%(+5.11)#2,162 |
| 45. | Perham | 10.0% | 4.5%(+5.42)#45 | 4.9%(+5.06)#2,175 |
| 46. | Ellsworth | 9.7% | 4.5%(+5.15)#46 | 4.9%(+4.78)#2,276 |
| 47. | Starbuck | 9.6% | 4.5%(+5.11)#47 | 4.9%(+4.74)#2,299 |
| 48. | Vermillion | 9.6% | 4.5%(+5.09)#48 | 4.9%(+4.72)#2,310 |
| 49. | Wyoming | 9.5% | 4.5%(+5.02)#49 | 4.9%(+4.65)#2,343 |
| 50. | Ham Lake | 9.4% | 4.5%(+4.90)#50 | 4.9%(+4.53)#2,406 |
| 51. | Isle | 9.3% | 4.5%(+4.75)#51 | 4.9%(+4.38)#2,477 |
| 52. | Easton | 9.1% | 4.5%(+4.56)#52 | 4.9%(+4.20)#2,588 |
| 53. | Glencoe | 9.0% | 4.5%(+4.49)#53 | 4.9%(+4.12)#2,613 |
| 54. | Afton | 9.0% | 4.5%(+4.47)#54 | 4.9%(+4.11)#2,622 |
| 55. | Corcoran | 8.9% | 4.5%(+4.40)#55 | 4.9%(+4.03)#2,674 |
| 56. | Garfield | 8.6% | 4.5%(+4.04)#56 | 4.9%(+3.68)#2,855 |
| 57. | Scandia | 8.5% | 4.5%(+3.97)#57 | 4.9%(+3.60)#2,891 |
| 58. | Hopkins | 8.5% | 4.5%(+3.93)#58 | 4.9%(+3.56)#2,918 |
| 59. | Luverne | 8.3% | 4.5%(+3.81)#59 | 4.9%(+3.45)#2,968 |
| 60. | Chandler | 8.3% | 4.5%(+3.81)#60 | 4.9%(+3.44)#2,998 |
| 61. | Zumbro Falls | 8.3% | 4.5%(+3.81)#61 | 4.9%(+3.44)#3,014 |
| 62. | Riverton | 8.3% | 4.5%(+3.81)#62 | 4.9%(+3.44)#3,015 |
| 63. | Oronoco | 8.2% | 4.5%(+3.65)#63 | 4.9%(+3.29)#3,097 |
| 64. | Bethel | 8.2% | 4.5%(+3.64)#64 | 4.9%(+3.27)#3,109 |
| 65. | Moose Lake | 8.0% | 4.5%(+3.46)#65 | 4.9%(+3.09)#3,225 |
| 66. | Maplewood | 7.9% | 4.5%(+3.41)#66 | 4.9%(+3.04)#3,261 |
| 67. | Long Beach | 7.8% | 4.5%(+3.30)#67 | 4.9%(+2.93)#3,358 |
| 68. | Farmington | 7.8% | 4.5%(+3.23)#68 | 4.9%(+2.86)#3,403 |
| 69. | St Hilaire | 7.7% | 4.5%(+3.16)#69 | 4.9%(+2.80)#3,462 |
| 70. | Bowlus | 7.7% | 4.5%(+3.16)#70 | 4.9%(+2.80)#3,464 |
| 71. | Lake Lillian | 7.7% | 4.5%(+3.16)#71 | 4.9%(+2.80)#3,466 |
| 72. | South Haven | 7.7% | 4.5%(+3.16)#72 | 4.9%(+2.80)#3,469 |
| 73. | Harding | 7.7% | 4.5%(+3.16)#73 | 4.9%(+2.80)#3,472 |
| 74. | New Prague | 7.6% | 4.5%(+3.08)#74 | 4.9%(+2.71)#3,534 |
| 75. | Apple Valley | 7.4% | 4.5%(+2.92)#75 | 4.9%(+2.55)#3,626 |
| 76. | Eagan | 7.4% | 4.5%(+2.88)#76 | 4.9%(+2.51)#3,654 |
| 77. | Brewster | 7.4% | 4.5%(+2.88)#77 | 4.9%(+2.51)#3,663 |
| 78. | Wolverton | 7.4% | 4.5%(+2.88)#78 | 4.9%(+2.51)#3,670 |
| 79. | Montevideo | 7.4% | 4.5%(+2.86)#79 | 4.9%(+2.50)#3,678 |
| 80. | Deerwood | 7.4% | 4.5%(+2.85)#80 | 4.9%(+2.48)#3,691 |
| 81. | Warroad | 7.4% | 4.5%(+2.83)#81 | 4.9%(+2.47)#3,705 |
| 82. | Karlstad | 7.3% | 4.5%(+2.77)#82 | 4.9%(+2.41)#3,751 |
| 83. | Shakopee | 7.3% | 4.5%(+2.76)#83 | 4.9%(+2.39)#3,763 |
| 84. | North St Paul | 7.2% | 4.5%(+2.71)#84 | 4.9%(+2.35)#3,797 |
| 85. | Mounds View | 7.2% | 4.5%(+2.63)#85 | 4.9%(+2.27)#3,847 |
| 86. | Eden Prairie | 7.1% | 4.5%(+2.60)#86 | 4.9%(+2.23)#3,909 |
| 87. | Le Sueur | 7.1% | 4.5%(+2.56)#87 | 4.9%(+2.20)#3,949 |
| 88. | Montgomery | 7.0% | 4.5%(+2.45)#88 | 4.9%(+2.08)#4,048 |
| 89. | Hackensack | 7.0% | 4.5%(+2.45)#89 | 4.9%(+2.08)#4,058 |
| 90. | Sandstone | 7.0% | 4.5%(+2.42)#90 | 4.9%(+2.06)#4,080 |
| 91. | Becker | 6.9% | 4.5%(+2.41)#91 | 4.9%(+2.04)#4,097 |
| 92. | Lakefield | 6.9% | 4.5%(+2.37)#92 | 4.9%(+2.00)#4,125 |
| 93. | Marble | 6.9% | 4.5%(+2.37)#93 | 4.9%(+2.00)#4,126 |
| 94. | East Bethel | 6.8% | 4.5%(+2.30)#94 | 4.9%(+1.93)#4,188 |
| 95. | Avon | 6.7% | 4.5%(+2.16)#95 | 4.9%(+1.79)#4,328 |
| 96. | Butterfield | 6.7% | 4.5%(+2.14)#96 | 4.9%(+1.77)#4,359 |
| 97. | Ogilvie | 6.7% | 4.5%(+2.14)#97 | 4.9%(+1.77)#4,361 |
| 98. | Hendrum | 6.7% | 4.5%(+2.14)#98 | 4.9%(+1.77)#4,377 |
| 99. | High Forest | 6.7% | 4.5%(+2.14)#99 | 4.9%(+1.77)#4,381 |
| 100. | Rockville | 6.6% | 4.5%(+2.06)#100 | 4.9%(+1.70)#4,448 |
Common Questions
What are the Top 10 Cities with the Highest Percentage of Population with a Degree in Computers and Mathematics in Minnesota?
Top 10 Cities with the Highest Percentage of Population with a Degree in Computers and Mathematics in Minnesota are:
What city has the Highest Percentage of Population with a Degree in Computers and Mathematics in Minnesota?
Tintah has the Highest Percentage of Population with a Degree in Computers and Mathematics in Minnesota with 55.6%.
What is the Percentage of Population with a Degree in Computers and Mathematics in the State of Minnesota?
Percentage of Population with a Degree in Computers and Mathematics in Minnesota is 4.5%.
What is the Percentage of Population with a Degree in Computers and Mathematics in the United States?
Percentage of Population with a Degree in Computers and Mathematics in the United States is 4.9%.