Cities with the Highest Percentage of Population with a Degree in Computers and Mathematics in the United States
RELATED REPORTS & OPTIONS
Computers and Mathematics
United States
Compare Cities
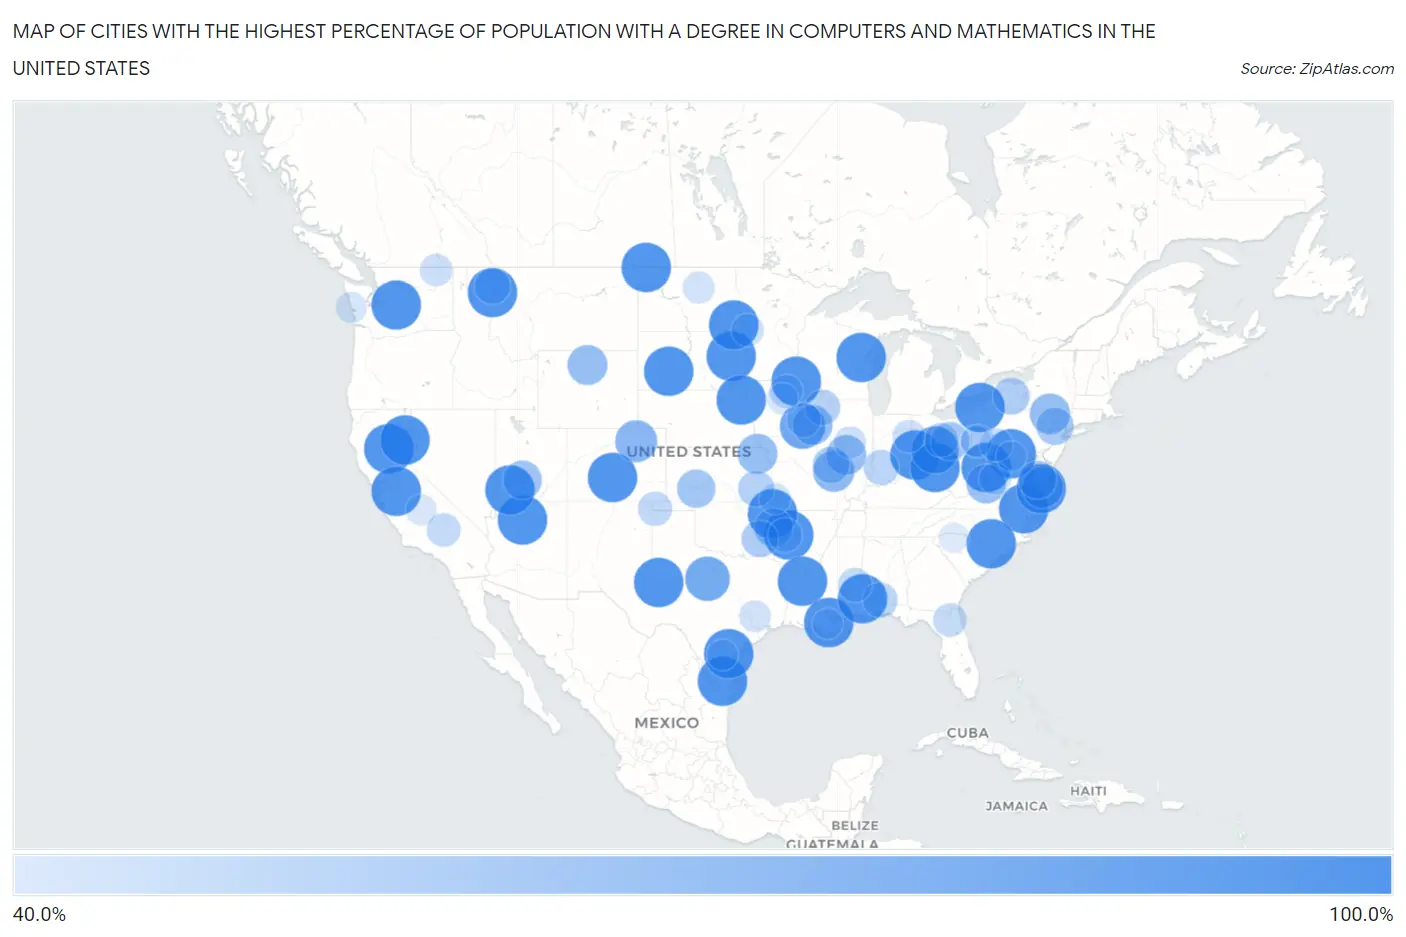
Map of Cities with the Highest Percentage of Population with a Degree in Computers and Mathematics in the United States
0.0%
100.0%
Cities with the Highest Percentage of Population with a Degree in Computers and Mathematics in the United States
| City | % Graduates | vs State | vs National | |
| 1. | Penn State Erie Behrend | 100.0% | 4.6%(+95.4)#1 | 4.9%(+95.1)#1 |
| 2. | Mckinney Acres | 100.0% | 5.2%(+94.8)#1 | 4.9%(+95.1)#2 |
| 3. | Muniz | 100.0% | 5.2%(+94.8)#2 | 4.9%(+95.1)#3 |
| 4. | Allison Gap | 100.0% | 6.6%(+93.4)#1 | 4.9%(+95.1)#4 |
| 5. | Belleville | 100.0% | 4.0%(+96.0)#1 | 4.9%(+95.1)#5 |
| 6. | Stirling City | 100.0% | 5.8%(+94.2)#1 | 4.9%(+95.1)#6 |
| 7. | Chesapeake Landing | 100.0% | 7.0%(+93.0)#1 | 4.9%(+95.1)#7 |
| 8. | Southampton Meadows | 100.0% | 6.6%(+93.4)#2 | 4.9%(+95.1)#8 |
| 9. | Edroy | 100.0% | 5.2%(+94.8)#3 | 4.9%(+95.1)#9 |
| 10. | Tusayan | 100.0% | 4.5%(+95.5)#1 | 4.9%(+95.1)#10 |
| 11. | Coaldale | 100.0% | 5.2%(+94.8)#1 | 4.9%(+95.1)#11 |
| 12. | Eros | 100.0% | 3.0%(+97.0)#1 | 4.9%(+95.1)#12 |
| 13. | Pleasure Bend | 100.0% | 3.0%(+97.0)#2 | 4.9%(+95.1)#13 |
| 14. | Elrod | 100.0% | 5.0%(+95.0)#1 | 4.9%(+95.1)#14 |
| 15. | Cowan | 100.0% | 5.8%(+94.2)#2 | 4.9%(+95.1)#15 |
| 16. | Ronald | 100.0% | 7.0%(+93.0)#1 | 4.9%(+95.1)#16 |
| 17. | Mormon Lake | 100.0% | 4.5%(+95.5)#2 | 4.9%(+95.1)#17 |
| 18. | Brandt | 100.0% | 4.1%(+95.9)#1 | 4.9%(+95.1)#18 |
| 19. | Big Arm | 100.0% | 3.1%(+96.9)#1 | 4.9%(+95.1)#19 |
| 20. | West Elkton | 100.0% | 4.1%(+95.9)#2 | 4.9%(+95.1)#20 |
| 21. | Greenbush | 100.0% | 6.6%(+93.4)#3 | 4.9%(+95.1)#21 |
| 22. | Litchfield | 100.0% | 5.8%(+94.2)#3 | 4.9%(+95.1)#22 |
| 23. | Angelica | 100.0% | 3.9%(+96.1)#1 | 4.9%(+95.1)#23 |
| 24. | Vienna | 100.0% | 3.2%(+96.8)#1 | 4.9%(+95.1)#24 |
| 25. | Harman | 100.0% | 3.0%(+97.0)#1 | 4.9%(+95.1)#25 |
| 26. | Cottonwood | 100.0% | 3.2%(+96.8)#2 | 4.9%(+95.1)#26 |
| 27. | Otway | 100.0% | 4.1%(+95.9)#3 | 4.9%(+95.1)#27 |
| 28. | Tibbie | 100.0% | 4.4%(+95.6)#1 | 4.9%(+95.1)#28 |
| 29. | Waterbury | 100.0% | 3.8%(+96.2)#1 | 4.9%(+95.1)#29 |
| 30. | Raynesford | 100.0% | 3.1%(+96.9)#2 | 4.9%(+95.1)#30 |
| 31. | Cherokee City | 100.0% | 4.0%(+96.0)#2 | 4.9%(+95.1)#31 |
| 32. | Ambrose | 100.0% | 3.4%(+96.6)#1 | 4.9%(+95.1)#32 |
| 33. | Kemps Mill | 100.0% | 7.0%(+93.0)#2 | 4.9%(+95.1)#33 |
| 34. | Toeterville | 100.0% | 3.7%(+96.3)#1 | 4.9%(+95.1)#34 |
| 35. | De Lamere | 100.0% | 3.4%(+96.6)#2 | 4.9%(+95.1)#35 |
| 36. | Cedar Highlands | 100.0% | 5.5%(+94.5)#1 | 4.9%(+95.1)#36 |
| 37. | Princeton | 100.0% | 4.0%(+96.0)#3 | 4.9%(+95.1)#37 |
| 38. | Darbydale | 94.4% | 4.1%(+90.3)#4 | 4.9%(+89.6)#38 |
| 39. | Kirkville | 88.9% | 3.7%(+85.2)#2 | 4.9%(+84.0)#39 |
| 40. | Moran | 87.1% | 5.2%(+81.9)#4 | 4.9%(+82.2)#40 |
| 41. | Orchard | 80.0% | 5.2%(+74.8)#2 | 4.9%(+75.1)#41 |
| 42. | Nelsonia | 78.8% | 6.6%(+72.2)#4 | 4.9%(+73.9)#42 |
| 43. | Wellston | 78.1% | 4.4%(+73.6)#1 | 4.9%(+73.2)#43 |
| 44. | Hortonville | 75.9% | 4.7%(+71.2)#1 | 4.9%(+71.0)#44 |
| 45. | Kickapoo Tribal Center | 75.0% | 4.0%(+71.0)#1 | 4.9%(+70.1)#45 |
| 46. | Jeisyville | 75.0% | 5.1%(+69.9)#1 | 4.9%(+70.1)#46 |
| 47. | Hyattville | 75.0% | 2.6%(+72.4)#1 | 4.9%(+70.1)#47 |
| 48. | Coppock | 75.0% | 3.7%(+71.3)#3 | 4.9%(+70.1)#48 |
| 49. | Mound | 74.4% | 5.2%(+69.2)#5 | 4.9%(+69.5)#49 |
| 50. | Goshen | 73.3% | 6.6%(+66.8)#5 | 4.9%(+68.4)#50 |
| 51. | Kingston | 71.4% | 5.5%(+65.9)#2 | 4.9%(+66.5)#51 |
| 52. | Short | 71.4% | 3.4%(+68.0)#1 | 4.9%(+66.5)#52 |
| 53. | Nellie | 71.1% | 4.1%(+66.9)#5 | 4.9%(+66.2)#53 |
| 54. | Fort Dodge | 70.6% | 4.0%(+66.6)#2 | 4.9%(+65.7)#54 |
| 55. | Chance | 70.0% | 7.0%(+63.0)#3 | 4.9%(+65.1)#55 |
| 56. | Ross Corner | 68.4% | 6.2%(+62.3)#1 | 4.9%(+63.5)#56 |
| 57. | Bogue Chitto Cdp Kemper And Neshoba Counties | 67.9% | 3.2%(+64.6)#1 | 4.9%(+63.0)#57 |
| 58. | Gowen | 66.7% | 3.4%(+63.2)#2 | 4.9%(+61.8)#58 |
| 59. | Otterville | 66.7% | 5.1%(+61.6)#2 | 4.9%(+61.8)#59 |
| 60. | Kysorville | 66.7% | 4.7%(+61.9)#2 | 4.9%(+61.8)#60 |
| 61. | Buffalo | 64.7% | 4.0%(+60.7)#3 | 4.9%(+59.8)#61 |
| 62. | Forest Hill Village | 64.0% | 3.1%(+60.9)#3 | 4.9%(+59.1)#62 |
| 63. | Center Junction | 63.6% | 3.7%(+60.0)#4 | 4.9%(+58.7)#63 |
| 64. | Scotland | 62.5% | 4.2%(+58.3)#1 | 4.9%(+57.6)#64 |
| 65. | Culp | 62.5% | 4.6%(+57.9)#2 | 4.9%(+57.6)#65 |
| 66. | Castleberry | 62.2% | 4.4%(+57.8)#2 | 4.9%(+57.3)#66 |
| 67. | Wever | 61.5% | 3.7%(+57.9)#5 | 4.9%(+56.6)#67 |
| 68. | Yermo | 60.9% | 5.8%(+55.1)#4 | 4.9%(+56.0)#68 |
| 69. | Arona Borough | 60.5% | 4.6%(+56.0)#3 | 4.9%(+55.6)#69 |
| 70. | Sparta | 60.0% | 4.1%(+55.9)#6 | 4.9%(+55.1)#70 |
| 71. | Blue Mountain | 60.0% | 4.0%(+56.0)#4 | 4.9%(+55.1)#71 |
| 72. | Felt | 60.0% | 3.4%(+56.6)#3 | 4.9%(+55.1)#72 |
| 73. | Thornburg | 60.0% | 3.7%(+56.3)#6 | 4.9%(+55.1)#73 |
| 74. | Stonewall | 59.6% | 3.2%(+56.3)#2 | 4.9%(+54.7)#74 |
| 75. | Casa Loma | 59.3% | 5.8%(+53.4)#5 | 4.9%(+54.4)#75 |
| 76. | Hendersonville | 59.1% | 4.6%(+54.5)#4 | 4.9%(+54.2)#76 |
| 77. | Johannesburg | 58.8% | 5.8%(+53.0)#6 | 4.9%(+53.9)#77 |
| 78. | Lawtey | 58.5% | 4.1%(+54.4)#1 | 4.9%(+53.6)#78 |
| 79. | Cairnbrook | 57.1% | 4.6%(+52.6)#5 | 4.9%(+52.2)#79 |
| 80. | Goodell | 57.1% | 3.7%(+53.5)#7 | 4.9%(+52.2)#80 |
| 81. | Turner | 56.9% | 2.9%(+54.0)#1 | 4.9%(+52.1)#81 |
| 82. | Geneva | 56.0% | 4.2%(+51.8)#2 | 4.9%(+51.1)#82 |
| 83. | Tintah | 55.6% | 4.5%(+51.0)#1 | 4.9%(+50.7)#83 |
| 84. | Orient | 55.6% | 7.0%(+48.6)#2 | 4.9%(+50.7)#84 |
| 85. | Silver Springs Shores East | 55.1% | 4.1%(+51.0)#2 | 4.9%(+50.2)#85 |
| 86. | Waynesville | 55.0% | 5.1%(+49.9)#3 | 4.9%(+50.1)#86 |
| 87. | Esmond | 54.5% | 3.4%(+51.2)#3 | 4.9%(+49.7)#87 |
| 88. | Mount Sidney | 54.5% | 6.6%(+47.9)#6 | 4.9%(+49.6)#88 |
| 89. | Todd Mission | 53.8% | 5.2%(+48.7)#6 | 4.9%(+49.0)#89 |
| 90. | Bobo | 53.1% | 3.2%(+49.9)#3 | 4.9%(+48.2)#90 |
| 91. | Brooklyn Heights | 52.9% | 4.4%(+48.5)#2 | 4.9%(+48.0)#91 |
| 92. | Eagleville Cdp Centre County | 52.8% | 4.6%(+48.2)#6 | 4.9%(+47.9)#92 |
| 93. | Copalis Beach | 52.4% | 7.0%(+45.5)#3 | 4.9%(+47.5)#93 |
| 94. | Woolstock | 52.2% | 3.7%(+48.5)#8 | 4.9%(+47.3)#94 |
| 95. | Amargosa | 51.9% | 5.2%(+46.7)#7 | 4.9%(+47.0)#95 |
| 96. | Cutler | 51.7% | 5.8%(+45.9)#7 | 4.9%(+46.8)#96 |
| 97. | Southview | 51.1% | 4.6%(+46.6)#7 | 4.9%(+46.2)#97 |
| 98. | Choctaw | 51.0% | 3.0%(+48.0)#3 | 4.9%(+46.1)#98 |
| 99. | Clifton | 50.0% | 3.7%(+46.3)#1 | 4.9%(+45.1)#99 |
| 100. | Tilghmanton | 50.0% | 7.0%(+43.0)#4 | 4.9%(+45.1)#100 |
Common Questions
What are the Top 10 Cities with the Highest Percentage of Population with a Degree in Computers and Mathematics in the United States?
Top 10 Cities with the Highest Percentage of Population with a Degree in Computers and Mathematics in the United States are:
#1
100.0%
#2
100.0%
#3
100.0%
#4
100.0%
#5
100.0%
#6
100.0%
#7
100.0%
#8
100.0%
#9
100.0%
#10
100.0%
What city has the Highest Percentage of Population with a Degree in Computers and Mathematics in the United States?
Penn State Erie Behrend has the Highest Percentage of Population with a Degree in Computers and Mathematics in the United States with 100.0%.
What is the Percentage of Population with a Degree in Computers and Mathematics in the United States?
Percentage of Population with a Degree in Computers and Mathematics in the United States is 4.9%.