Cities with the Highest Percentage of Families with Income Below $10,000 in South Dakota
RELATED REPORTS & OPTIONS
Family Income | $0-10k
South Dakota
Compare Cities
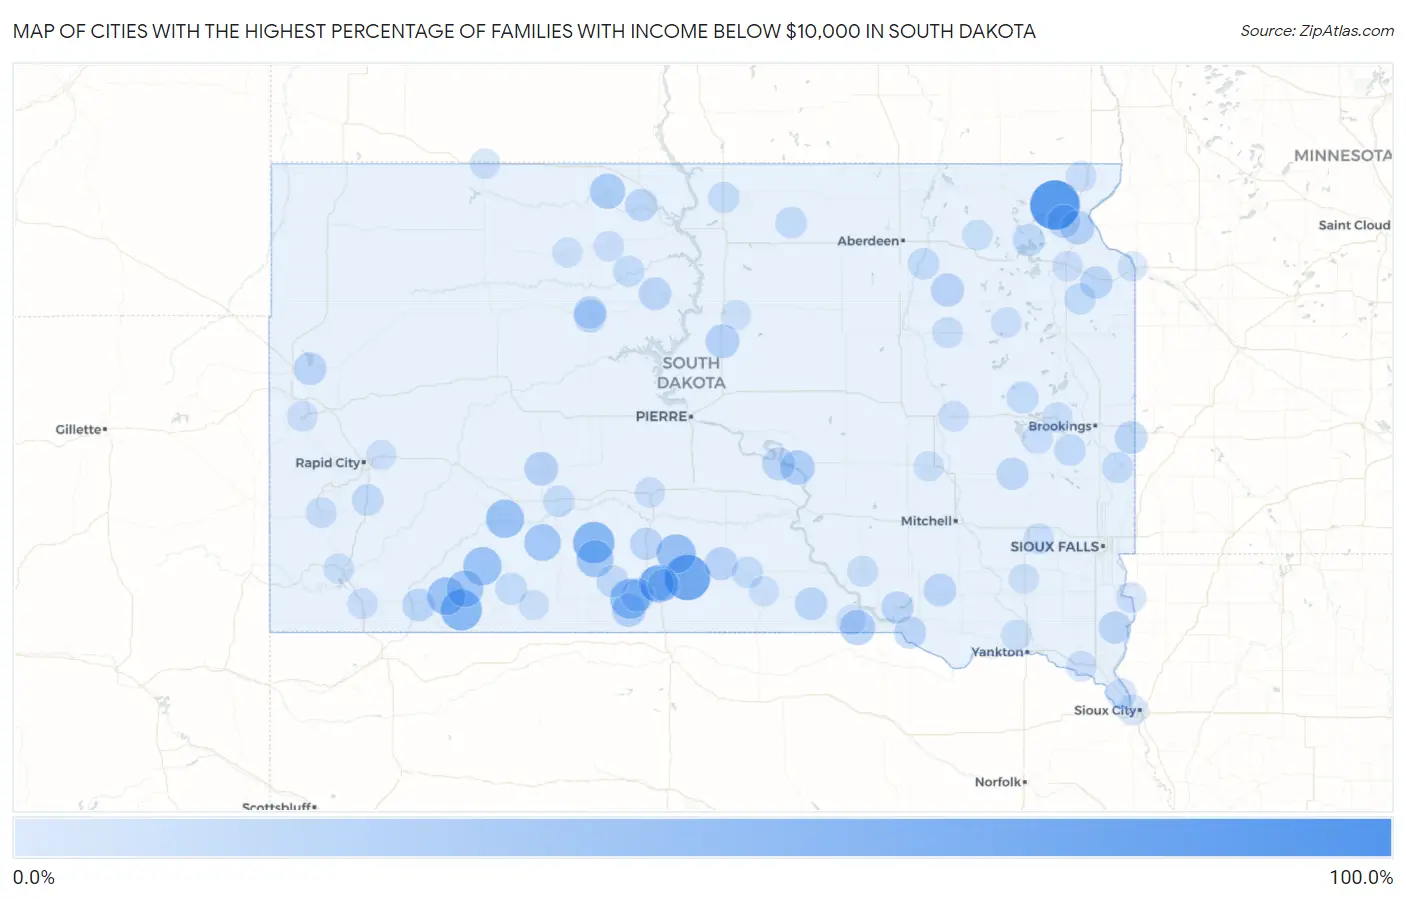
Map of Cities with the Highest Percentage of Families with Income Below $10,000 in South Dakota
0.0%
100.0%
Cities with the Highest Percentage of Families with Income Below $10,000 in South Dakota
| City | Families with Income < $10k | vs State | vs National | |
| 1. | Mayfield Colony | 100.0% | 2.6%(+97.4)#1 | 3.1%(+96.9)#21 |
| 2. | Shamrock Colony | 100.0% | 2.6%(+97.4)#2 | 3.1%(+96.9)#22 |
| 3. | Long Hollow | 89.9% | 2.6%(+87.3)#3 | 3.1%(+86.8)#42 |
| 4. | Okreek | 71.4% | 2.6%(+68.8)#4 | 3.1%(+68.3)#62 |
| 5. | Sicangu | 56.0% | 2.6%(+53.4)#5 | 3.1%(+52.9)#91 |
| 6. | Corn Creek | 53.1% | 2.6%(+50.5)#6 | 3.1%(+50.0)#107 |
| 7. | Wounded Knee | 51.7% | 2.6%(+49.1)#7 | 3.1%(+48.6)#116 |
| 8. | Bridger | 47.4% | 2.6%(+44.8)#8 | 3.1%(+44.3)#148 |
| 9. | Swift Bird | 46.7% | 2.6%(+44.1)#9 | 3.1%(+43.6)#151 |
| 10. | Clark Colony | 46.7% | 2.6%(+44.1)#10 | 3.1%(+43.6)#153 |
| 11. | Two Strike | 45.2% | 2.6%(+42.6)#11 | 3.1%(+42.1)#163 |
| 12. | Wood | 42.9% | 2.6%(+40.3)#12 | 3.1%(+39.8)#183 |
| 13. | Kyle | 39.8% | 2.6%(+37.2)#13 | 3.1%(+36.7)#221 |
| 14. | Interior | 38.5% | 2.6%(+35.9)#14 | 3.1%(+35.4)#238 |
| 15. | Antelope | 37.4% | 2.6%(+34.8)#15 | 3.1%(+34.3)#252 |
| 16. | Manderson White Horse Creek | 37.0% | 2.6%(+34.4)#16 | 3.1%(+33.9)#259 |
| 17. | Norris | 33.3% | 2.6%(+30.7)#17 | 3.1%(+30.2)#321 |
| 18. | Porcupine | 32.7% | 2.6%(+30.1)#18 | 3.1%(+29.6)#338 |
| 19. | Wanblee | 32.2% | 2.6%(+29.6)#19 | 3.1%(+29.1)#352 |
| 20. | Wakpala | 31.7% | 2.6%(+29.1)#20 | 3.1%(+28.6)#361 |
| 21. | Mission | 26.1% | 2.6%(+23.5)#21 | 3.1%(+23.0)#540 |
| 22. | Bullhead | 25.6% | 2.6%(+23.0)#22 | 3.1%(+22.5)#566 |
| 23. | Fairfax | 25.0% | 2.6%(+22.4)#23 | 3.1%(+21.9)#597 |
| 24. | Fort Thompson | 22.6% | 2.6%(+20.0)#24 | 3.1%(+19.5)#722 |
| 25. | Peever | 20.0% | 2.6%(+17.4)#25 | 3.1%(+16.9)#900 |
| 26. | Agar | 20.0% | 2.6%(+17.4)#26 | 3.1%(+16.9)#904 |
| 27. | St Francis | 19.3% | 2.6%(+16.7)#27 | 3.1%(+16.2)#977 |
| 28. | Philip | 19.1% | 2.6%(+16.5)#28 | 3.1%(+16.0)#997 |
| 29. | Rosebud | 18.9% | 2.6%(+16.3)#29 | 3.1%(+15.8)#1,012 |
| 30. | Enemy Swim | 18.3% | 2.6%(+15.7)#30 | 3.1%(+15.2)#1,070 |
| 31. | Horse Creek | 18.2% | 2.6%(+15.6)#31 | 3.1%(+15.1)#1,081 |
| 32. | Cherry Creek | 17.9% | 2.6%(+15.3)#32 | 3.1%(+14.8)#1,121 |
| 33. | Agency Village | 16.9% | 2.6%(+14.3)#33 | 3.1%(+13.8)#1,219 |
| 34. | Conde | 16.7% | 2.6%(+14.1)#34 | 3.1%(+13.6)#1,249 |
| 35. | New Witten | 16.7% | 2.6%(+14.1)#35 | 3.1%(+13.6)#1,253 |
| 36. | Lower Brule | 15.7% | 2.6%(+13.1)#36 | 3.1%(+12.6)#1,357 |
| 37. | Elkton | 15.2% | 2.6%(+12.6)#37 | 3.1%(+12.1)#1,439 |
| 38. | La Plant | 15.2% | 2.6%(+12.6)#38 | 3.1%(+12.1)#1,445 |
| 39. | Eagle Butte | 14.9% | 2.6%(+12.3)#39 | 3.1%(+11.8)#1,473 |
| 40. | Burke | 14.8% | 2.6%(+12.2)#40 | 3.1%(+11.7)#1,493 |
| 41. | Delmont | 14.8% | 2.6%(+12.2)#41 | 3.1%(+11.7)#1,502 |
| 42. | Fruitdale | 14.8% | 2.6%(+12.2)#42 | 3.1%(+11.7)#1,504 |
| 43. | Oglala | 14.7% | 2.6%(+12.1)#43 | 3.1%(+11.6)#1,512 |
| 44. | Twin Brooks | 14.3% | 2.6%(+11.7)#44 | 3.1%(+11.2)#1,622 |
| 45. | North Eagle Butte | 14.2% | 2.6%(+11.6)#45 | 3.1%(+11.1)#1,632 |
| 46. | Little Eagle | 13.8% | 2.6%(+11.2)#46 | 3.1%(+10.7)#1,710 |
| 47. | Alcester | 13.6% | 2.6%(+11.0)#47 | 3.1%(+10.5)#1,742 |
| 48. | White River | 13.4% | 2.6%(+10.8)#48 | 3.1%(+10.3)#1,793 |
| 49. | Marty | 13.0% | 2.6%(+10.4)#49 | 3.1%(+9.90)#1,886 |
| 50. | Lake Andes | 12.8% | 2.6%(+10.2)#50 | 3.1%(+9.70)#1,919 |
| 51. | Grenville | 12.5% | 2.6%(+9.90)#51 | 3.1%(+9.40)#2,012 |
| 52. | Howard | 12.4% | 2.6%(+9.80)#52 | 3.1%(+9.30)#2,033 |
| 53. | Parmelee | 12.2% | 2.6%(+9.60)#53 | 3.1%(+9.10)#2,081 |
| 54. | White Horse | 11.5% | 2.6%(+8.90)#54 | 3.1%(+8.40)#2,307 |
| 55. | Erwin | 11.1% | 2.6%(+8.50)#55 | 3.1%(+8.00)#2,453 |
| 56. | Allen | 10.9% | 2.6%(+8.30)#56 | 3.1%(+7.80)#2,495 |
| 57. | South Shore | 10.9% | 2.6%(+8.30)#57 | 3.1%(+7.80)#2,508 |
| 58. | Hermosa | 10.1% | 2.6%(+7.50)#58 | 3.1%(+7.00)#2,816 |
| 59. | Oahe Acres | 10.0% | 2.6%(+7.40)#59 | 3.1%(+6.90)#2,859 |
| 60. | Hosmer | 10.0% | 2.6%(+7.40)#60 | 3.1%(+6.90)#2,866 |
| 61. | Stratford | 10.0% | 2.6%(+7.40)#61 | 3.1%(+6.90)#2,888 |
| 62. | Nunda | 10.0% | 2.6%(+7.40)#62 | 3.1%(+6.90)#2,892 |
| 63. | Kadoka | 9.3% | 2.6%(+6.70)#63 | 3.1%(+6.20)#3,204 |
| 64. | Mound City | 9.1% | 2.6%(+6.50)#64 | 3.1%(+6.00)#3,325 |
| 65. | Winner | 8.8% | 2.6%(+6.20)#65 | 3.1%(+5.70)#3,450 |
| 66. | Whitehorse | 8.8% | 2.6%(+6.20)#66 | 3.1%(+5.70)#3,484 |
| 67. | Ideal | 8.3% | 2.6%(+5.70)#67 | 3.1%(+5.20)#3,757 |
| 68. | Flandreau | 8.2% | 2.6%(+5.60)#68 | 3.1%(+5.10)#3,784 |
| 69. | West Brule | 7.1% | 2.6%(+4.50)#69 | 3.1%(+4.00)#4,570 |
| 70. | Doland | 7.1% | 2.6%(+4.50)#70 | 3.1%(+4.00)#4,580 |
| 71. | Custer | 6.9% | 2.6%(+4.30)#71 | 3.1%(+3.80)#4,733 |
| 72. | Platte | 6.5% | 2.6%(+3.90)#72 | 3.1%(+3.40)#5,108 |
| 73. | Vermillion | 6.3% | 2.6%(+3.70)#73 | 3.1%(+3.20)#5,262 |
| 74. | Canistota | 6.3% | 2.6%(+3.70)#74 | 3.1%(+3.20)#5,322 |
| 75. | Summit | 6.3% | 2.6%(+3.70)#75 | 3.1%(+3.20)#5,337 |
| 76. | Oelrichs | 6.3% | 2.6%(+3.70)#76 | 3.1%(+3.20)#5,350 |
| 77. | Oldham | 6.3% | 2.6%(+3.70)#77 | 3.1%(+3.20)#5,361 |
| 78. | Dakota Dunes | 6.2% | 2.6%(+3.60)#78 | 3.1%(+3.10)#5,409 |
| 79. | Cavour | 6.1% | 2.6%(+3.50)#79 | 3.1%(+3.00)#5,581 |
| 80. | Central City | 6.1% | 2.6%(+3.50)#80 | 3.1%(+3.00)#5,585 |
| 81. | Arlington | 6.0% | 2.6%(+3.40)#81 | 3.1%(+2.90)#5,659 |
| 82. | Jefferson | 6.0% | 2.6%(+3.40)#82 | 3.1%(+2.90)#5,669 |
| 83. | Timber Lake | 6.0% | 2.6%(+3.40)#83 | 3.1%(+2.90)#5,670 |
| 84. | New Effington | 6.0% | 2.6%(+3.40)#84 | 3.1%(+2.90)#5,704 |
| 85. | Pierpont | 5.7% | 2.6%(+3.10)#85 | 3.1%(+2.60)#6,062 |
| 86. | Garden City | 5.3% | 2.6%(+2.70)#86 | 3.1%(+2.20)#6,601 |
| 87. | Fairview | 5.3% | 2.6%(+2.70)#87 | 3.1%(+2.20)#6,602 |
| 88. | Murdo | 5.2% | 2.6%(+2.60)#88 | 3.1%(+2.10)#6,713 |
| 89. | Hot Springs | 5.1% | 2.6%(+2.50)#89 | 3.1%(+2.00)#6,768 |
| 90. | Woonsocket | 5.0% | 2.6%(+2.40)#90 | 3.1%(+1.90)#6,994 |
| 91. | Utica | 5.0% | 2.6%(+2.40)#91 | 3.1%(+1.90)#7,034 |
| 92. | Lemmon | 4.9% | 2.6%(+2.30)#92 | 3.1%(+1.80)#7,150 |
| 93. | Colome | 4.8% | 2.6%(+2.20)#93 | 3.1%(+1.70)#7,306 |
| 94. | Bonesteel | 4.8% | 2.6%(+2.20)#94 | 3.1%(+1.70)#7,314 |
| 95. | Isabel | 4.4% | 2.6%(+1.80)#95 | 3.1%(+1.30)#7,954 |
| 96. | Freeman | 4.2% | 2.6%(+1.60)#96 | 3.1%(+1.10)#8,257 |
| 97. | Gettysburg | 4.1% | 2.6%(+1.50)#97 | 3.1%(+1.000)#8,452 |
| 98. | Martin | 4.1% | 2.6%(+1.50)#98 | 3.1%(+1.000)#8,471 |
| 99. | Box Elder | 4.0% | 2.6%(+1.40)#99 | 3.1%(+0.900)#8,586 |
| 100. | Big Stone City | 4.0% | 2.6%(+1.40)#100 | 3.1%(+0.900)#8,673 |
Common Questions
What are the Top 10 Cities with the Highest Percentage of Families with Income Below $10,000 in South Dakota?
Top 10 Cities with the Highest Percentage of Families with Income Below $10,000 in South Dakota are:
#1
89.9%
#2
71.4%
#3
53.1%
#4
51.7%
#5
45.2%
#6
42.9%
#7
39.8%
#8
38.5%
#9
37.4%
#10
37.0%
What city has the Highest Percentage of Families with Income Below $10,000 in South Dakota?
Long Hollow has the Highest Percentage of Families with Income Below $10,000 in South Dakota with 89.9%.
What is the Percentage of Families with Income Below $10,000 in the State of South Dakota?
Percentage of Families with Income Below $10,000 in South Dakota is 2.6%.
What is the Percentage of Families with Income Below $10,000 in the United States?
Percentage of Families with Income Below $10,000 in the United States is 3.1%.