Cities with the Highest Percentage of Families with Income Below $10,000 in Mississippi
RELATED REPORTS & OPTIONS
Family Income | $0-10k
Mississippi
Compare Cities
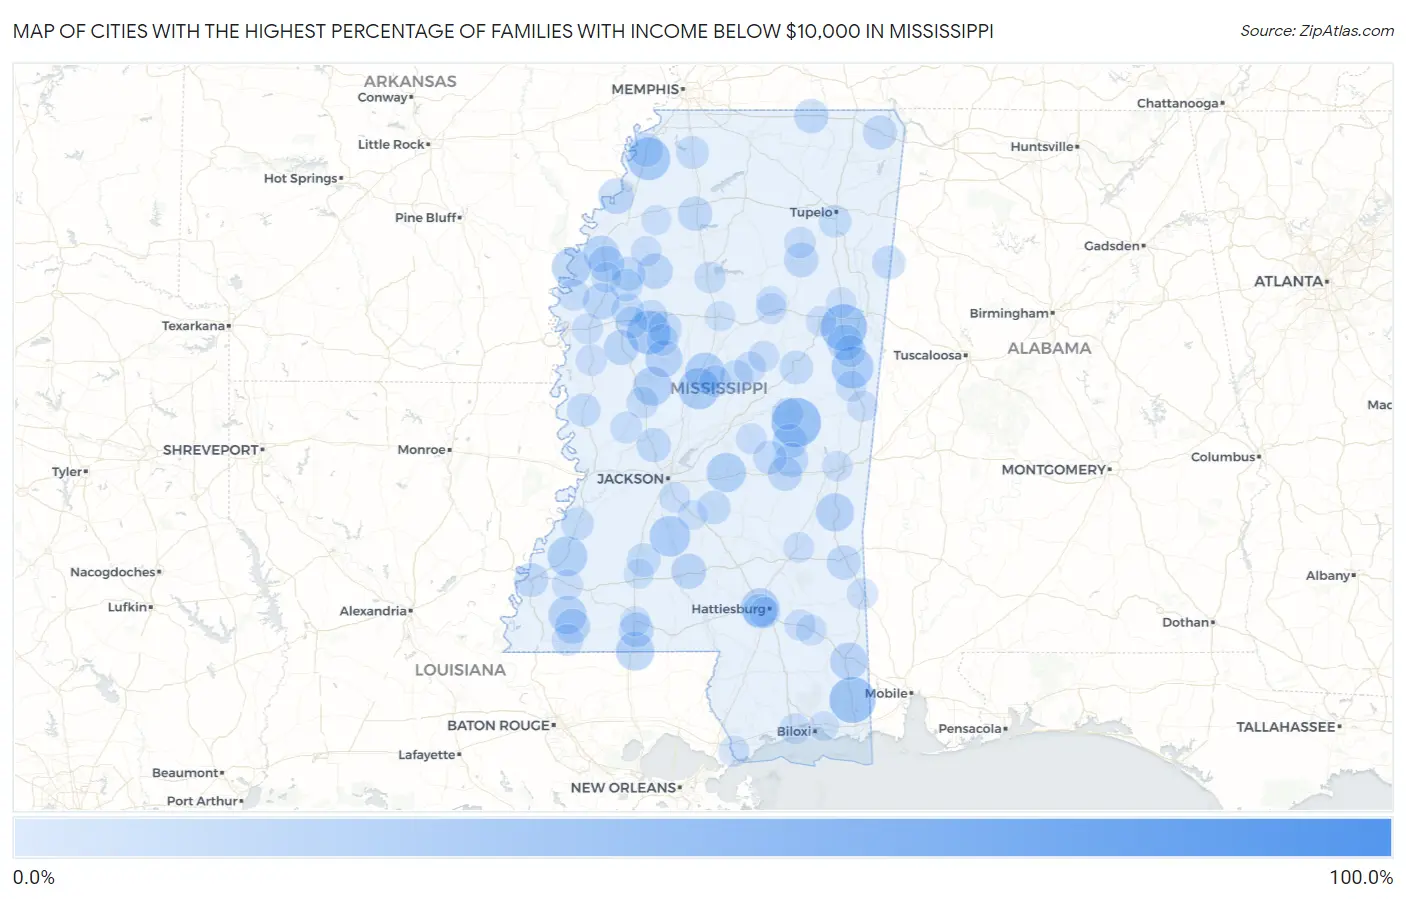
Map of Cities with the Highest Percentage of Families with Income Below $10,000 in Mississippi
0.0%
100.0%
Cities with the Highest Percentage of Families with Income Below $10,000 in Mississippi
| City | Families with Income < $10k | vs State | vs National | |
| 1. | Symonds | 100.0% | 5.0%(+95.0)#1 | 3.1%(+96.9)#31 |
| 2. | Tucker | 43.5% | 5.0%(+38.5)#2 | 3.1%(+40.4)#175 |
| 3. | Artesia | 38.2% | 5.0%(+33.2)#3 | 3.1%(+35.1)#239 |
| 4. | Wade | 37.6% | 5.0%(+32.6)#4 | 3.1%(+34.5)#244 |
| 5. | De Soto | 37.5% | 5.0%(+32.5)#5 | 3.1%(+34.4)#246 |
| 6. | Morgan City | 33.3% | 5.0%(+28.3)#6 | 3.1%(+30.2)#318 |
| 7. | White Oak | 31.8% | 5.0%(+26.8)#7 | 3.1%(+28.7)#359 |
| 8. | Macon | 30.3% | 5.0%(+25.3)#8 | 3.1%(+27.2)#398 |
| 9. | Goodman | 28.8% | 5.0%(+23.8)#9 | 3.1%(+25.7)#440 |
| 10. | Glen Allan | 28.3% | 5.0%(+23.3)#10 | 3.1%(+25.2)#461 |
| 11. | Georgetown | 28.0% | 5.0%(+23.0)#11 | 3.1%(+24.9)#468 |
| 12. | Fayette | 26.6% | 5.0%(+21.6)#12 | 3.1%(+23.5)#517 |
| 13. | Durant | 26.5% | 5.0%(+21.5)#13 | 3.1%(+23.4)#520 |
| 14. | Morton | 25.6% | 5.0%(+20.6)#14 | 3.1%(+22.5)#560 |
| 15. | Eden | 25.0% | 5.0%(+20.0)#15 | 3.1%(+21.9)#595 |
| 16. | Rosedale | 24.9% | 5.0%(+19.9)#16 | 3.1%(+21.8)#605 |
| 17. | Arnold Line | 24.1% | 5.0%(+19.1)#17 | 3.1%(+21.0)#636 |
| 18. | Osyka | 24.1% | 5.0%(+19.1)#18 | 3.1%(+21.0)#641 |
| 19. | Crosby | 23.8% | 5.0%(+18.8)#19 | 3.1%(+20.7)#659 |
| 20. | Quitman | 23.4% | 5.0%(+18.4)#20 | 3.1%(+20.3)#676 |
| 21. | Lucedale | 22.1% | 5.0%(+17.1)#21 | 3.1%(+19.0)#754 |
| 22. | Tchula | 21.5% | 5.0%(+16.5)#22 | 3.1%(+18.4)#786 |
| 23. | Shaw | 20.5% | 5.0%(+15.5)#23 | 3.1%(+17.4)#856 |
| 24. | Shelby | 20.3% | 5.0%(+15.3)#24 | 3.1%(+17.2)#872 |
| 25. | Crawford | 19.8% | 5.0%(+14.8)#25 | 3.1%(+16.7)#925 |
| 26. | Mound Bayou | 19.6% | 5.0%(+14.6)#26 | 3.1%(+16.5)#937 |
| 27. | Friars Point | 19.1% | 5.0%(+14.1)#27 | 3.1%(+16.0)#995 |
| 28. | Glendora | 18.8% | 5.0%(+13.8)#28 | 3.1%(+15.7)#1,025 |
| 29. | Isola | 18.2% | 5.0%(+13.2)#29 | 3.1%(+15.1)#1,074 |
| 30. | Silver Creek | 18.2% | 5.0%(+13.2)#30 | 3.1%(+15.1)#1,080 |
| 31. | Gloster | 18.1% | 5.0%(+13.1)#31 | 3.1%(+15.0)#1,098 |
| 32. | Magnolia | 18.0% | 5.0%(+13.0)#32 | 3.1%(+14.9)#1,104 |
| 33. | Houston | 17.5% | 5.0%(+12.5)#33 | 3.1%(+14.4)#1,151 |
| 34. | West Hattiesburg | 17.4% | 5.0%(+12.4)#34 | 3.1%(+14.3)#1,164 |
| 35. | Union | 17.3% | 5.0%(+12.3)#35 | 3.1%(+14.2)#1,170 |
| 36. | Decatur | 17.2% | 5.0%(+12.2)#36 | 3.1%(+14.1)#1,179 |
| 37. | Flora | 17.1% | 5.0%(+12.1)#37 | 3.1%(+14.0)#1,190 |
| 38. | Courtland | 17.0% | 5.0%(+12.0)#38 | 3.1%(+13.9)#1,208 |
| 39. | Waynesboro | 16.9% | 5.0%(+11.9)#39 | 3.1%(+13.8)#1,212 |
| 40. | Newton | 16.9% | 5.0%(+11.9)#40 | 3.1%(+13.8)#1,213 |
| 41. | Walnut | 16.7% | 5.0%(+11.7)#41 | 3.1%(+13.6)#1,236 |
| 42. | Natchez | 16.5% | 5.0%(+11.5)#42 | 3.1%(+13.4)#1,260 |
| 43. | Burnsville | 16.5% | 5.0%(+11.5)#43 | 3.1%(+13.4)#1,268 |
| 44. | North Tunica | 16.3% | 5.0%(+11.3)#44 | 3.1%(+13.2)#1,283 |
| 45. | Louisville | 16.0% | 5.0%(+11.0)#45 | 3.1%(+12.9)#1,314 |
| 46. | Drew | 16.0% | 5.0%(+11.0)#46 | 3.1%(+12.9)#1,316 |
| 47. | Sidon | 16.0% | 5.0%(+11.0)#47 | 3.1%(+12.9)#1,323 |
| 48. | Wesson | 15.9% | 5.0%(+10.9)#48 | 3.1%(+12.8)#1,330 |
| 49. | Conehatta | 15.9% | 5.0%(+10.9)#49 | 3.1%(+12.8)#1,333 |
| 50. | Puckett | 15.7% | 5.0%(+10.7)#50 | 3.1%(+12.6)#1,360 |
| 51. | Cary | 15.4% | 5.0%(+10.4)#51 | 3.1%(+12.3)#1,410 |
| 52. | Gattman | 15.4% | 5.0%(+10.4)#52 | 3.1%(+12.3)#1,416 |
| 53. | Itta Bena | 14.4% | 5.0%(+9.40)#53 | 3.1%(+11.3)#1,566 |
| 54. | Coldwater | 14.4% | 5.0%(+9.40)#54 | 3.1%(+11.3)#1,568 |
| 55. | Verona | 14.3% | 5.0%(+9.30)#55 | 3.1%(+11.2)#1,583 |
| 56. | Port Gibson | 14.3% | 5.0%(+9.30)#56 | 3.1%(+11.2)#1,589 |
| 57. | Sunflower | 14.2% | 5.0%(+9.20)#57 | 3.1%(+11.1)#1,635 |
| 58. | Kosciusko | 14.0% | 5.0%(+9.00)#58 | 3.1%(+10.9)#1,662 |
| 59. | Ruleville | 13.9% | 5.0%(+8.90)#59 | 3.1%(+10.8)#1,688 |
| 60. | Baxterville | 13.6% | 5.0%(+8.60)#60 | 3.1%(+10.5)#1,752 |
| 61. | Moorhead | 13.2% | 5.0%(+8.20)#61 | 3.1%(+10.1)#1,833 |
| 62. | Philadelphia | 13.1% | 5.0%(+8.10)#62 | 3.1%(+10.00)#1,852 |
| 63. | Centreville | 13.0% | 5.0%(+8.00)#63 | 3.1%(+9.90)#1,875 |
| 64. | Sallis | 12.8% | 5.0%(+7.80)#64 | 3.1%(+9.70)#1,929 |
| 65. | Yazoo City | 12.7% | 5.0%(+7.70)#65 | 3.1%(+9.60)#1,935 |
| 66. | Ethel | 12.7% | 5.0%(+7.70)#66 | 3.1%(+9.60)#1,958 |
| 67. | Brooksville | 12.5% | 5.0%(+7.50)#67 | 3.1%(+9.40)#1,991 |
| 68. | Cruger | 12.5% | 5.0%(+7.50)#68 | 3.1%(+9.40)#1,998 |
| 69. | Satartia | 12.5% | 5.0%(+7.50)#69 | 3.1%(+9.40)#2,016 |
| 70. | Benoit | 12.4% | 5.0%(+7.40)#70 | 3.1%(+9.30)#2,041 |
| 71. | Grenada | 12.1% | 5.0%(+7.10)#71 | 3.1%(+9.00)#2,090 |
| 72. | New Houlka | 12.1% | 5.0%(+7.10)#72 | 3.1%(+9.00)#2,108 |
| 73. | Hollandale | 11.8% | 5.0%(+6.80)#73 | 3.1%(+8.70)#2,183 |
| 74. | State Line | 11.6% | 5.0%(+6.60)#74 | 3.1%(+8.50)#2,250 |
| 75. | New Augusta | 11.5% | 5.0%(+6.50)#75 | 3.1%(+8.40)#2,298 |
| 76. | Hattiesburg | 11.4% | 5.0%(+6.40)#76 | 3.1%(+8.30)#2,311 |
| 77. | Walnut Grove | 11.3% | 5.0%(+6.30)#77 | 3.1%(+8.20)#2,366 |
| 78. | Leland | 11.2% | 5.0%(+6.20)#78 | 3.1%(+8.10)#2,386 |
| 79. | Eupora | 11.2% | 5.0%(+6.20)#79 | 3.1%(+8.10)#2,390 |
| 80. | Roxie | 11.2% | 5.0%(+6.20)#80 | 3.1%(+8.10)#2,396 |
| 81. | Pearlington | 11.2% | 5.0%(+6.20)#81 | 3.1%(+8.10)#2,397 |
| 82. | Mccool | 11.1% | 5.0%(+6.10)#82 | 3.1%(+8.00)#2,452 |
| 83. | Gulfport | 11.0% | 5.0%(+6.00)#83 | 3.1%(+7.90)#2,456 |
| 84. | Beaumont | 11.0% | 5.0%(+6.00)#84 | 3.1%(+7.90)#2,472 |
| 85. | Scooba | 11.0% | 5.0%(+6.00)#85 | 3.1%(+7.90)#2,475 |
| 86. | Shuqualak | 11.0% | 5.0%(+6.00)#86 | 3.1%(+7.90)#2,478 |
| 87. | Starkville | 10.7% | 5.0%(+5.70)#87 | 3.1%(+7.60)#2,546 |
| 88. | Florence | 10.7% | 5.0%(+5.70)#88 | 3.1%(+7.60)#2,551 |
| 89. | Sandersville | 10.6% | 5.0%(+5.60)#89 | 3.1%(+7.50)#2,613 |
| 90. | Sumner | 10.5% | 5.0%(+5.50)#90 | 3.1%(+7.40)#2,653 |
| 91. | Meridian | 10.4% | 5.0%(+5.40)#91 | 3.1%(+7.30)#2,667 |
| 92. | Renova | 10.2% | 5.0%(+5.20)#92 | 3.1%(+7.10)#2,777 |
| 93. | West Point | 10.1% | 5.0%(+5.10)#93 | 3.1%(+7.00)#2,792 |
| 94. | Mccomb | 10.0% | 5.0%(+5.00)#94 | 3.1%(+6.90)#2,823 |
| 95. | Lambert | 10.0% | 5.0%(+5.00)#95 | 3.1%(+6.90)#2,843 |
| 96. | Braxton | 10.0% | 5.0%(+5.00)#96 | 3.1%(+6.90)#2,869 |
| 97. | Walthall | 10.0% | 5.0%(+5.00)#97 | 3.1%(+6.90)#2,876 |
| 98. | Winona | 9.8% | 5.0%(+4.80)#98 | 3.1%(+6.70)#2,935 |
| 99. | Gulf Hills | 9.7% | 5.0%(+4.70)#99 | 3.1%(+6.60)#2,975 |
| 100. | Brookhaven | 9.6% | 5.0%(+4.60)#100 | 3.1%(+6.50)#3,030 |
Common Questions
What are the Top 10 Cities with the Highest Percentage of Families with Income Below $10,000 in Mississippi?
Top 10 Cities with the Highest Percentage of Families with Income Below $10,000 in Mississippi are:
#1
43.5%
#2
38.2%
#3
37.6%
#4
33.3%
#5
31.8%
#6
30.3%
#7
28.8%
#8
28.0%
#9
26.6%
#10
26.5%
What city has the Highest Percentage of Families with Income Below $10,000 in Mississippi?
Tucker has the Highest Percentage of Families with Income Below $10,000 in Mississippi with 43.5%.
What is the Percentage of Families with Income Below $10,000 in the State of Mississippi?
Percentage of Families with Income Below $10,000 in Mississippi is 5.0%.
What is the Percentage of Families with Income Below $10,000 in the United States?
Percentage of Families with Income Below $10,000 in the United States is 3.1%.