Cities with the Highest Percentage of Families with Income Below $10,000 in West Virginia
RELATED REPORTS & OPTIONS
Family Income | $0-10k
West Virginia
Compare Cities
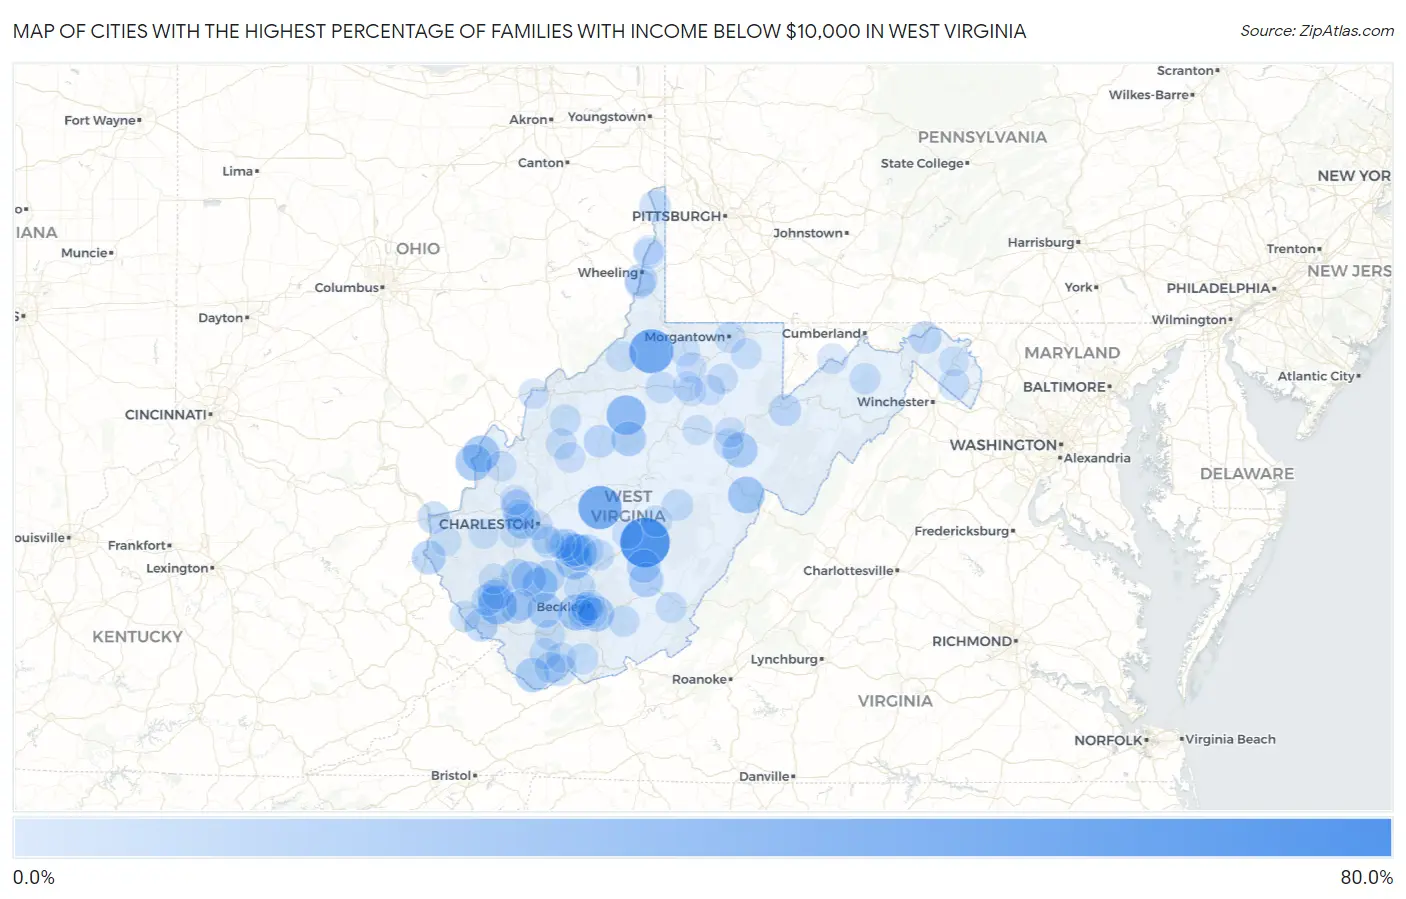
Map of Cities with the Highest Percentage of Families with Income Below $10,000 in West Virginia
0.0%
80.0%
Cities with the Highest Percentage of Families with Income Below $10,000 in West Virginia
| City | Families with Income < $10k | vs State | vs National | |
| 1. | Baxter | 75.6% | 4.2%(+71.4)#1 | 3.1%(+72.5)#56 |
| 2. | Nettie | 73.0% | 4.2%(+68.8)#2 | 3.1%(+69.9)#60 |
| 3. | Jacksonburg | 53.8% | 4.2%(+49.6)#3 | 3.1%(+50.7)#101 |
| 4. | Clay | 50.9% | 4.2%(+46.7)#4 | 3.1%(+47.8)#121 |
| 5. | Auburn | 37.5% | 4.2%(+33.3)#5 | 3.1%(+34.4)#250 |
| 6. | Switzer | 35.5% | 4.2%(+31.3)#6 | 3.1%(+32.4)#285 |
| 7. | Henderson | 27.8% | 4.2%(+23.6)#7 | 3.1%(+24.7)#477 |
| 8. | Frank | 27.8% | 4.2%(+23.6)#8 | 3.1%(+24.7)#478 |
| 9. | Gallipolis Ferry | 27.7% | 4.2%(+23.5)#9 | 3.1%(+24.6)#481 |
| 10. | Powellton | 27.6% | 4.2%(+23.4)#10 | 3.1%(+24.5)#487 |
| 11. | Boomer | 27.3% | 4.2%(+23.1)#11 | 3.1%(+24.2)#493 |
| 12. | Lester | 26.6% | 4.2%(+22.4)#12 | 3.1%(+23.5)#518 |
| 13. | Daniels | 24.8% | 4.2%(+20.6)#13 | 3.1%(+21.7)#608 |
| 14. | Twilight | 24.0% | 4.2%(+19.8)#14 | 3.1%(+20.9)#648 |
| 15. | Kopperston | 22.9% | 4.2%(+18.7)#15 | 3.1%(+19.8)#705 |
| 16. | Beverly | 22.9% | 4.2%(+18.7)#16 | 3.1%(+19.8)#706 |
| 17. | Jefferson | 22.5% | 4.2%(+18.3)#17 | 3.1%(+19.4)#731 |
| 18. | Crooked Creek | 22.2% | 4.2%(+18.0)#18 | 3.1%(+19.1)#744 |
| 19. | Van | 21.9% | 4.2%(+17.7)#19 | 3.1%(+18.8)#769 |
| 20. | Glenville | 21.7% | 4.2%(+17.5)#20 | 3.1%(+18.6)#774 |
| 21. | Montgomery | 20.4% | 4.2%(+16.2)#21 | 3.1%(+17.3)#864 |
| 22. | Rupert | 20.3% | 4.2%(+16.1)#22 | 3.1%(+17.2)#874 |
| 23. | War | 20.0% | 4.2%(+15.8)#23 | 3.1%(+16.9)#892 |
| 24. | Fort Gay | 18.9% | 4.2%(+14.7)#24 | 3.1%(+15.8)#1,014 |
| 25. | Quinwood | 17.5% | 4.2%(+13.3)#25 | 3.1%(+14.4)#1,161 |
| 26. | Dorothy | 17.4% | 4.2%(+13.2)#26 | 3.1%(+14.3)#1,166 |
| 27. | Red Jacket | 17.0% | 4.2%(+12.8)#27 | 3.1%(+13.9)#1,209 |
| 28. | Poca | 16.2% | 4.2%(+12.0)#28 | 3.1%(+13.1)#1,292 |
| 29. | Mount Gay Shamrock | 14.9% | 4.2%(+10.7)#29 | 3.1%(+11.8)#1,472 |
| 30. | Grantsville | 14.8% | 4.2%(+10.6)#30 | 3.1%(+11.7)#1,497 |
| 31. | Benwood | 14.5% | 4.2%(+10.3)#31 | 3.1%(+11.4)#1,548 |
| 32. | Bath Berkeley Springs | 14.4% | 4.2%(+10.2)#32 | 3.1%(+11.3)#1,570 |
| 33. | Greenview | 14.0% | 4.2%(+9.80)#33 | 3.1%(+10.9)#1,679 |
| 34. | Whitesville | 14.0% | 4.2%(+9.80)#34 | 3.1%(+10.9)#1,681 |
| 35. | Accoville | 13.8% | 4.2%(+9.60)#35 | 3.1%(+10.7)#1,707 |
| 36. | Anawalt | 13.7% | 4.2%(+9.50)#36 | 3.1%(+10.6)#1,730 |
| 37. | Davis | 13.6% | 4.2%(+9.40)#37 | 3.1%(+10.5)#1,745 |
| 38. | Ceredo | 13.2% | 4.2%(+9.00)#38 | 3.1%(+10.1)#1,835 |
| 39. | Smithers | 12.8% | 4.2%(+8.60)#39 | 3.1%(+9.70)#1,920 |
| 40. | Pratt | 12.8% | 4.2%(+8.60)#40 | 3.1%(+9.70)#1,925 |
| 41. | Newark | 11.7% | 4.2%(+7.50)#41 | 3.1%(+8.60)#2,234 |
| 42. | New Cumberland | 11.6% | 4.2%(+7.40)#42 | 3.1%(+8.50)#2,246 |
| 43. | Holden | 11.6% | 4.2%(+7.40)#43 | 3.1%(+8.50)#2,259 |
| 44. | Chesapeake | 11.5% | 4.2%(+7.30)#44 | 3.1%(+8.40)#2,286 |
| 45. | Gauley Bridge | 11.3% | 4.2%(+7.10)#45 | 3.1%(+8.20)#2,371 |
| 46. | Salem | 11.1% | 4.2%(+6.90)#46 | 3.1%(+8.00)#2,419 |
| 47. | Addison Webster Springs | 11.1% | 4.2%(+6.90)#47 | 3.1%(+8.00)#2,425 |
| 48. | Camden On Gauley | 11.1% | 4.2%(+6.90)#48 | 3.1%(+8.00)#2,443 |
| 49. | Nitro | 11.0% | 4.2%(+6.80)#49 | 3.1%(+7.90)#2,457 |
| 50. | Pax | 10.7% | 4.2%(+6.50)#50 | 3.1%(+7.60)#2,583 |
| 51. | Romney | 10.4% | 4.2%(+6.20)#51 | 3.1%(+7.30)#2,675 |
| 52. | Elizabeth | 10.4% | 4.2%(+6.20)#52 | 3.1%(+7.30)#2,683 |
| 53. | Chattaroy | 10.3% | 4.2%(+6.10)#53 | 3.1%(+7.20)#2,726 |
| 54. | Middleway | 10.3% | 4.2%(+6.10)#54 | 3.1%(+7.20)#2,729 |
| 55. | Ansted | 10.2% | 4.2%(+6.00)#55 | 3.1%(+7.10)#2,775 |
| 56. | Welch | 10.1% | 4.2%(+5.90)#56 | 3.1%(+7.00)#2,795 |
| 57. | Hinton | 10.1% | 4.2%(+5.90)#57 | 3.1%(+7.00)#2,800 |
| 58. | Crab Orchard | 10.1% | 4.2%(+5.90)#58 | 3.1%(+7.00)#2,801 |
| 59. | Morgantown | 10.0% | 4.2%(+5.80)#59 | 3.1%(+6.90)#2,820 |
| 60. | Matoaka | 10.0% | 4.2%(+5.80)#60 | 3.1%(+6.90)#2,880 |
| 61. | Macarthur | 9.8% | 4.2%(+5.60)#61 | 3.1%(+6.70)#2,951 |
| 62. | West Logan | 9.7% | 4.2%(+5.50)#62 | 3.1%(+6.60)#3,016 |
| 63. | Gary | 9.6% | 4.2%(+5.40)#63 | 3.1%(+6.50)#3,051 |
| 64. | Mabscott | 9.4% | 4.2%(+5.20)#64 | 3.1%(+6.30)#3,133 |
| 65. | Fairlea | 9.3% | 4.2%(+5.10)#65 | 3.1%(+6.20)#3,189 |
| 66. | Robinette | 9.1% | 4.2%(+4.90)#66 | 3.1%(+6.00)#3,308 |
| 67. | Reedy | 8.9% | 4.2%(+4.70)#67 | 3.1%(+5.80)#3,425 |
| 68. | Alum Creek | 8.7% | 4.2%(+4.50)#68 | 3.1%(+5.60)#3,517 |
| 69. | Reedsville | 8.7% | 4.2%(+4.50)#69 | 3.1%(+5.60)#3,530 |
| 70. | Pineville | 8.7% | 4.2%(+4.50)#70 | 3.1%(+5.60)#3,531 |
| 71. | Grafton | 8.5% | 4.2%(+4.30)#71 | 3.1%(+5.40)#3,618 |
| 72. | Womelsdorf Coalton | 8.3% | 4.2%(+4.10)#72 | 3.1%(+5.20)#3,750 |
| 73. | Middlebourne | 8.2% | 4.2%(+4.00)#73 | 3.1%(+5.10)#3,797 |
| 74. | Piedmont | 8.1% | 4.2%(+3.90)#74 | 3.1%(+5.00)#3,851 |
| 75. | Beckley | 8.0% | 4.2%(+3.80)#75 | 3.1%(+4.90)#3,881 |
| 76. | Leon | 8.0% | 4.2%(+3.80)#76 | 3.1%(+4.90)#3,925 |
| 77. | Flemington | 8.0% | 4.2%(+3.80)#77 | 3.1%(+4.90)#3,929 |
| 78. | Summersville | 7.9% | 4.2%(+3.70)#78 | 3.1%(+4.80)#3,965 |
| 79. | Spencer | 7.8% | 4.2%(+3.60)#79 | 3.1%(+4.70)#4,038 |
| 80. | Washington | 7.8% | 4.2%(+3.60)#80 | 3.1%(+4.70)#4,048 |
| 81. | Chapmanville | 7.7% | 4.2%(+3.50)#81 | 3.1%(+4.60)#4,119 |
| 82. | Mcmechen | 7.6% | 4.2%(+3.40)#82 | 3.1%(+4.50)#4,178 |
| 83. | Windsor Heights | 7.6% | 4.2%(+3.40)#83 | 3.1%(+4.50)#4,197 |
| 84. | Bancroft | 7.6% | 4.2%(+3.40)#84 | 3.1%(+4.50)#4,201 |
| 85. | Mannington | 7.3% | 4.2%(+3.10)#85 | 3.1%(+4.20)#4,396 |
| 86. | Enterprise | 7.3% | 4.2%(+3.10)#86 | 3.1%(+4.20)#4,405 |
| 87. | Northfork | 7.2% | 4.2%(+3.00)#87 | 3.1%(+4.10)#4,499 |
| 88. | Junior | 7.2% | 4.2%(+3.00)#88 | 3.1%(+4.10)#4,500 |
| 89. | Martinsburg | 7.1% | 4.2%(+2.90)#89 | 3.1%(+4.00)#4,514 |
| 90. | Buckhannon | 7.0% | 4.2%(+2.80)#90 | 3.1%(+3.90)#4,628 |
| 91. | Sophia | 7.0% | 4.2%(+2.80)#91 | 3.1%(+3.90)#4,647 |
| 92. | Hamlin | 7.0% | 4.2%(+2.80)#92 | 3.1%(+3.90)#4,650 |
| 93. | Beaver | 7.0% | 4.2%(+2.80)#93 | 3.1%(+3.90)#4,660 |
| 94. | East Bank | 6.9% | 4.2%(+2.70)#94 | 3.1%(+3.80)#4,751 |
| 95. | Wayne | 6.8% | 4.2%(+2.60)#95 | 3.1%(+3.70)#4,822 |
| 96. | Marmet | 6.7% | 4.2%(+2.50)#96 | 3.1%(+3.60)#4,902 |
| 97. | Anmoore | 6.7% | 4.2%(+2.50)#97 | 3.1%(+3.60)#4,919 |
| 98. | Charleston | 6.5% | 4.2%(+2.30)#98 | 3.1%(+3.40)#5,052 |
| 99. | Beech Bottom | 6.5% | 4.2%(+2.30)#99 | 3.1%(+3.40)#5,123 |
| 100. | Clarksburg | 6.4% | 4.2%(+2.20)#100 | 3.1%(+3.30)#5,171 |
Common Questions
What are the Top 10 Cities with the Highest Percentage of Families with Income Below $10,000 in West Virginia?
Top 10 Cities with the Highest Percentage of Families with Income Below $10,000 in West Virginia are:
#1
73.0%
#2
53.8%
#3
50.9%
#4
37.5%
#5
35.5%
#6
27.8%
#7
27.8%
#8
27.7%
#9
27.6%
#10
27.3%
What city has the Highest Percentage of Families with Income Below $10,000 in West Virginia?
Nettie has the Highest Percentage of Families with Income Below $10,000 in West Virginia with 73.0%.
What is the Percentage of Families with Income Below $10,000 in the State of West Virginia?
Percentage of Families with Income Below $10,000 in West Virginia is 4.2%.
What is the Percentage of Families with Income Below $10,000 in the United States?
Percentage of Families with Income Below $10,000 in the United States is 3.1%.