Cities with the Highest Percentage of Families with Income Below $10,000 in Oregon
RELATED REPORTS & OPTIONS
Family Income | $0-10k
Oregon
Compare Cities
Map of Cities with the Highest Percentage of Families with Income Below $10,000 in Oregon
0.0%
60.0%
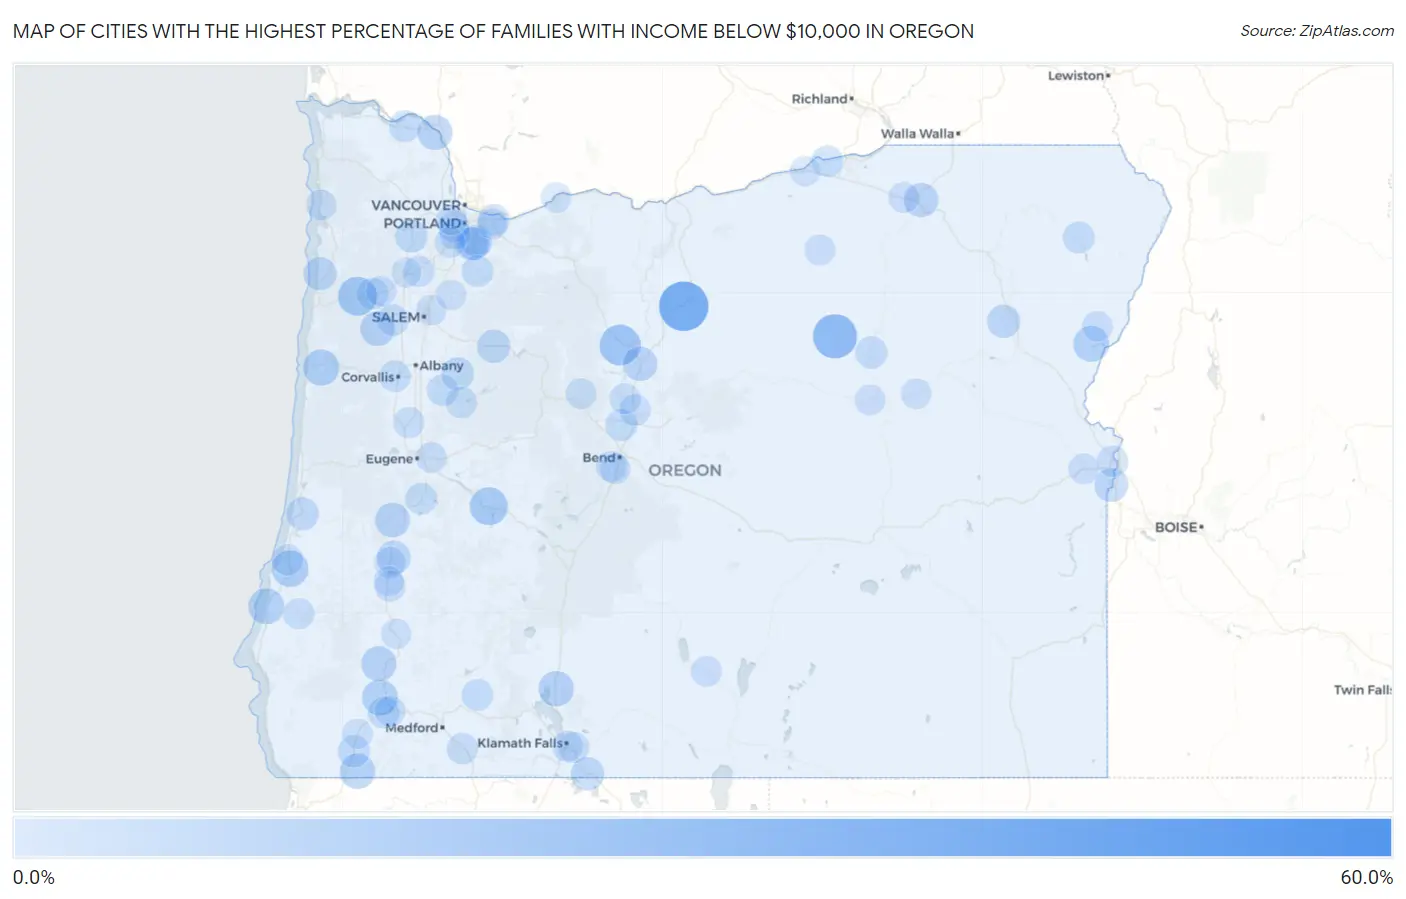
Cities with the Highest Percentage of Families with Income Below $10,000 in Oregon
| City | Families with Income < $10k | vs State | vs National | |
| 1. | Trent | 50.4% | 2.7%(+47.7)#1 | 3.1%(+47.3)#123 |
| 2. | Shaniko | 33.3% | 2.7%(+30.6)#2 | 3.1%(+30.2)#331 |
| 3. | Rocky Point | 31.8% | 2.7%(+29.1)#3 | 3.1%(+28.7)#360 |
| 4. | Monument | 25.0% | 2.7%(+22.3)#4 | 3.1%(+21.9)#596 |
| 5. | Beaver Marsh | 20.9% | 2.7%(+18.2)#5 | 3.1%(+17.8)#829 |
| 6. | Warm Springs | 19.8% | 2.7%(+17.1)#6 | 3.1%(+16.7)#924 |
| 7. | Grand Ronde | 17.2% | 2.7%(+14.5)#7 | 3.1%(+14.1)#1,180 |
| 8. | Oakridge | 15.5% | 2.7%(+12.8)#8 | 3.1%(+12.4)#1,384 |
| 9. | Mapleton | 15.4% | 2.7%(+12.7)#9 | 3.1%(+12.3)#1,408 |
| 10. | Bunker Hill | 13.7% | 2.7%(+11.0)#10 | 3.1%(+10.6)#1,721 |
| 11. | Toledo | 12.9% | 2.7%(+10.2)#11 | 3.1%(+9.80)#1,891 |
| 12. | Bandon | 12.5% | 2.7%(+9.80)#12 | 3.1%(+9.40)#1,977 |
| 13. | Merlin | 12.5% | 2.7%(+9.80)#13 | 3.1%(+9.40)#1,982 |
| 14. | Richland | 12.5% | 2.7%(+9.80)#14 | 3.1%(+9.40)#2,004 |
| 15. | Saunders Lake | 12.4% | 2.7%(+9.70)#15 | 3.1%(+9.30)#2,029 |
| 16. | River Point | 12.2% | 2.7%(+9.50)#16 | 3.1%(+9.10)#2,085 |
| 17. | Marcola | 11.9% | 2.7%(+9.20)#17 | 3.1%(+8.80)#2,166 |
| 18. | Chiloquin | 11.6% | 2.7%(+8.90)#18 | 3.1%(+8.50)#2,253 |
| 19. | Takilma | 11.6% | 2.7%(+8.90)#19 | 3.1%(+8.50)#2,256 |
| 20. | Bayshore | 11.5% | 2.7%(+8.80)#20 | 3.1%(+8.40)#2,293 |
| 21. | Cherry Grove | 11.4% | 2.7%(+8.70)#21 | 3.1%(+8.30)#2,340 |
| 22. | Glendale | 11.3% | 2.7%(+8.60)#22 | 3.1%(+8.20)#2,364 |
| 23. | Rainier | 10.9% | 2.7%(+8.20)#23 | 3.1%(+7.80)#2,489 |
| 24. | Falls City | 10.6% | 2.7%(+7.90)#24 | 3.1%(+7.50)#2,600 |
| 25. | Drain | 10.6% | 2.7%(+7.90)#25 | 3.1%(+7.50)#2,603 |
| 26. | Madras | 10.2% | 2.7%(+7.50)#26 | 3.1%(+7.10)#2,755 |
| 27. | Mission | 9.9% | 2.7%(+7.20)#27 | 3.1%(+6.80)#2,913 |
| 28. | Oakland | 9.3% | 2.7%(+6.60)#28 | 3.1%(+6.20)#3,190 |
| 29. | Nyssa | 9.2% | 2.7%(+6.50)#29 | 3.1%(+6.10)#3,229 |
| 30. | Jennings Lodge | 8.7% | 2.7%(+6.00)#30 | 3.1%(+5.60)#3,502 |
| 31. | Pacific City | 8.6% | 2.7%(+5.90)#31 | 3.1%(+5.50)#3,568 |
| 32. | Wedderburn | 8.6% | 2.7%(+5.90)#32 | 3.1%(+5.50)#3,598 |
| 33. | Merrill | 8.5% | 2.7%(+5.80)#33 | 3.1%(+5.40)#3,631 |
| 34. | Gates | 8.5% | 2.7%(+5.80)#34 | 3.1%(+5.40)#3,643 |
| 35. | Haines | 8.3% | 2.7%(+5.60)#35 | 3.1%(+5.20)#3,743 |
| 36. | Gaston | 7.8% | 2.7%(+5.10)#36 | 3.1%(+4.70)#4,056 |
| 37. | Gladstone | 7.7% | 2.7%(+5.00)#37 | 3.1%(+4.60)#4,078 |
| 38. | Reedsport | 7.7% | 2.7%(+5.00)#38 | 3.1%(+4.60)#4,089 |
| 39. | Lacomb | 7.7% | 2.7%(+5.00)#39 | 3.1%(+4.60)#4,123 |
| 40. | Johnson City | 7.3% | 2.7%(+4.60)#40 | 3.1%(+4.20)#4,425 |
| 41. | Cave Junction | 7.1% | 2.7%(+4.40)#41 | 3.1%(+4.00)#4,545 |
| 42. | Long Creek | 7.1% | 2.7%(+4.40)#42 | 3.1%(+4.00)#4,588 |
| 43. | Dallas | 6.5% | 2.7%(+3.80)#43 | 3.1%(+3.40)#5,056 |
| 44. | Redwood | 6.5% | 2.7%(+3.80)#44 | 3.1%(+3.40)#5,084 |
| 45. | Eagle Crest | 6.4% | 2.7%(+3.70)#45 | 3.1%(+3.30)#5,202 |
| 46. | Enterprise | 6.4% | 2.7%(+3.70)#46 | 3.1%(+3.30)#5,212 |
| 47. | Mulino | 6.3% | 2.7%(+3.60)#47 | 3.1%(+3.20)#5,290 |
| 48. | Cottage Grove | 6.2% | 2.7%(+3.50)#48 | 3.1%(+3.10)#5,389 |
| 49. | Clatskanie | 6.2% | 2.7%(+3.50)#49 | 3.1%(+3.10)#5,426 |
| 50. | Butte Falls | 6.2% | 2.7%(+3.50)#50 | 3.1%(+3.10)#5,465 |
| 51. | Corvallis | 6.1% | 2.7%(+3.40)#51 | 3.1%(+3.00)#5,477 |
| 52. | West Slope | 6.1% | 2.7%(+3.40)#52 | 3.1%(+3.00)#5,503 |
| 53. | Wood Village | 6.1% | 2.7%(+3.40)#53 | 3.1%(+3.00)#5,513 |
| 54. | Willamina | 6.1% | 2.7%(+3.40)#54 | 3.1%(+3.00)#5,530 |
| 55. | Irrigon | 6.1% | 2.7%(+3.40)#55 | 3.1%(+3.00)#5,535 |
| 56. | Sodaville | 6.1% | 2.7%(+3.40)#56 | 3.1%(+3.00)#5,568 |
| 57. | Ashland | 5.9% | 2.7%(+3.20)#57 | 3.1%(+2.80)#5,722 |
| 58. | North Bend | 5.8% | 2.7%(+3.10)#58 | 3.1%(+2.70)#5,852 |
| 59. | Sweet Home | 5.8% | 2.7%(+3.10)#59 | 3.1%(+2.70)#5,853 |
| 60. | Terrebonne | 5.8% | 2.7%(+3.10)#60 | 3.1%(+2.70)#5,904 |
| 61. | Sutherlin | 5.7% | 2.7%(+3.00)#61 | 3.1%(+2.60)#5,963 |
| 62. | Dayton | 5.7% | 2.7%(+3.00)#62 | 3.1%(+2.60)#5,983 |
| 63. | Dexter | 5.7% | 2.7%(+3.00)#63 | 3.1%(+2.60)#6,014 |
| 64. | Ontario | 5.6% | 2.7%(+2.90)#64 | 3.1%(+2.50)#6,083 |
| 65. | Metzger | 5.6% | 2.7%(+2.90)#65 | 3.1%(+2.50)#6,105 |
| 66. | Harrisburg | 5.4% | 2.7%(+2.70)#66 | 3.1%(+2.30)#6,369 |
| 67. | Altamont | 5.3% | 2.7%(+2.60)#67 | 3.1%(+2.20)#6,455 |
| 68. | Crooked River Ranch | 5.3% | 2.7%(+2.60)#68 | 3.1%(+2.20)#6,486 |
| 69. | Myrtle Point | 5.3% | 2.7%(+2.60)#69 | 3.1%(+2.20)#6,505 |
| 70. | Roseburg | 5.2% | 2.7%(+2.50)#70 | 3.1%(+2.10)#6,626 |
| 71. | Klamath Falls | 5.2% | 2.7%(+2.50)#71 | 3.1%(+2.10)#6,629 |
| 72. | Heceta Beach | 5.2% | 2.7%(+2.50)#72 | 3.1%(+2.10)#6,681 |
| 73. | Heppner | 5.1% | 2.7%(+2.40)#73 | 3.1%(+2.00)#6,802 |
| 74. | Seventh Mountain | 5.1% | 2.7%(+2.40)#74 | 3.1%(+2.00)#6,841 |
| 75. | Springfield | 5.0% | 2.7%(+2.30)#75 | 3.1%(+1.90)#6,878 |
| 76. | Paisley | 5.0% | 2.7%(+2.30)#76 | 3.1%(+1.90)#7,017 |
| 77. | Grants Pass | 4.8% | 2.7%(+2.10)#77 | 3.1%(+1.70)#7,206 |
| 78. | Deschutes River Woods | 4.8% | 2.7%(+2.10)#78 | 3.1%(+1.70)#7,239 |
| 79. | Camp Sherman | 4.8% | 2.7%(+2.10)#79 | 3.1%(+1.70)#7,317 |
| 80. | Pendleton | 4.7% | 2.7%(+2.00)#80 | 3.1%(+1.60)#7,355 |
| 81. | Vale | 4.7% | 2.7%(+2.00)#81 | 3.1%(+1.60)#7,427 |
| 82. | Rockaway Beach | 4.7% | 2.7%(+2.00)#82 | 3.1%(+1.60)#7,433 |
| 83. | Knappa | 4.7% | 2.7%(+2.00)#83 | 3.1%(+1.60)#7,447 |
| 84. | Falcon Heights | 4.7% | 2.7%(+2.00)#84 | 3.1%(+1.60)#7,453 |
| 85. | Mount Vernon | 4.7% | 2.7%(+2.00)#85 | 3.1%(+1.60)#7,463 |
| 86. | Hayesville | 4.5% | 2.7%(+1.80)#86 | 3.1%(+1.40)#7,639 |
| 87. | River Road | 4.5% | 2.7%(+1.80)#87 | 3.1%(+1.40)#7,662 |
| 88. | King City | 4.5% | 2.7%(+1.80)#88 | 3.1%(+1.40)#7,675 |
| 89. | Prairie City | 4.5% | 2.7%(+1.80)#89 | 3.1%(+1.40)#7,757 |
| 90. | Halfway | 4.5% | 2.7%(+1.80)#90 | 3.1%(+1.40)#7,775 |
| 91. | Gresham | 4.4% | 2.7%(+1.70)#91 | 3.1%(+1.30)#7,813 |
| 92. | Sheridan | 4.4% | 2.7%(+1.70)#92 | 3.1%(+1.30)#7,856 |
| 93. | Boardman | 4.3% | 2.7%(+1.60)#93 | 3.1%(+1.20)#8,028 |
| 94. | Cascade Locks | 4.3% | 2.7%(+1.60)#94 | 3.1%(+1.20)#8,071 |
| 95. | Cedar Mill | 4.2% | 2.7%(+1.50)#95 | 3.1%(+1.10)#8,194 |
| 96. | Selma | 4.2% | 2.7%(+1.50)#96 | 3.1%(+1.10)#8,281 |
| 97. | Roseburg North | 4.1% | 2.7%(+1.40)#97 | 3.1%(+1.000)#8,402 |
| 98. | Mcminnville | 4.0% | 2.7%(+1.30)#98 | 3.1%(+0.900)#8,561 |
| 99. | Mount Angel | 4.0% | 2.7%(+1.30)#99 | 3.1%(+0.900)#8,620 |
| 100. | Canyonville | 4.0% | 2.7%(+1.30)#100 | 3.1%(+0.900)#8,643 |
Common Questions
What are the Top 10 Cities with the Highest Percentage of Families with Income Below $10,000 in Oregon?
Top 10 Cities with the Highest Percentage of Families with Income Below $10,000 in Oregon are:
#1
33.3%
#2
25.0%
#3
19.8%
#4
17.2%
#5
15.5%
#6
13.7%
#7
12.9%
#8
12.5%
#9
12.5%
#10
12.5%
What city has the Highest Percentage of Families with Income Below $10,000 in Oregon?
Shaniko has the Highest Percentage of Families with Income Below $10,000 in Oregon with 33.3%.
What is the Percentage of Families with Income Below $10,000 in the State of Oregon?
Percentage of Families with Income Below $10,000 in Oregon is 2.7%.
What is the Percentage of Families with Income Below $10,000 in the United States?
Percentage of Families with Income Below $10,000 in the United States is 3.1%.