Cities with the Highest Percentage of Families with Income Below $10,000 in Maine
RELATED REPORTS & OPTIONS
Family Income | $0-10k
Maine
Compare Cities
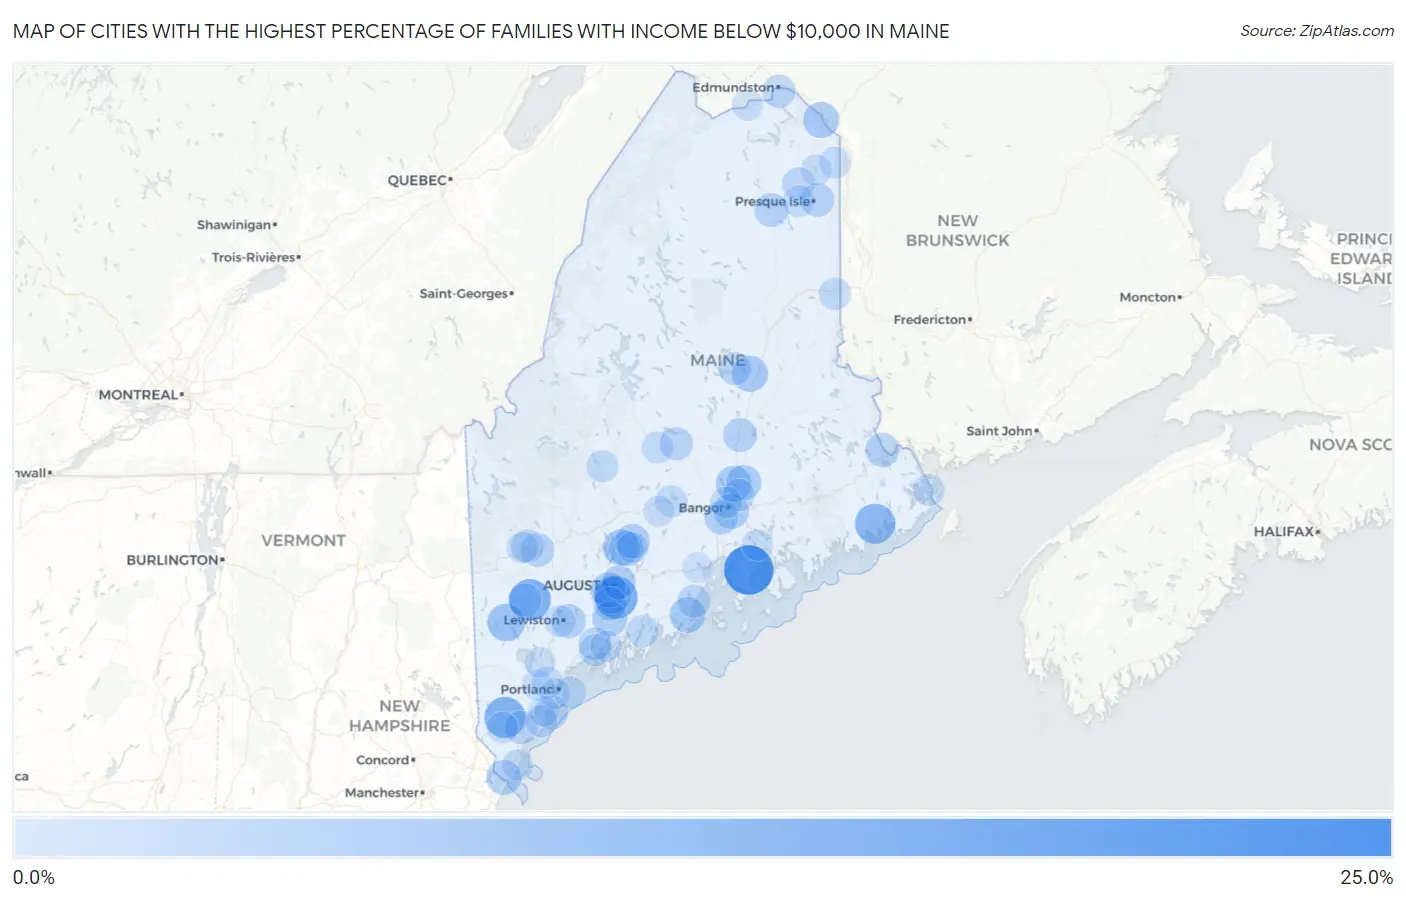
Map of Cities with the Highest Percentage of Families with Income Below $10,000 in Maine
0.0%
25.0%
Cities with the Highest Percentage of Families with Income Below $10,000 in Maine
| City | Families with Income < $10k | vs State | vs National | |
| 1. | Blue Hill | 24.1% | 2.1%(+22.0)#1 | 3.1%(+21.0)#638 |
| 2. | Bethel | 22.4% | 2.1%(+20.3)#2 | 3.1%(+19.3)#738 |
| 3. | Randolph | 15.2% | 2.1%(+13.1)#3 | 3.1%(+12.1)#1,436 |
| 4. | Patten | 14.8% | 2.1%(+12.7)#4 | 3.1%(+11.7)#1,496 |
| 5. | South Paris | 14.3% | 2.1%(+12.2)#5 | 3.1%(+11.2)#1,586 |
| 6. | Alfred | 13.7% | 2.1%(+11.6)#6 | 3.1%(+10.6)#1,724 |
| 7. | Machias | 12.1% | 2.1%(+10.00)#7 | 3.1%(+9.00)#2,099 |
| 8. | Jonesport | 9.8% | 2.1%(+7.70)#8 | 3.1%(+6.70)#2,955 |
| 9. | Kezar Falls | 9.1% | 2.1%(+7.00)#9 | 3.1%(+6.00)#3,301 |
| 10. | Farmingdale | 9.0% | 2.1%(+6.90)#10 | 3.1%(+5.90)#3,358 |
| 11. | Bridgton | 8.9% | 2.1%(+6.80)#11 | 3.1%(+5.80)#3,404 |
| 12. | Greene | 8.0% | 2.1%(+5.90)#12 | 3.1%(+4.90)#3,911 |
| 13. | Oakland | 7.5% | 2.1%(+5.40)#13 | 3.1%(+4.40)#4,232 |
| 14. | Van Buren | 7.1% | 2.1%(+5.00)#14 | 3.1%(+4.00)#4,547 |
| 15. | East Millinocket | 7.1% | 2.1%(+5.00)#15 | 3.1%(+4.00)#4,549 |
| 16. | Old Town | 6.8% | 2.1%(+4.70)#16 | 3.1%(+3.70)#4,795 |
| 17. | Rockland | 6.7% | 2.1%(+4.60)#17 | 3.1%(+3.60)#4,882 |
| 18. | Brewer | 6.3% | 2.1%(+4.20)#18 | 3.1%(+3.20)#5,268 |
| 19. | Hallowell | 6.1% | 2.1%(+4.00)#19 | 3.1%(+3.00)#5,527 |
| 20. | Waterville | 5.9% | 2.1%(+3.80)#20 | 3.1%(+2.80)#5,729 |
| 21. | Kittery | 5.9% | 2.1%(+3.80)#21 | 3.1%(+2.80)#5,748 |
| 22. | Milford | 5.9% | 2.1%(+3.80)#22 | 3.1%(+2.80)#5,763 |
| 23. | Richmond | 5.8% | 2.1%(+3.70)#23 | 3.1%(+2.70)#5,895 |
| 24. | Milbridge | 5.7% | 2.1%(+3.60)#24 | 3.1%(+2.60)#6,040 |
| 25. | Fairfield | 5.4% | 2.1%(+3.30)#25 | 3.1%(+2.30)#6,376 |
| 26. | Lewiston | 5.0% | 2.1%(+2.90)#26 | 3.1%(+1.90)#6,884 |
| 27. | Augusta | 4.7% | 2.1%(+2.60)#27 | 3.1%(+1.60)#7,354 |
| 28. | Woodland | 4.7% | 2.1%(+2.60)#28 | 3.1%(+1.60)#7,440 |
| 29. | Hampden | 4.6% | 2.1%(+2.50)#29 | 3.1%(+1.50)#7,543 |
| 30. | Ashland | 4.6% | 2.1%(+2.50)#30 | 3.1%(+1.50)#7,601 |
| 31. | Howland | 4.5% | 2.1%(+2.40)#31 | 3.1%(+1.40)#7,734 |
| 32. | Presque Isle | 4.4% | 2.1%(+2.30)#32 | 3.1%(+1.30)#7,850 |
| 33. | Dixfield | 4.4% | 2.1%(+2.30)#33 | 3.1%(+1.30)#7,898 |
| 34. | Gardiner | 4.1% | 2.1%(+2.00)#34 | 3.1%(+1.000)#8,389 |
| 35. | Old Orchard Beach | 4.0% | 2.1%(+1.90)#35 | 3.1%(+0.900)#8,597 |
| 36. | West Kennebunk | 4.0% | 2.1%(+1.90)#36 | 3.1%(+0.900)#8,656 |
| 37. | Madawaska | 3.9% | 2.1%(+1.80)#37 | 3.1%(+0.800)#8,812 |
| 38. | Dover Foxcroft | 3.8% | 2.1%(+1.70)#38 | 3.1%(+0.700)#9,005 |
| 39. | Mexico | 3.7% | 2.1%(+1.60)#39 | 3.1%(+0.600)#9,228 |
| 40. | Norway | 3.6% | 2.1%(+1.50)#40 | 3.1%(+0.500)#9,418 |
| 41. | Camden | 3.5% | 2.1%(+1.40)#41 | 3.1%(+0.400)#9,619 |
| 42. | Topsham | 3.4% | 2.1%(+1.30)#42 | 3.1%(+0.300)#9,798 |
| 43. | Millinocket | 3.4% | 2.1%(+1.30)#43 | 3.1%(+0.300)#9,815 |
| 44. | Washburn | 3.3% | 2.1%(+1.20)#44 | 3.1%(+0.200)#10,110 |
| 45. | Oakfield | 3.1% | 2.1%(+1.000)#45 | 3.1%(=0.000)#10,631 |
| 46. | Orono | 2.9% | 2.1%(+0.800)#46 | 3.1%(-0.200)#10,964 |
| 47. | Houlton | 2.7% | 2.1%(+0.600)#47 | 3.1%(-0.400)#11,520 |
| 48. | Damariscotta | 2.7% | 2.1%(+0.600)#48 | 3.1%(-0.400)#11,587 |
| 49. | Biddeford | 2.6% | 2.1%(+0.500)#49 | 3.1%(-0.500)#11,697 |
| 50. | South Berwick | 2.5% | 2.1%(+0.400)#50 | 3.1%(-0.600)#12,081 |
| 51. | Newport | 2.5% | 2.1%(+0.400)#51 | 3.1%(-0.600)#12,125 |
| 52. | Brunswick | 2.4% | 2.1%(+0.300)#52 | 3.1%(-0.700)#12,278 |
| 53. | Bingham | 2.4% | 2.1%(+0.300)#53 | 3.1%(-0.700)#12,475 |
| 54. | Portland | 2.3% | 2.1%(+0.200)#54 | 3.1%(-0.800)#12,540 |
| 55. | Guilford | 2.2% | 2.1%(+0.100)#55 | 3.1%(-0.900)#13,080 |
| 56. | Auburn | 2.1% | 2.1%(=0.000)#56 | 3.1%(-1.000)#13,178 |
| 57. | Westbrook | 2.1% | 2.1%(=0.000)#57 | 3.1%(-1.000)#13,186 |
| 58. | Mapleton | 2.1% | 2.1%(=0.000)#58 | 3.1%(-1.000)#13,381 |
| 59. | Eastport | 2.0% | 2.1%(-0.100)#59 | 3.1%(-1.10)#13,649 |
| 60. | Limestone | 2.0% | 2.1%(-0.100)#60 | 3.1%(-1.10)#13,653 |
| 61. | Bangor | 1.8% | 2.1%(-0.300)#61 | 3.1%(-1.30)#14,082 |
| 62. | Sanford | 1.8% | 2.1%(-0.300)#62 | 3.1%(-1.30)#14,101 |
| 63. | Veazie | 1.8% | 2.1%(-0.300)#63 | 3.1%(-1.30)#14,241 |
| 64. | Bath | 1.6% | 2.1%(-0.500)#64 | 3.1%(-1.50)#14,799 |
| 65. | Ellsworth | 1.6% | 2.1%(-0.500)#65 | 3.1%(-1.50)#14,802 |
| 66. | Caribou | 1.6% | 2.1%(-0.500)#66 | 3.1%(-1.50)#14,808 |
| 67. | Cape Neddick | 1.6% | 2.1%(-0.500)#67 | 3.1%(-1.50)#14,906 |
| 68. | Oak Hill | 1.5% | 2.1%(-0.600)#68 | 3.1%(-1.60)#15,165 |
| 69. | Rumford | 1.5% | 2.1%(-0.600)#69 | 3.1%(-1.60)#15,179 |
| 70. | Pittsfield | 1.5% | 2.1%(-0.600)#70 | 3.1%(-1.60)#15,198 |
| 71. | Fort Kent | 1.5% | 2.1%(-0.600)#71 | 3.1%(-1.60)#15,219 |
| 72. | Winslow | 1.4% | 2.1%(-0.700)#72 | 3.1%(-1.70)#15,503 |
| 73. | Gorham | 1.2% | 2.1%(-0.900)#73 | 3.1%(-1.90)#16,196 |
| 74. | North Windham | 1.0% | 2.1%(-1.10)#74 | 3.1%(-2.10)#16,923 |
| 75. | South Portland | 0.90% | 2.1%(-1.20)#75 | 3.1%(-2.20)#17,162 |
| 76. | Belfast | 0.90% | 2.1%(-1.20)#76 | 3.1%(-2.20)#17,256 |
| 77. | Saco | 0.80% | 2.1%(-1.30)#77 | 3.1%(-2.30)#17,517 |
1
2Common Questions
What are the Top 10 Cities with the Highest Percentage of Families with Income Below $10,000 in Maine?
Top 10 Cities with the Highest Percentage of Families with Income Below $10,000 in Maine are:
#1
24.1%
#2
15.2%
#3
14.3%
#4
13.7%
#5
12.1%
#6
9.0%
#7
8.9%
#8
7.5%
#9
7.1%
#10
7.1%
What city has the Highest Percentage of Families with Income Below $10,000 in Maine?
Blue Hill has the Highest Percentage of Families with Income Below $10,000 in Maine with 24.1%.
What is the Percentage of Families with Income Below $10,000 in the State of Maine?
Percentage of Families with Income Below $10,000 in Maine is 2.1%.
What is the Percentage of Families with Income Below $10,000 in the United States?
Percentage of Families with Income Below $10,000 in the United States is 3.1%.