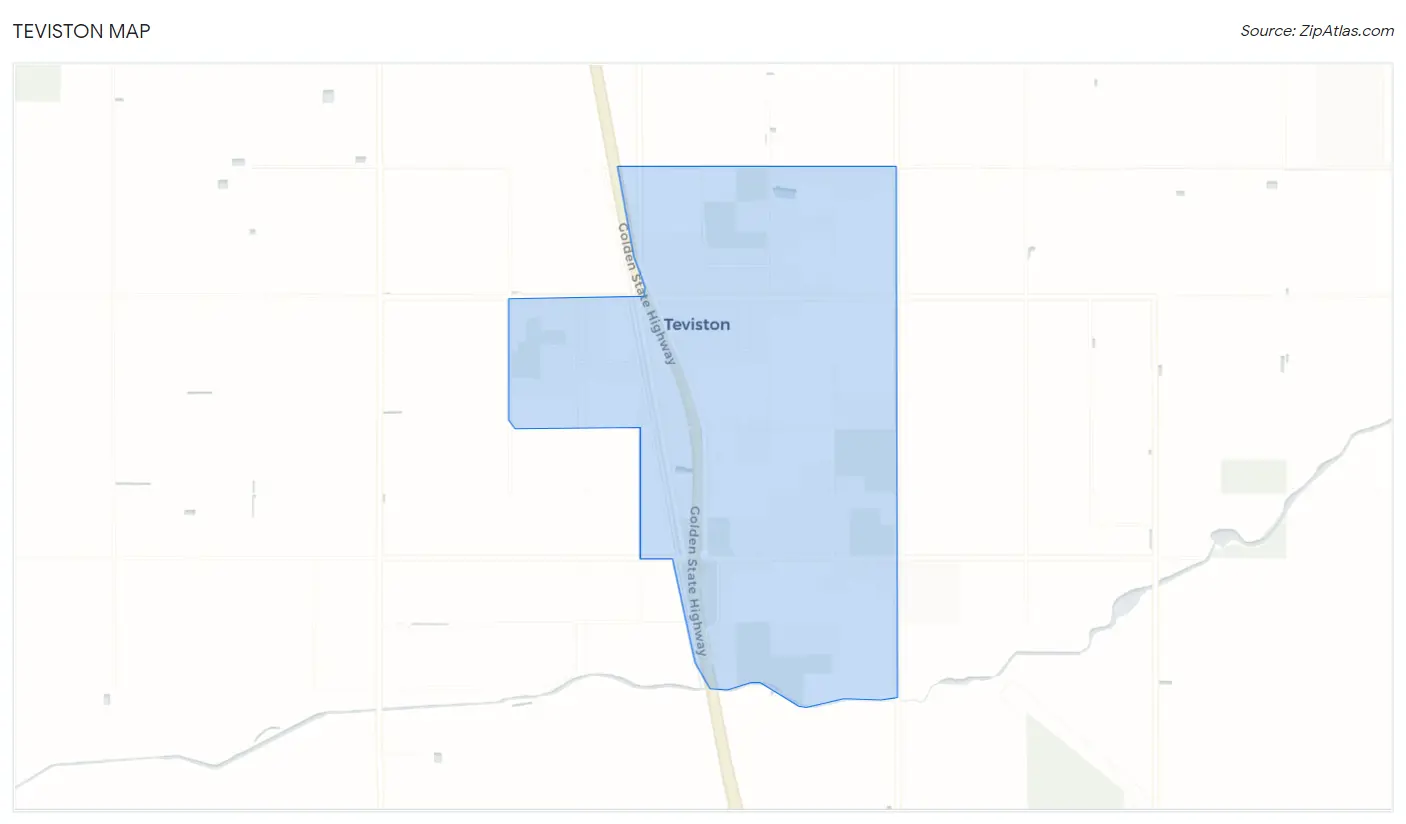
Teviston, CA Map & Demographics
Teviston Map
Teviston Overview
$15,160
PER CAPITA INCOME
$47,958
AVG FAMILY INCOME
$48,500
AVG HOUSEHOLD INCOME
0.30
INEQUALITY / GINI INDEX
1,038
TOTAL POPULATION
520
MALE POPULATION
518
FEMALE POPULATION
100.39
MALES / 100 FEMALES
99.62
FEMALES / 100 MALES
29.8
MEDIAN AGE
4.2
AVG FAMILY SIZE
4.0
AVG HOUSEHOLD SIZE
319
LABOR FORCE [ PEOPLE ]
40.5%
PERCENT IN LABOR FORCE
32.9%
UNEMPLOYMENT RATE
Income in Teviston
Income Overview in Teviston
Per Capita Income in Teviston is $15,160, while median incomes of families and households are $47,958 and $48,500 respectively.
| Characteristic | Number | Measure |
| Per Capita Income | 1,038 | $15,160 |
| Median Family Income | 245 | $47,958 |
| Mean Family Income | 245 | $52,963 |
| Median Household Income | 258 | $48,500 |
| Mean Household Income | 258 | $53,163 |
| Income Deficit | 245 | $0 |
| Wage / Income Gap (%) | 1,038 | 0.00% |
| Wage / Income Gap ($) | 1,038 | 100.00¢ per $1 |
| Gini / Inequality Index | 1,038 | 0.30 |
Earnings by Sex in Teviston
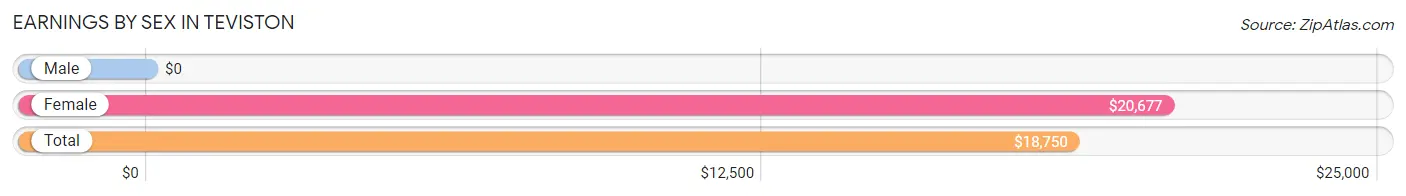
| Sex | Number | Average Earnings |
| Male | 189 (54.9%) | $0 |
| Female | 155 (45.1%) | $20,677 |
| Total | 344 (100.0%) | $18,750 |
Earnings by Sex by Income Bracket in Teviston
The most common earnings brackets in Teviston are $7,500 to $9,999 for men (70 | 37.0%) and $25,000 to $29,999 for women (41 | 26.5%).
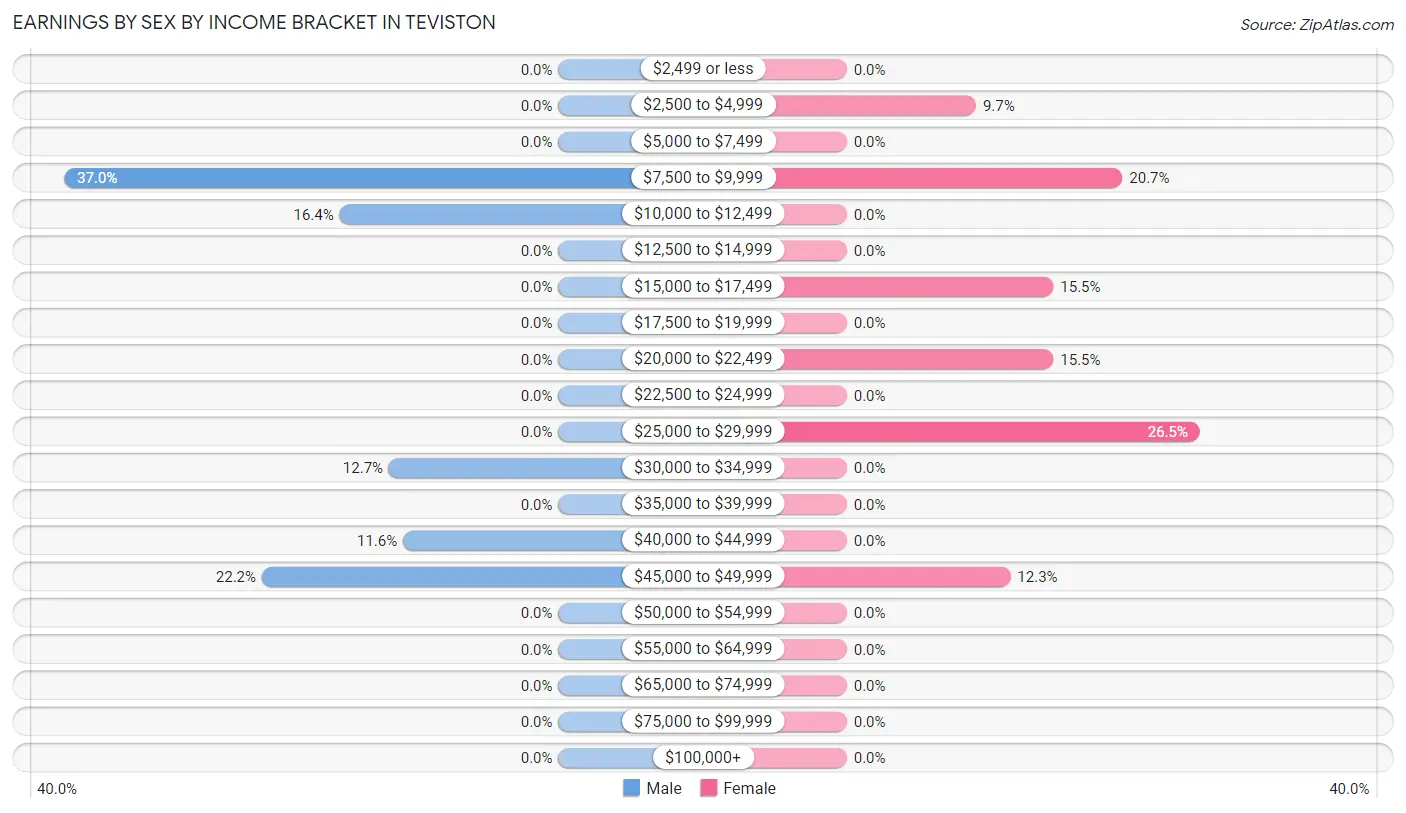
| Income | Male | Female |
| $2,499 or less | 0 (0.0%) | 0 (0.0%) |
| $2,500 to $4,999 | 0 (0.0%) | 15 (9.7%) |
| $5,000 to $7,499 | 0 (0.0%) | 0 (0.0%) |
| $7,500 to $9,999 | 70 (37.0%) | 32 (20.6%) |
| $10,000 to $12,499 | 31 (16.4%) | 0 (0.0%) |
| $12,500 to $14,999 | 0 (0.0%) | 0 (0.0%) |
| $15,000 to $17,499 | 0 (0.0%) | 24 (15.5%) |
| $17,500 to $19,999 | 0 (0.0%) | 0 (0.0%) |
| $20,000 to $22,499 | 0 (0.0%) | 24 (15.5%) |
| $22,500 to $24,999 | 0 (0.0%) | 0 (0.0%) |
| $25,000 to $29,999 | 0 (0.0%) | 41 (26.5%) |
| $30,000 to $34,999 | 24 (12.7%) | 0 (0.0%) |
| $35,000 to $39,999 | 0 (0.0%) | 0 (0.0%) |
| $40,000 to $44,999 | 22 (11.6%) | 0 (0.0%) |
| $45,000 to $49,999 | 42 (22.2%) | 19 (12.3%) |
| $50,000 to $54,999 | 0 (0.0%) | 0 (0.0%) |
| $55,000 to $64,999 | 0 (0.0%) | 0 (0.0%) |
| $65,000 to $74,999 | 0 (0.0%) | 0 (0.0%) |
| $75,000 to $99,999 | 0 (0.0%) | 0 (0.0%) |
| $100,000+ | 0 (0.0%) | 0 (0.0%) |
| Total | 189 (100.0%) | 155 (100.0%) |
Earnings by Sex by Educational Attainment in Teviston
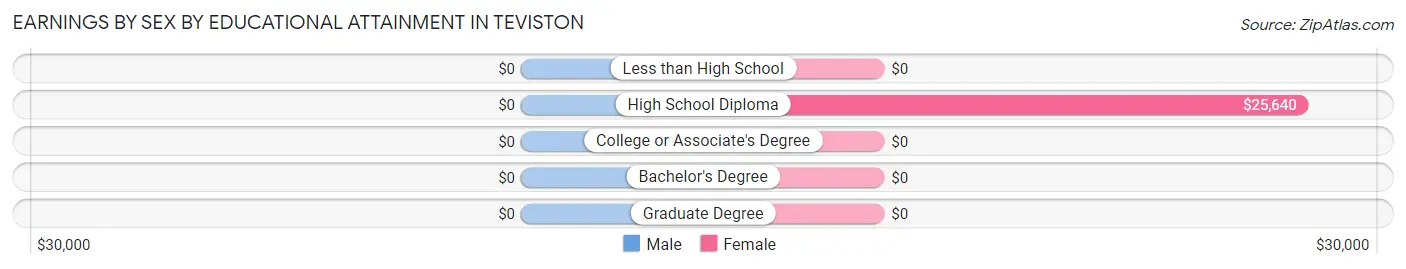
| Educational Attainment | Male Income | Female Income |
| Less than High School | - | - |
| High School Diploma | - | - |
| College or Associate's Degree | - | - |
| Bachelor's Degree | - | - |
| Graduate Degree | - | - |
| Total | - | - |
Family Income in Teviston
Family Income Brackets in Teviston
According to the Teviston family income data, there are 102 families falling into the $35,000 to $49,999 income range, which is the most common income bracket and makes up 41.6% of all families.
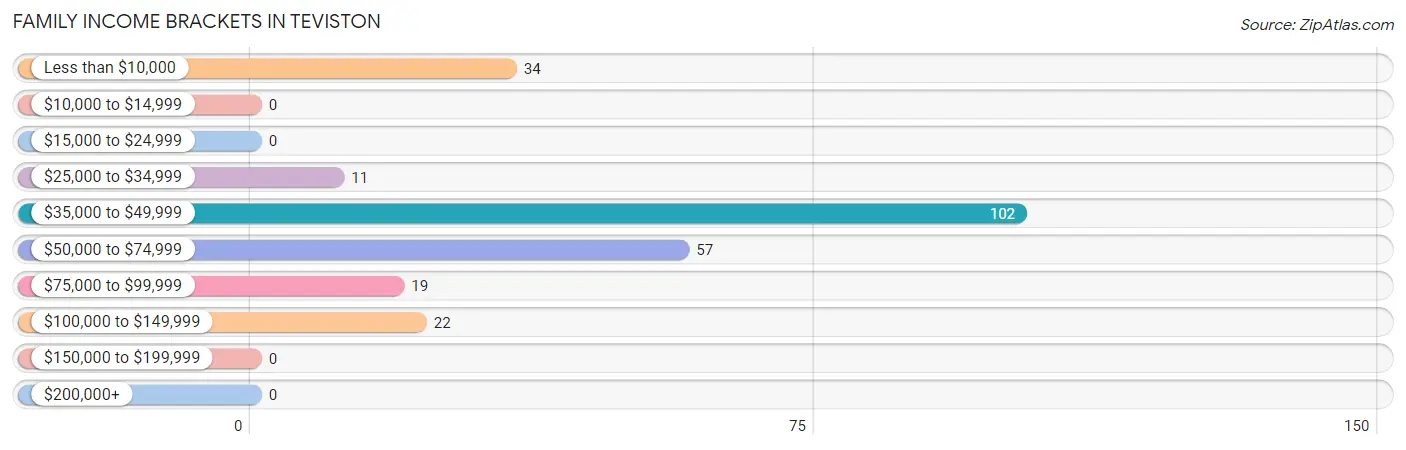
| Income Bracket | # Families | % Families |
| Less than $10,000 | 34 | 13.9% |
| $10,000 to $14,999 | 0 | 0.0% |
| $15,000 to $24,999 | 0 | 0.0% |
| $25,000 to $34,999 | 11 | 4.5% |
| $35,000 to $49,999 | 102 | 41.6% |
| $50,000 to $74,999 | 57 | 23.3% |
| $75,000 to $99,999 | 19 | 7.8% |
| $100,000 to $149,999 | 22 | 9.0% |
| $150,000 to $199,999 | 0 | 0.0% |
| $200,000+ | 0 | 0.0% |
Family Income by Famaliy Size in Teviston
3-person families (79 | 32.2%) account for the highest median family income in Teviston with $43,347 per family, while 3-person families (79 | 32.2%) have the highest median income of $14,449 per family member.
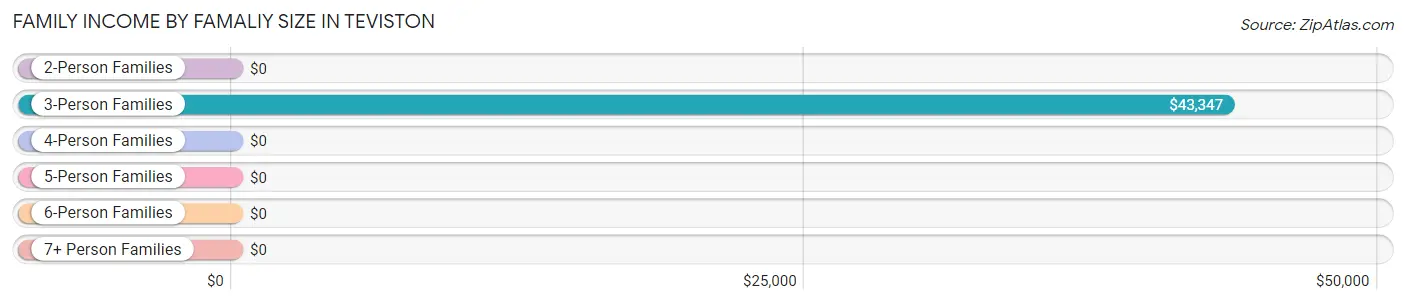
| Income Bracket | # Families | Median Income |
| 2-Person Families | 68 (27.8%) | $0 |
| 3-Person Families | 79 (32.2%) | $43,347 |
| 4-Person Families | 11 (4.5%) | $0 |
| 5-Person Families | 65 (26.5%) | $0 |
| 6-Person Families | 22 (9.0%) | $0 |
| 7+ Person Families | 0 (0.0%) | $0 |
| Total | 245 (100.0%) | $47,958 |
Family Income by Number of Earners in Teviston
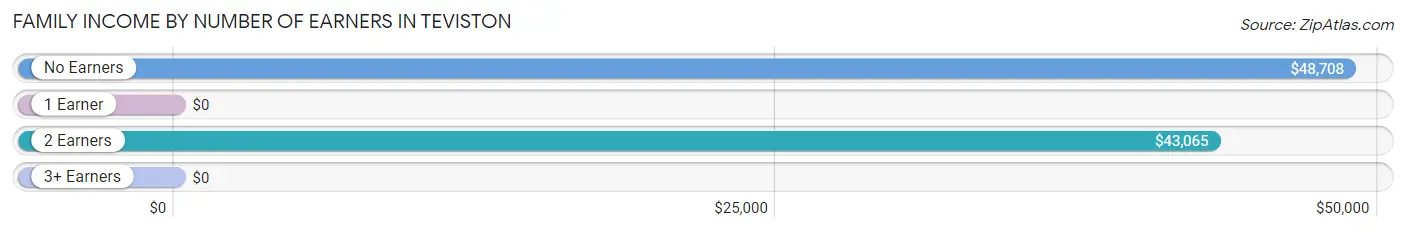
| Number of Earners | # Families | Median Income |
| No Earners | 97 (39.6%) | $48,708 |
| 1 Earner | 30 (12.2%) | $0 |
| 2 Earners | 96 (39.2%) | $43,065 |
| 3+ Earners | 22 (9.0%) | $0 |
| Total | 245 (100.0%) | $47,958 |
Household Income in Teviston
Household Income Brackets in Teviston
With 102 households falling in the category, the $35,000 to $49,999 income range is the most frequent in Teviston, accounting for 39.5% of all households.
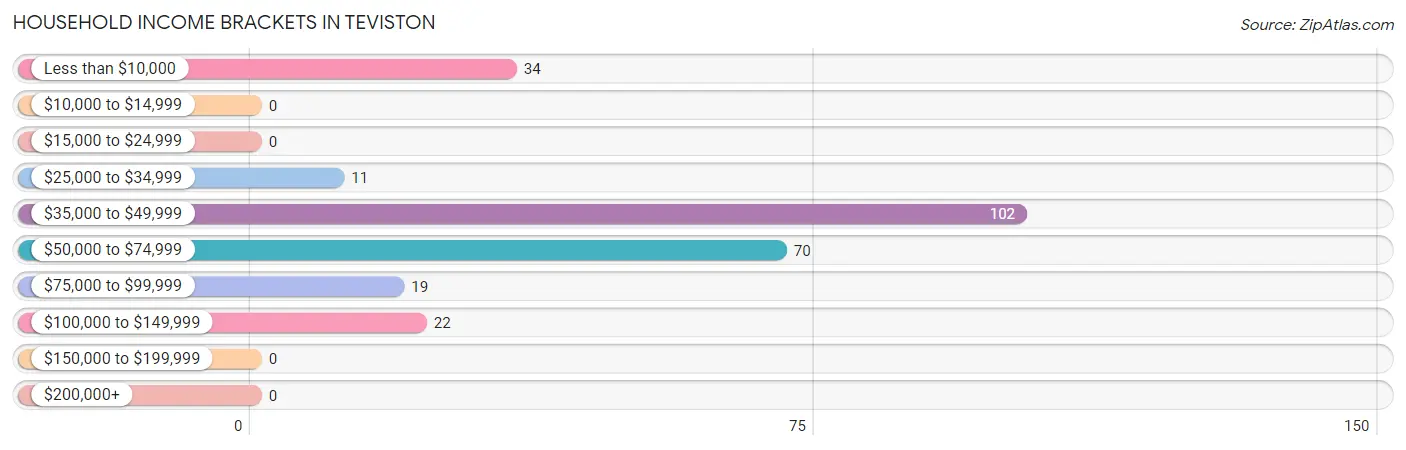
| Income Bracket | # Households | % Households |
| Less than $10,000 | 34 | 13.2% |
| $10,000 to $14,999 | 0 | 0.0% |
| $15,000 to $24,999 | 0 | 0.0% |
| $25,000 to $34,999 | 11 | 4.3% |
| $35,000 to $49,999 | 102 | 39.5% |
| $50,000 to $74,999 | 70 | 27.1% |
| $75,000 to $99,999 | 19 | 7.4% |
| $100,000 to $149,999 | 22 | 8.5% |
| $150,000 to $199,999 | 0 | 0.0% |
| $200,000+ | 0 | 0.0% |
Household Income by Householder Age in Teviston
The median household income in Teviston is $48,500, with the highest median household income of $72,614 found in the 45 to 64 years age bracket for the primary householder. A total of 145 households (56.2%) fall into this category.
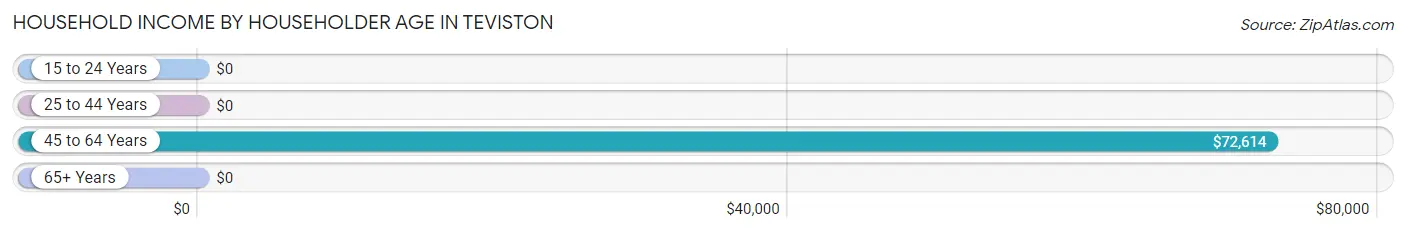
| Income Bracket | # Households | Median Income |
| 15 to 24 Years | 0 (0.0%) | $0 |
| 25 to 44 Years | 70 (27.1%) | $0 |
| 45 to 64 Years | 145 (56.2%) | $72,614 |
| 65+ Years | 43 (16.7%) | $0 |
| Total | 258 (100.0%) | $48,500 |
Poverty in Teviston
Income Below Poverty by Sex and Age in Teviston
With 9.4% poverty level for males and 20.1% for females among the residents of Teviston, 6 to 11 year old males and 35 to 44 year old females are the most vulnerable to poverty, with 30 males (100.0%) and 29 females (100.0%) in their respective age groups living below the poverty level.
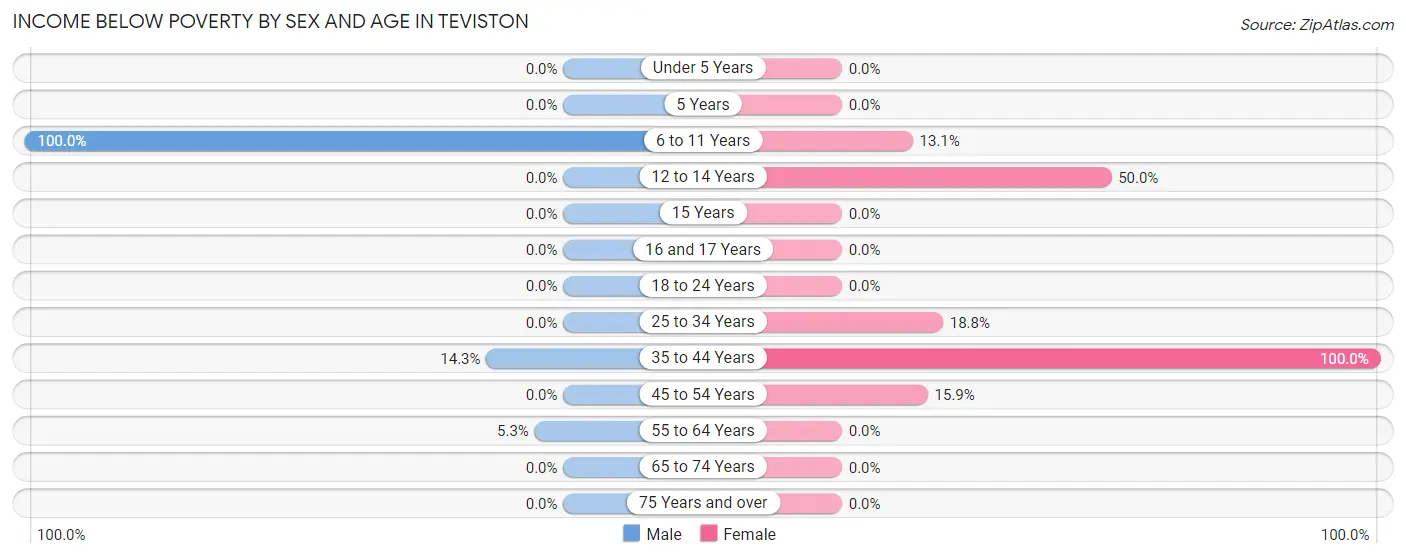
| Age Bracket | Male | Female |
| Under 5 Years | 0 (0.0%) | 0 (0.0%) |
| 5 Years | 0 (0.0%) | 0 (0.0%) |
| 6 to 11 Years | 30 (100.0%) | 13 (13.1%) |
| 12 to 14 Years | 0 (0.0%) | 29 (50.0%) |
| 15 Years | 0 (0.0%) | 0 (0.0%) |
| 16 and 17 Years | 0 (0.0%) | 0 (0.0%) |
| 18 to 24 Years | 0 (0.0%) | 0 (0.0%) |
| 25 to 34 Years | 0 (0.0%) | 15 (18.8%) |
| 35 to 44 Years | 14 (14.3%) | 29 (100.0%) |
| 45 to 54 Years | 0 (0.0%) | 18 (15.9%) |
| 55 to 64 Years | 5 (5.3%) | 0 (0.0%) |
| 65 to 74 Years | 0 (0.0%) | 0 (0.0%) |
| 75 Years and over | 0 (0.0%) | 0 (0.0%) |
| Total | 49 (9.4%) | 104 (20.1%) |
Income Above Poverty by Sex and Age in Teviston
According to the poverty statistics in Teviston, males aged under 5 years and females aged under 5 years are the age groups that are most secure financially, with 100.0% of males and 100.0% of females in these age groups living above the poverty line.
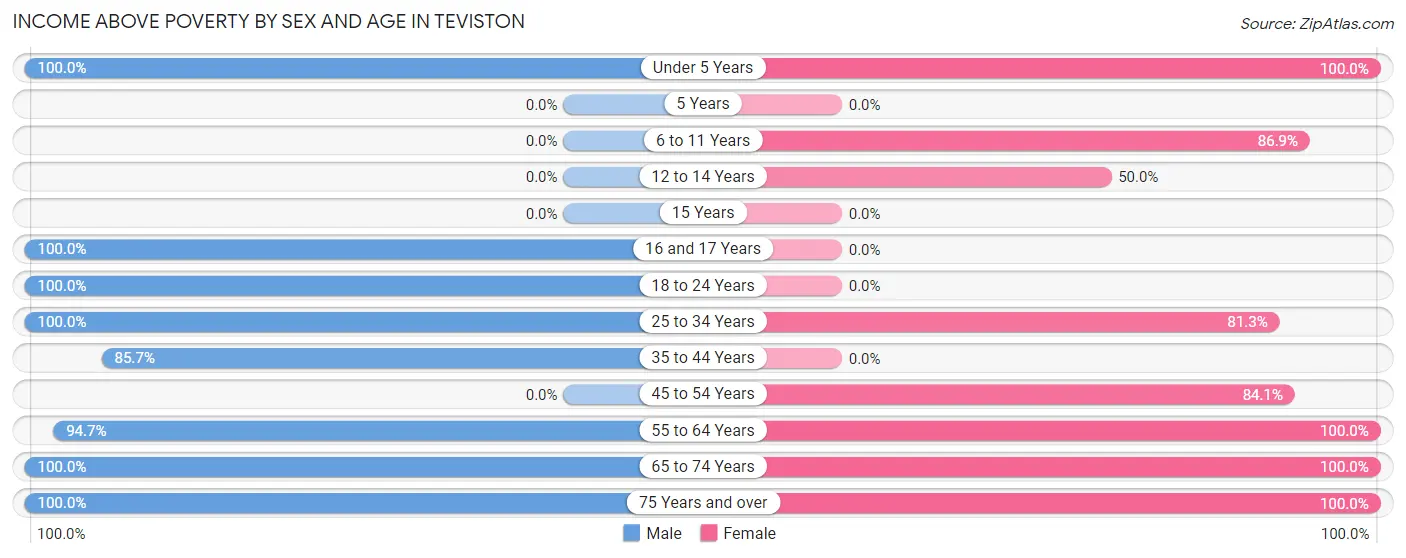
| Age Bracket | Male | Female |
| Under 5 Years | 42 (100.0%) | 21 (100.0%) |
| 5 Years | 0 (0.0%) | 0 (0.0%) |
| 6 to 11 Years | 0 (0.0%) | 86 (86.9%) |
| 12 to 14 Years | 0 (0.0%) | 29 (50.0%) |
| 15 Years | 0 (0.0%) | 0 (0.0%) |
| 16 and 17 Years | 72 (100.0%) | 0 (0.0%) |
| 18 to 24 Years | 118 (100.0%) | 0 (0.0%) |
| 25 to 34 Years | 24 (100.0%) | 65 (81.2%) |
| 35 to 44 Years | 84 (85.7%) | 0 (0.0%) |
| 45 to 54 Years | 0 (0.0%) | 95 (84.1%) |
| 55 to 64 Years | 89 (94.7%) | 33 (100.0%) |
| 65 to 74 Years | 13 (100.0%) | 55 (100.0%) |
| 75 Years and over | 29 (100.0%) | 30 (100.0%) |
| Total | 471 (90.6%) | 414 (79.9%) |
Income Below Poverty Among Married-Couple Families in Teviston
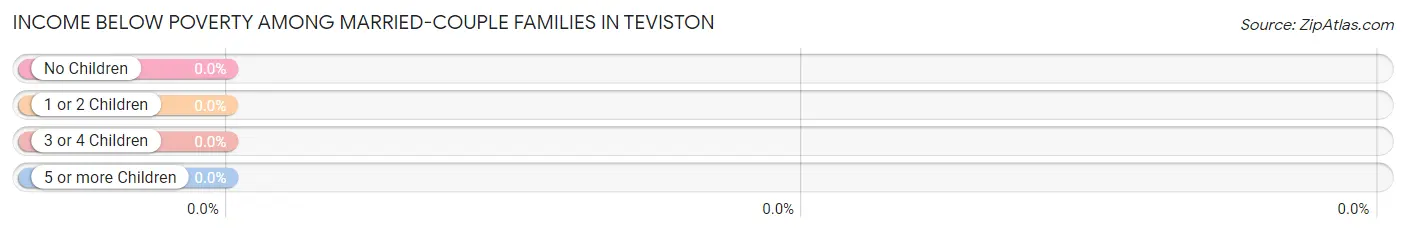
| Children | Above Poverty | Below Poverty |
| No Children | 63 (100.0%) | 0 (0.0%) |
| 1 or 2 Children | 22 (100.0%) | 0 (0.0%) |
| 3 or 4 Children | 41 (100.0%) | 0 (0.0%) |
| 5 or more Children | 0 (0.0%) | 0 (0.0%) |
| Total | 126 (100.0%) | 0 (0.0%) |
Income Below Poverty Among Single-Parent Households in Teviston
According to the poverty data in Teviston, 13.9% or 5 single-father households and 48.2% or 40 single-mother households are living below the poverty line. Among single-father households, those with no children have the highest poverty rate, with 5 households (100.0%) experiencing poverty. Likewise, among single-mother households, those with 1 or 2 children have the highest poverty rate, with 40 households (62.5%) falling below the poverty line.
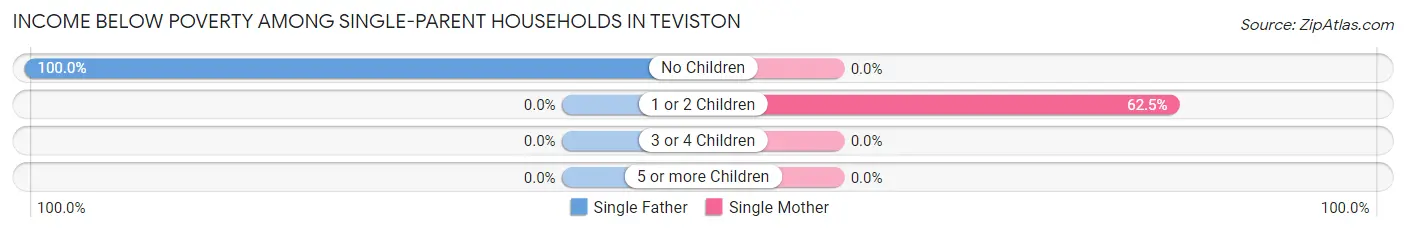
| Children | Single Father | Single Mother |
| No Children | 5 (100.0%) | 0 (0.0%) |
| 1 or 2 Children | 0 (0.0%) | 40 (62.5%) |
| 3 or 4 Children | 0 (0.0%) | 0 (0.0%) |
| 5 or more Children | 0 (0.0%) | 0 (0.0%) |
| Total | 5 (13.9%) | 40 (48.2%) |
Income Below Poverty Among Married-Couple vs Single-Parent Households in Teviston
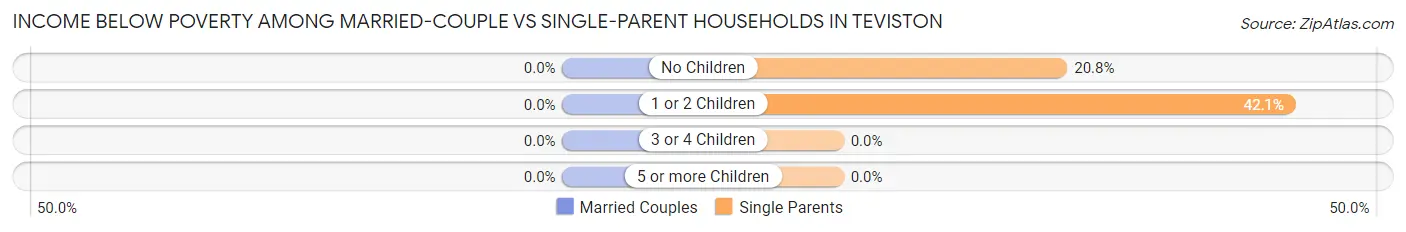
| Children | Married-Couple Families | Single-Parent Households |
| No Children | 0 (0.0%) | 5 (20.8%) |
| 1 or 2 Children | 0 (0.0%) | 40 (42.1%) |
| 3 or 4 Children | 0 (0.0%) | 0 (0.0%) |
| 5 or more Children | 0 (0.0%) | 0 (0.0%) |
| Total | 0 (0.0%) | 45 (37.8%) |
Race in Teviston
The most populous races in Teviston are Hispanic or Latino (860 | 82.9%), Some other Race (732 | 70.5%), and White / Caucasian (147 | 14.2%).
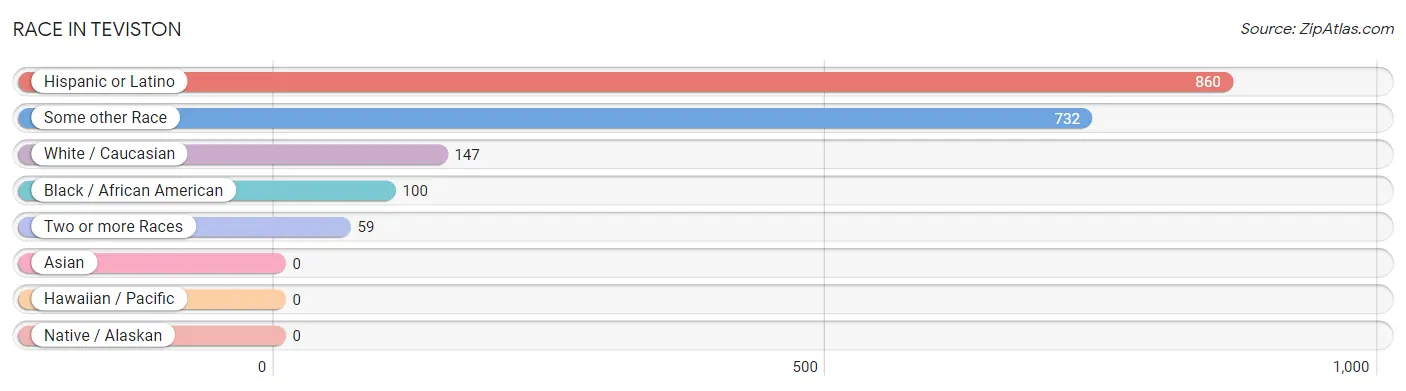
| Race | # Population | % Population |
| Asian | 0 | 0.0% |
| Black / African American | 100 | 9.6% |
| Hawaiian / Pacific | 0 | 0.0% |
| Hispanic or Latino | 860 | 82.9% |
| Native / Alaskan | 0 | 0.0% |
| White / Caucasian | 147 | 14.2% |
| Two or more Races | 59 | 5.7% |
| Some other Race | 732 | 70.5% |
| Total | 1,038 | 100.0% |
Ancestry in Teviston
The most populous ancestries reported in Teviston are Mexican (801 | 77.2%), Spanish (59 | 5.7%), Eastern European (53 | 5.1%), English (24 | 2.3%), and Scottish (5 | 0.5%), together accounting for 90.8% of all Teviston residents.
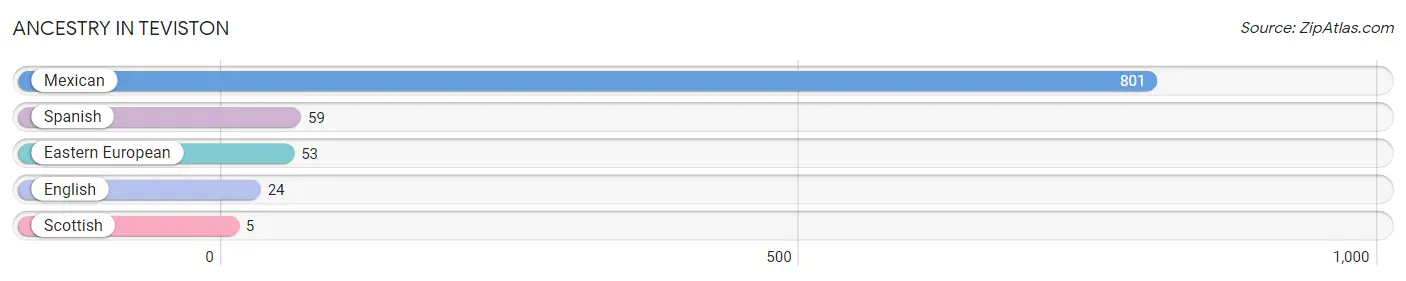
| Ancestry | # Population | % Population |
| Eastern European | 53 | 5.1% |
| English | 24 | 2.3% |
| Mexican | 801 | 77.2% |
| Scottish | 5 | 0.5% |
| Spanish | 59 | 5.7% | View All 5 Rows |
Immigrants in Teviston
The most numerous immigrant groups reported in Teviston came from Central America (352 | 33.9%), Latin America (352 | 33.9%), and Mexico (352 | 33.9%), together accounting for 101.7% of all Teviston residents.
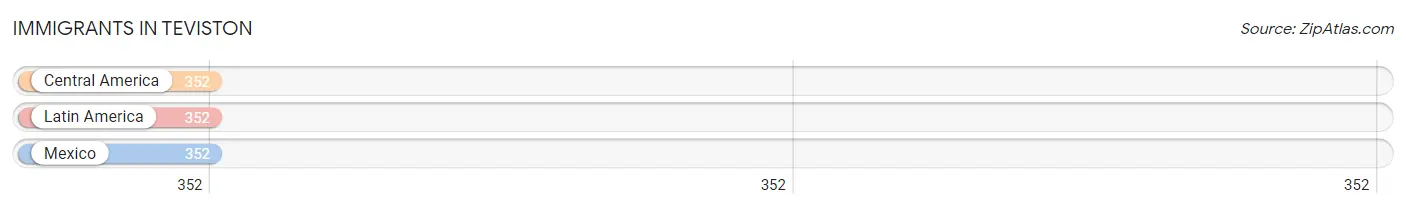
| Immigration Origin | # Population | % Population |
| Central America | 352 | 33.9% |
| Latin America | 352 | 33.9% |
| Mexico | 352 | 33.9% | View All 3 Rows |
Sex and Age in Teviston
Sex and Age in Teviston
The most populous age groups in Teviston are 15 to 19 Years (164 | 31.5%) for men and 10 to 14 Years (101 | 19.5%) for women.
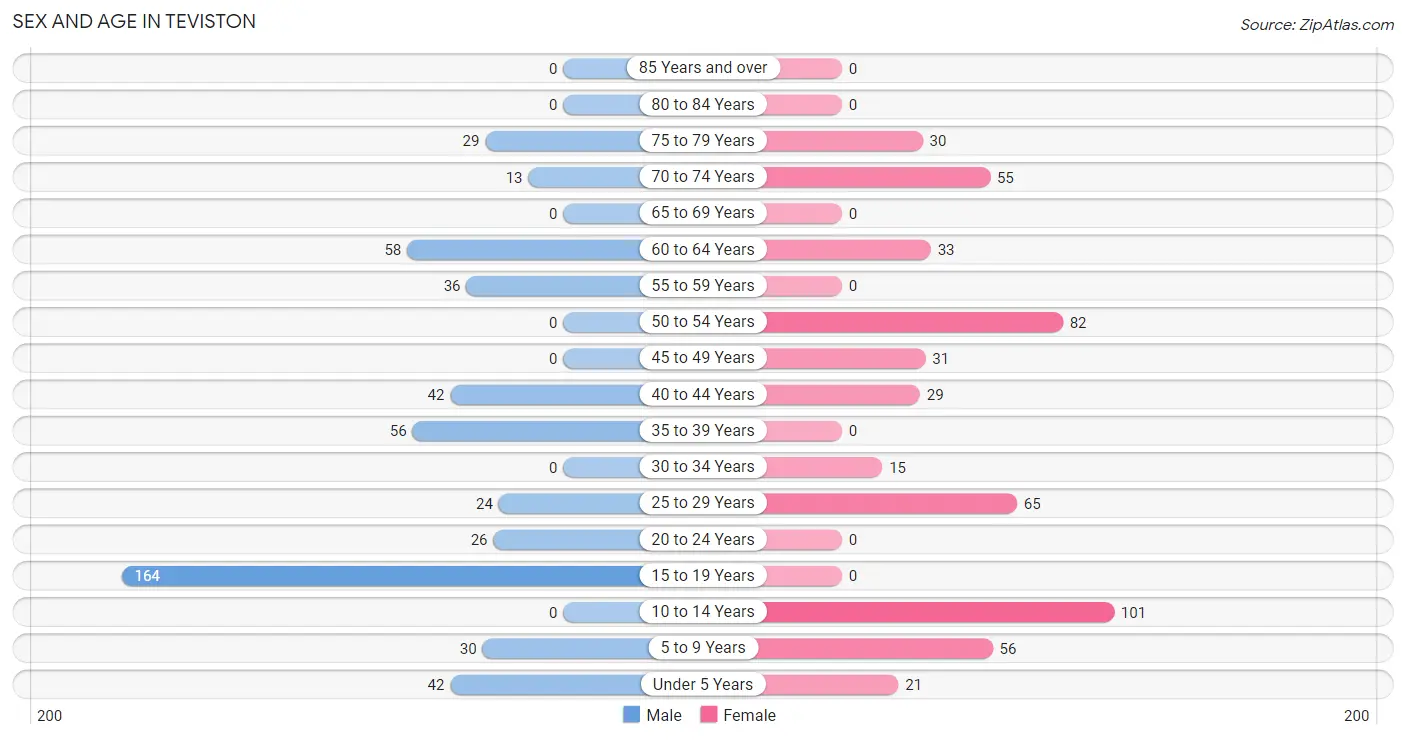
| Age Bracket | Male | Female |
| Under 5 Years | 42 (8.1%) | 21 (4.1%) |
| 5 to 9 Years | 30 (5.8%) | 56 (10.8%) |
| 10 to 14 Years | 0 (0.0%) | 101 (19.5%) |
| 15 to 19 Years | 164 (31.5%) | 0 (0.0%) |
| 20 to 24 Years | 26 (5.0%) | 0 (0.0%) |
| 25 to 29 Years | 24 (4.6%) | 65 (12.6%) |
| 30 to 34 Years | 0 (0.0%) | 15 (2.9%) |
| 35 to 39 Years | 56 (10.8%) | 0 (0.0%) |
| 40 to 44 Years | 42 (8.1%) | 29 (5.6%) |
| 45 to 49 Years | 0 (0.0%) | 31 (6.0%) |
| 50 to 54 Years | 0 (0.0%) | 82 (15.8%) |
| 55 to 59 Years | 36 (6.9%) | 0 (0.0%) |
| 60 to 64 Years | 58 (11.2%) | 33 (6.4%) |
| 65 to 69 Years | 0 (0.0%) | 0 (0.0%) |
| 70 to 74 Years | 13 (2.5%) | 55 (10.6%) |
| 75 to 79 Years | 29 (5.6%) | 30 (5.8%) |
| 80 to 84 Years | 0 (0.0%) | 0 (0.0%) |
| 85 Years and over | 0 (0.0%) | 0 (0.0%) |
| Total | 520 (100.0%) | 518 (100.0%) |
Families and Households in Teviston
Median Family Size in Teviston
The median family size in Teviston is 4.18 persons per family, with single female/mother families (83 | 33.9%) accounting for the largest median family size of 5.3 persons per family. On the other hand, single male/father families (36 | 14.7%) represent the smallest median family size with 2.97 persons per family.
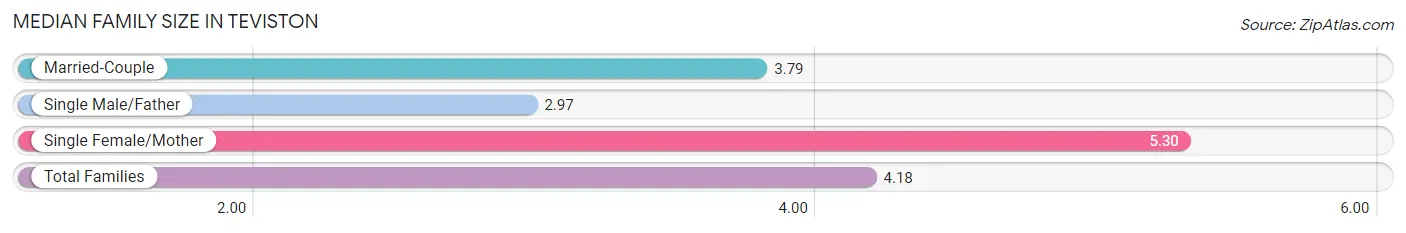
| Family Type | # Families | Family Size |
| Married-Couple | 126 (51.4%) | 3.79 |
| Single Male/Father | 36 (14.7%) | 2.97 |
| Single Female/Mother | 83 (33.9%) | 5.30 |
| Total Families | 245 (100.0%) | 4.18 |
Median Household Size in Teviston
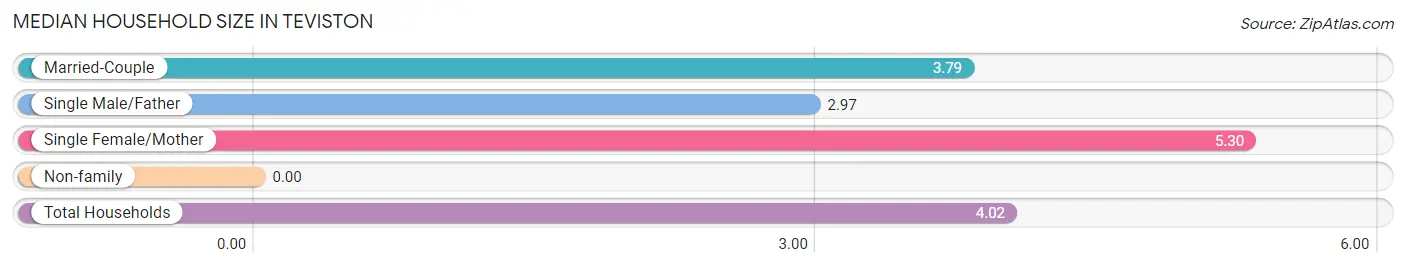
| Household Type | # Households | Household Size |
| Married-Couple | 126 (48.8%) | 3.79 |
| Single Male/Father | 36 (14.0%) | 2.97 |
| Single Female/Mother | 83 (32.2%) | 5.30 |
| Non-family | 13 (5.0%) | - |
| Total Households | 258 (100.0%) | 4.02 |
Household Size by Marriage Status in Teviston
Out of a total of 258 households in Teviston, 245 (95.0%) are family households, while 13 (5.0%) are nonfamily households. The most numerous type of family households are 3-person households, comprising 79, and the most common type of nonfamily households are 1-person households, comprising 13.
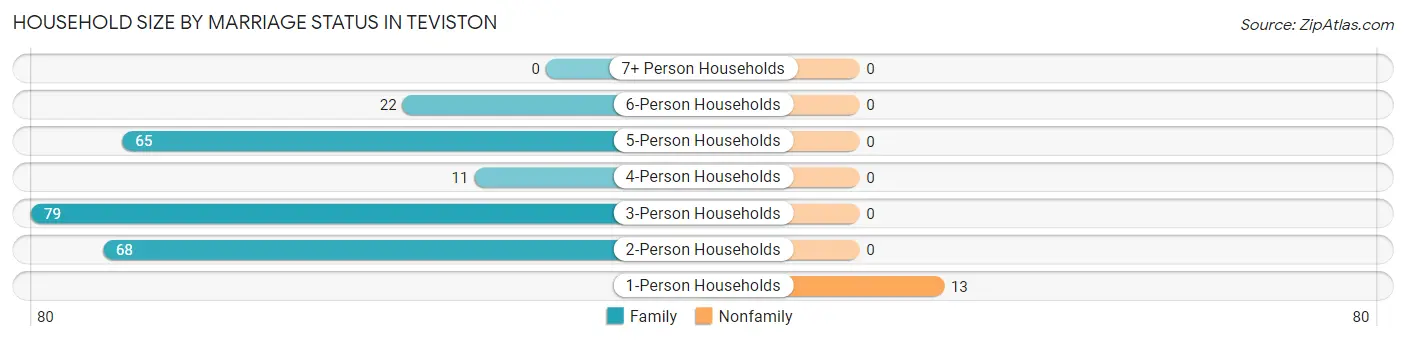
| Household Size | Family Households | Nonfamily Households |
| 1-Person Households | - | 13 (5.0%) |
| 2-Person Households | 68 (26.4%) | 0 (0.0%) |
| 3-Person Households | 79 (30.6%) | 0 (0.0%) |
| 4-Person Households | 11 (4.3%) | 0 (0.0%) |
| 5-Person Households | 65 (25.2%) | 0 (0.0%) |
| 6-Person Households | 22 (8.5%) | 0 (0.0%) |
| 7+ Person Households | 0 (0.0%) | 0 (0.0%) |
| Total | 245 (95.0%) | 13 (5.0%) |
Female Fertility in Teviston
Fertility by Age in Teviston
| Age Bracket | Women with Births | Births / 1,000 Women |
| 15 to 19 years | 0 (0.0%) | 0.0 |
| 20 to 34 years | 0 (0.0%) | 0.0 |
| 35 to 50 years | 0 (0.0%) | 0.0 |
| Total | 0 (0.0%) | 0.0 |
Fertility by Age by Marriage Status in Teviston
| Age Bracket | Married | Unmarried |
| 15 to 19 years | 0 (0.0%) | 0 (0.0%) |
| 20 to 34 years | 0 (0.0%) | 0 (0.0%) |
| 35 to 50 years | 0 (0.0%) | 0 (0.0%) |
| Total | 0 (0.0%) | 0 (0.0%) |
Fertility by Education in Teviston
| Educational Attainment | Women with Births | Births / 1,000 Women |
| Less than High School | 0 (0.0%) | 0.0 |
| High School Diploma | 0 (0.0%) | 0.0 |
| College or Associate's Degree | 0 (0.0%) | 0.0 |
| Bachelor's Degree | 0 (0.0%) | 0.0 |
| Graduate Degree | 0 (0.0%) | 0.0 |
| Total | 0 (0.0%) | 0.0 |
Fertility by Education by Marriage Status in Teviston
| Educational Attainment | Married | Unmarried |
| Less than High School | 0 (0.0%) | 0 (0.0%) |
| High School Diploma | 0 (0.0%) | 0 (0.0%) |
| College or Associate's Degree | 0 (0.0%) | 0 (0.0%) |
| Bachelor's Degree | 0 (0.0%) | 0 (0.0%) |
| Graduate Degree | 0 (0.0%) | 0 (0.0%) |
| Total | 0 (0.0%) | 0 (0.0%) |
Employment Characteristics in Teviston
Employment by Class of Employer in Teviston
Among the 164 employed individuals in Teviston, private company employees (90 | 54.9%), self-employed (not incorporated) (31 | 18.9%), and self-employed (incorporated) (24 | 14.6%) make up the most common classes of employment.
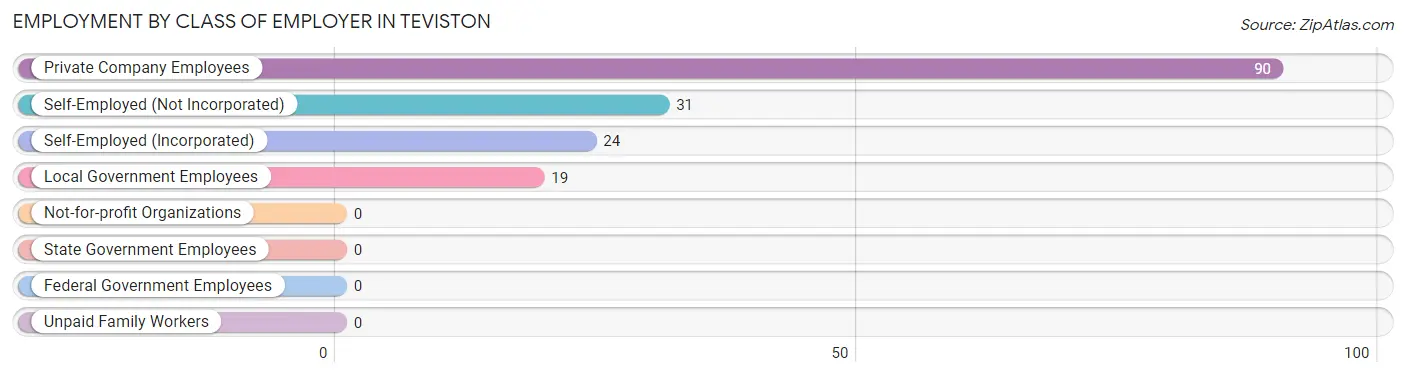
| Employer Class | # Employees | % Employees |
| Private Company Employees | 90 | 54.9% |
| Self-Employed (Incorporated) | 24 | 14.6% |
| Self-Employed (Not Incorporated) | 31 | 18.9% |
| Not-for-profit Organizations | 0 | 0.0% |
| Local Government Employees | 19 | 11.6% |
| State Government Employees | 0 | 0.0% |
| Federal Government Employees | 0 | 0.0% |
| Unpaid Family Workers | 0 | 0.0% |
| Total | 164 | 100.0% |
Employment Status by Age in Teviston
According to the labor force statistics for Teviston, out of the total population over 16 years of age (788), 40.5% or 319 individuals are in the labor force, with 32.9% or 105 of them unemployed. The age group with the highest labor force participation rate is 25 to 29 years, with 100.0% or 89 individuals in the labor force. Within the labor force, the 30 to 34 years age range has the highest percentage of unemployed individuals, with 100.0% or 15 of them being unemployed.
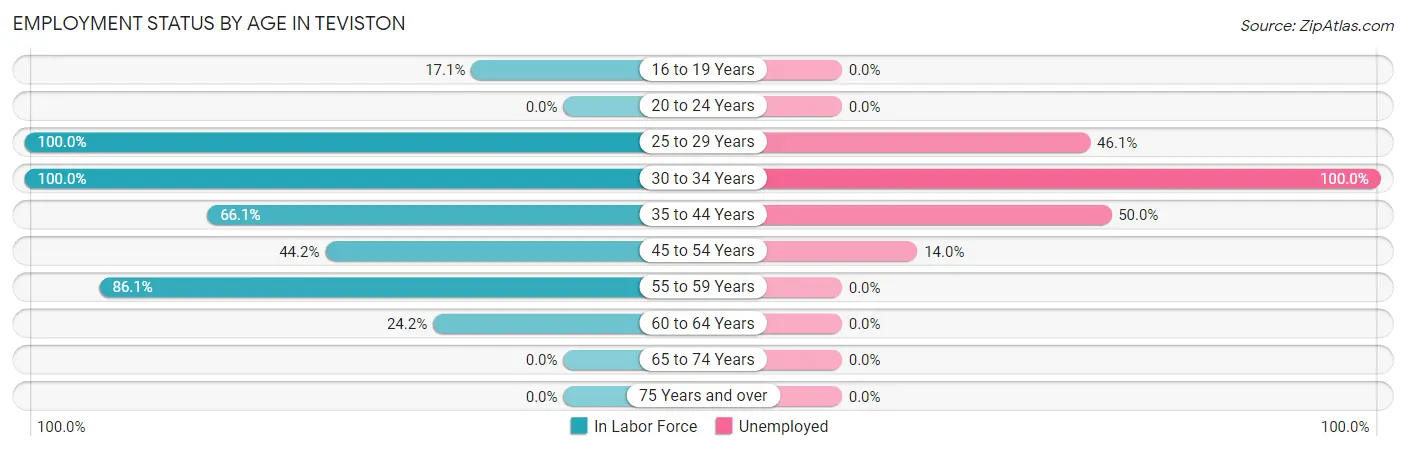
| Age Bracket | In Labor Force | Unemployed |
| 16 to 19 Years | 28 (17.1%) | 0 (0.0%) |
| 20 to 24 Years | 0 (0.0%) | 0 (0.0%) |
| 25 to 29 Years | 89 (100.0%) | 41 (46.1%) |
| 30 to 34 Years | 15 (100.0%) | 15 (100.0%) |
| 35 to 44 Years | 84 (66.1%) | 42 (50.0%) |
| 45 to 54 Years | 50 (44.2%) | 7 (14.0%) |
| 55 to 59 Years | 31 (86.1%) | 0 (0.0%) |
| 60 to 64 Years | 22 (24.2%) | 0 (0.0%) |
| 65 to 74 Years | 0 (0.0%) | 0 (0.0%) |
| 75 Years and over | 0 (0.0%) | 0 (0.0%) |
| Total | 319 (40.5%) | 105 (32.9%) |
Employment Status by Educational Attainment in Teviston
According to labor force statistics for Teviston, 61.8% of individuals (291) out of the total population between 25 and 64 years of age (471) are in the labor force, with 36.1% or 105 of them being unemployed. The group with the highest labor force participation rate are those with the educational attainment of college / associate degree, with 100.0% or 24 individuals in the labor force. Within the labor force, individuals with high school diploma education have the highest percentage of unemployment, with 56.6% or 56 of them being unemployed.
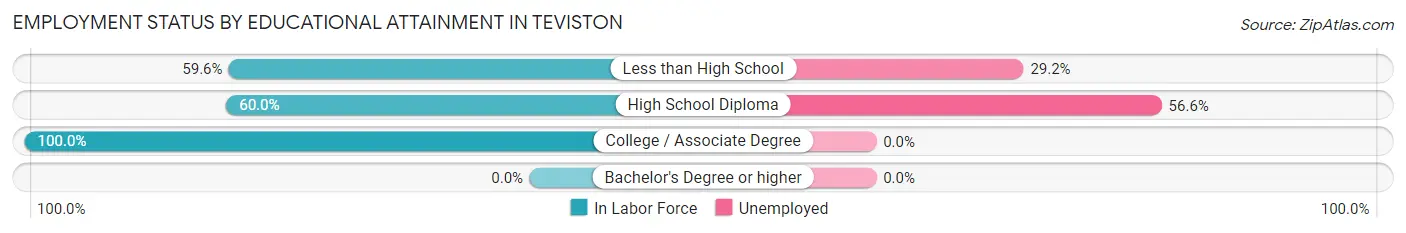
| Educational Attainment | In Labor Force | Unemployed |
| Less than High School | 168 (59.6%) | 82 (29.2%) |
| High School Diploma | 99 (60.0%) | 93 (56.6%) |
| College / Associate Degree | 24 (100.0%) | 0 (0.0%) |
| Bachelor's Degree or higher | 0 (0.0%) | 0 (0.0%) |
| Total | 291 (61.8%) | 170 (36.1%) |
Employment Occupations by Sex in Teviston
Management, Business, Science and Arts Occupations
Management, Business, Science and Arts Occupations by Sex
| Occupation | Male | Female |
| Management | 0 (0.0%) | 0 (0.0%) |
| Business & Financial | 0 (0.0%) | 0 (0.0%) |
| Computers, Engineering & Science | 0 (0.0%) | 0 (0.0%) |
| Computers & Mathematics | 0 (0.0%) | 0 (0.0%) |
| Architecture & Engineering | 0 (0.0%) | 0 (0.0%) |
| Life, Physical & Social Science | 0 (0.0%) | 0 (0.0%) |
| Community & Social Service | 0 (0.0%) | 0 (0.0%) |
| Education, Arts & Media | 0 (0.0%) | 0 (0.0%) |
| Legal Services & Support | 0 (0.0%) | 0 (0.0%) |
| Education Instruction & Library | 0 (0.0%) | 0 (0.0%) |
| Arts, Media & Entertainment | 0 (0.0%) | 0 (0.0%) |
| Health Diagnosing & Treating | 0 (0.0%) | 0 (0.0%) |
| Health Technologists | 0 (0.0%) | 0 (0.0%) |
| Total (Category) | 0 (0.0%) | 0 (0.0%) |
| Total (Overall) | 147 (68.7%) | 67 (31.3%) |
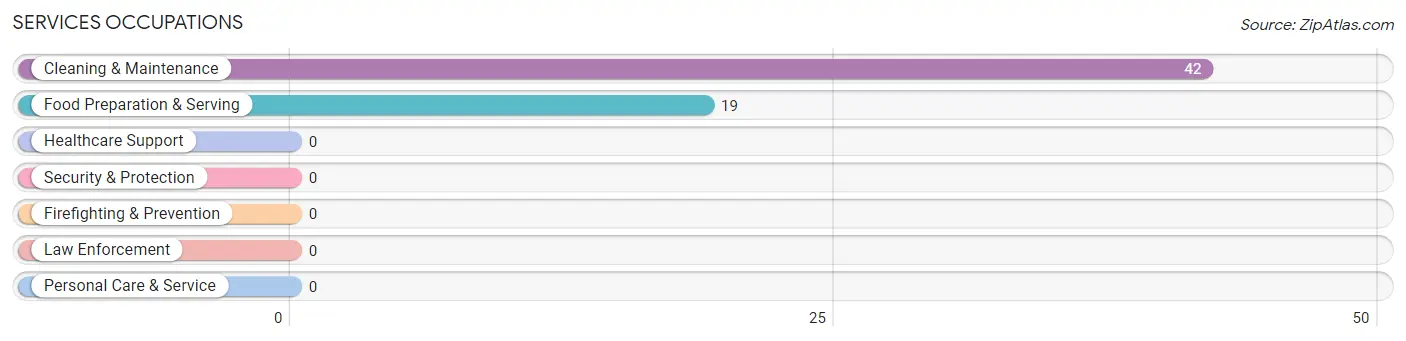
Services Occupations
The most common Services occupations in Teviston are Cleaning & Maintenance (42 | 19.6%), and Food Preparation & Serving (19 | 8.9%).
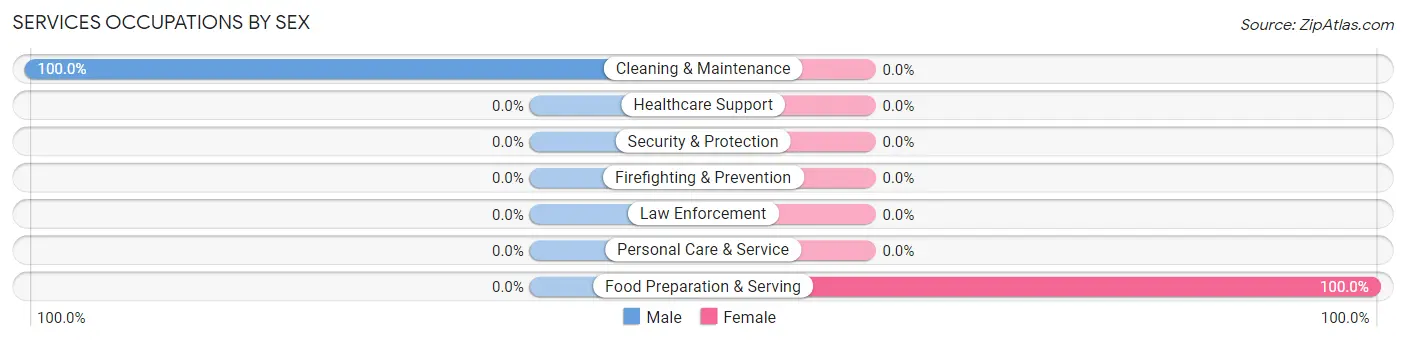
Services Occupations by Sex
| Occupation | Male | Female |
| Healthcare Support | 0 (0.0%) | 0 (0.0%) |
| Security & Protection | 0 (0.0%) | 0 (0.0%) |
| Firefighting & Prevention | 0 (0.0%) | 0 (0.0%) |
| Law Enforcement | 0 (0.0%) | 0 (0.0%) |
| Food Preparation & Serving | 0 (0.0%) | 19 (100.0%) |
| Cleaning & Maintenance | 42 (100.0%) | 0 (0.0%) |
| Personal Care & Service | 0 (0.0%) | 0 (0.0%) |
| Total (Category) | 42 (68.9%) | 19 (31.1%) |
| Total (Overall) | 147 (68.7%) | 67 (31.3%) |
Sales and Office Occupations
The most common Sales and Office occupations in Teviston are , and Office & Administration (24 | 11.2%).
Sales and Office Occupations by Sex

| Occupation | Male | Female |
| Sales & Related | 0 (0.0%) | 0 (0.0%) |
| Office & Administration | 0 (0.0%) | 24 (100.0%) |
| Total (Category) | 0 (0.0%) | 24 (100.0%) |
| Total (Overall) | 147 (68.7%) | 67 (31.3%) |
Natural Resources, Construction and Maintenance Occupations
The most common Natural Resources, Construction and Maintenance occupations in Teviston are , and Farming, Fishing & Forestry (48 | 22.4%).
Natural Resources, Construction and Maintenance Occupations by Sex
| Occupation | Male | Female |
| Farming, Fishing & Forestry | 24 (50.0%) | 24 (50.0%) |
| Construction & Extraction | 0 (0.0%) | 0 (0.0%) |
| Installation, Maintenance & Repair | 0 (0.0%) | 0 (0.0%) |
| Total (Category) | 24 (50.0%) | 24 (50.0%) |
| Total (Overall) | 147 (68.7%) | 67 (31.3%) |
Production, Transportation and Moving Occupations
The most common Production, Transportation and Moving occupations in Teviston are Material Moving (50 | 23.4%), and Production (31 | 14.5%).
Production, Transportation and Moving Occupations by Sex
| Occupation | Male | Female |
| Production | 31 (100.0%) | 0 (0.0%) |
| Transportation | 0 (0.0%) | 0 (0.0%) |
| Material Moving | 50 (100.0%) | 0 (0.0%) |
| Total (Category) | 81 (100.0%) | 0 (0.0%) |
| Total (Overall) | 147 (68.7%) | 67 (31.3%) |
Employment Industries by Sex in Teviston
Employment Industries in Teviston
The major employment industries in Teviston include Agriculture, Fishing & Hunting (79 | 36.9%), Transportation & Warehousing (74 | 34.6%), Administrative & Support (42 | 19.6%), and Educational Services (19 | 8.9%).
Employment Industries by Sex in Teviston
The Teviston industries that see more men than women are Administrative & Support (100.0%), Agriculture, Fishing & Hunting (69.6%), and Transportation & Warehousing (67.6%), whereas the industries that tend to have a higher number of women are Educational Services (100.0%), Transportation & Warehousing (32.4%), and Agriculture, Fishing & Hunting (30.4%).
| Industry | Male | Female |
| Agriculture, Fishing & Hunting | 55 (69.6%) | 24 (30.4%) |
| Mining, Quarrying, & Extraction | 0 (0.0%) | 0 (0.0%) |
| Construction | 0 (0.0%) | 0 (0.0%) |
| Manufacturing | 0 (0.0%) | 0 (0.0%) |
| Wholesale Trade | 0 (0.0%) | 0 (0.0%) |
| Retail Trade | 0 (0.0%) | 0 (0.0%) |
| Transportation & Warehousing | 50 (67.6%) | 24 (32.4%) |
| Utilities | 0 (0.0%) | 0 (0.0%) |
| Information | 0 (0.0%) | 0 (0.0%) |
| Finance & Insurance | 0 (0.0%) | 0 (0.0%) |
| Real Estate, Rental & Leasing | 0 (0.0%) | 0 (0.0%) |
| Professional & Scientific | 0 (0.0%) | 0 (0.0%) |
| Enterprise Management | 0 (0.0%) | 0 (0.0%) |
| Administrative & Support | 42 (100.0%) | 0 (0.0%) |
| Educational Services | 0 (0.0%) | 19 (100.0%) |
| Health Care & Social Assistance | 0 (0.0%) | 0 (0.0%) |
| Arts, Entertainment & Recreation | 0 (0.0%) | 0 (0.0%) |
| Accommodation & Food Services | 0 (0.0%) | 0 (0.0%) |
| Public Administration | 0 (0.0%) | 0 (0.0%) |
| Total | 147 (68.7%) | 67 (31.3%) |
Education in Teviston
School Enrollment in Teviston
The most common levels of schooling among the 280 students in Teviston are high school (136 | 48.6%), elementary school (86 | 30.7%), and middle school (58 | 20.7%).
| School Level | # Students | % Students |
| Nursery / Preschool | 0 | 0.0% |
| Kindergarten | 0 | 0.0% |
| Elementary School | 86 | 30.7% |
| Middle School | 58 | 20.7% |
| High School | 136 | 48.6% |
| College / Undergraduate | 0 | 0.0% |
| Graduate / Professional | 0 | 0.0% |
| Total | 280 | 100.0% |
School Enrollment by Age by Funding Source in Teviston
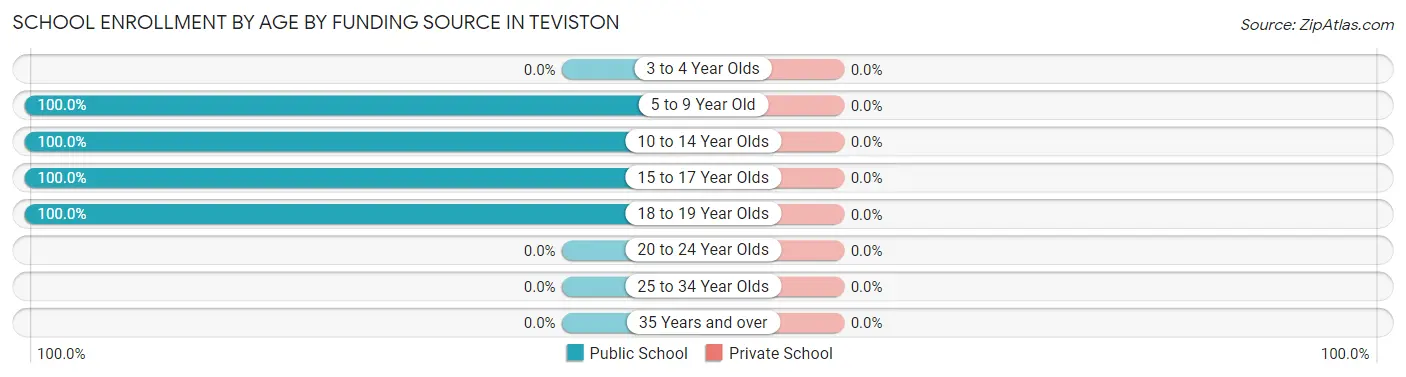
| Age Bracket | Public School | Private School |
| 3 to 4 Year Olds | 0 (0.0%) | 0 (0.0%) |
| 5 to 9 Year Old | 86 (100.0%) | 0 (0.0%) |
| 10 to 14 Year Olds | 58 (100.0%) | 0 (0.0%) |
| 15 to 17 Year Olds | 72 (100.0%) | 0 (0.0%) |
| 18 to 19 Year Olds | 64 (100.0%) | 0 (0.0%) |
| 20 to 24 Year Olds | 0 (0.0%) | 0 (0.0%) |
| 25 to 34 Year Olds | 0 (0.0%) | 0 (0.0%) |
| 35 Years and over | 0 (0.0%) | 0 (0.0%) |
| Total | 280 (100.0%) | 0 (0.0%) |
Educational Attainment by Field of Study in Teviston
| Field of Study | # Graduates | % Graduates |
| Computers & Mathematics | 0 | 0.0% |
| Bio, Nature & Agricultural | 0 | 0.0% |
| Physical & Health Sciences | 0 | 0.0% |
| Psychology | 0 | 0.0% |
| Social Sciences | 0 | 0.0% |
| Engineering | 0 | 0.0% |
| Multidisciplinary Studies | 0 | 0.0% |
| Science & Technology | 0 | 0.0% |
| Business | 0 | 0.0% |
| Education | 0 | 0.0% |
| Literature & Languages | 0 | 0.0% |
| Liberal Arts & History | 0 | 0.0% |
| Visual & Performing Arts | 0 | 0.0% |
| Communications | 0 | 0.0% |
| Arts & Humanities | 0 | 0.0% |
| Total | 0 | 0.0% |
Transportation & Commute in Teviston
Vehicle Availability by Sex in Teviston
The most prevalent vehicle ownership categories in Teviston are males with 3 vehicles (97, accounting for 100.0%) and females with 3 vehicles (67, making up 144.8%).
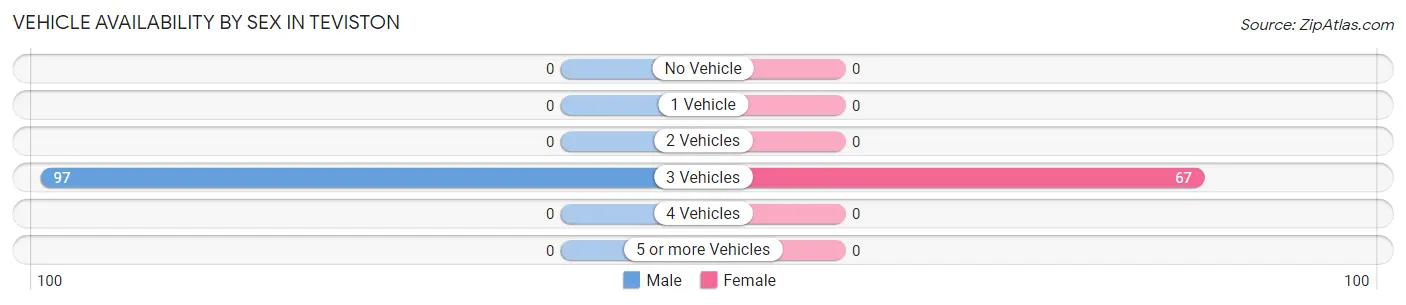
| Vehicles Available | Male | Female |
| No Vehicle | 0 (0.0%) | 0 (0.0%) |
| 1 Vehicle | 0 (0.0%) | 0 (0.0%) |
| 2 Vehicles | 0 (0.0%) | 0 (0.0%) |
| 3 Vehicles | 97 (100.0%) | 67 (100.0%) |
| 4 Vehicles | 0 (0.0%) | 0 (0.0%) |
| 5 or more Vehicles | 0 (0.0%) | 0 (0.0%) |
| Total | 97 (100.0%) | 67 (100.0%) |
Commute Time in Teviston
The most frequently occuring commute durations in Teviston are 10 to 14 minutes (50 commuters, 30.5%), 30 to 34 minutes (42 commuters, 25.6%), and 5 to 9 minutes (24 commuters, 14.6%).
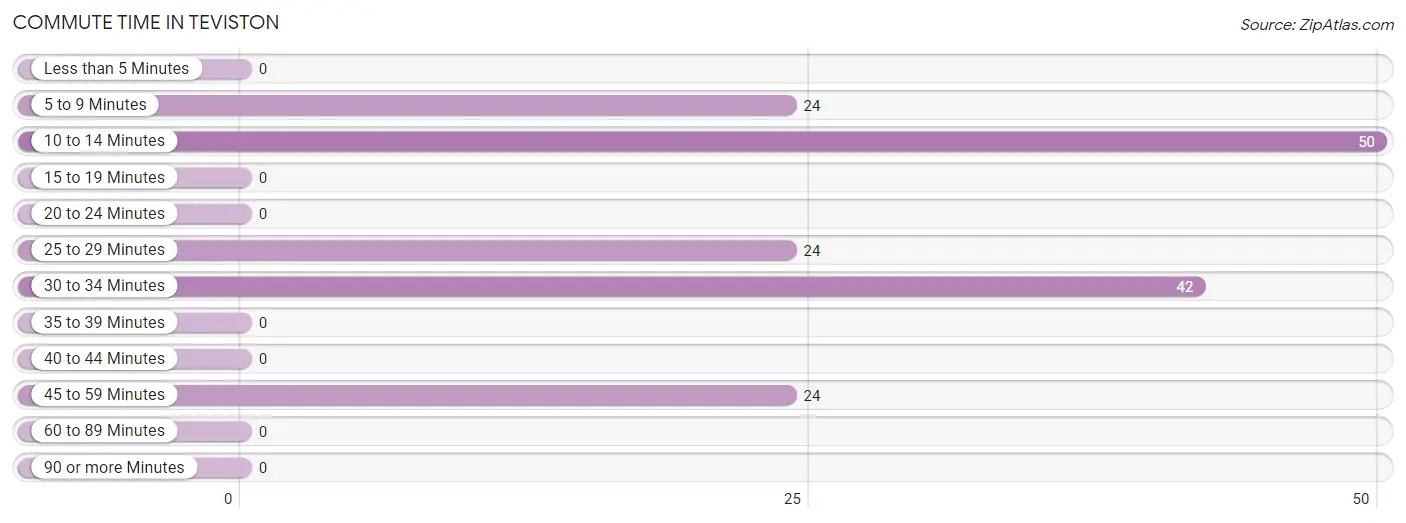
| Commute Time | # Commuters | % Commuters |
| Less than 5 Minutes | 0 | 0.0% |
| 5 to 9 Minutes | 24 | 14.6% |
| 10 to 14 Minutes | 50 | 30.5% |
| 15 to 19 Minutes | 0 | 0.0% |
| 20 to 24 Minutes | 0 | 0.0% |
| 25 to 29 Minutes | 24 | 14.6% |
| 30 to 34 Minutes | 42 | 25.6% |
| 35 to 39 Minutes | 0 | 0.0% |
| 40 to 44 Minutes | 0 | 0.0% |
| 45 to 59 Minutes | 24 | 14.6% |
| 60 to 89 Minutes | 0 | 0.0% |
| 90 or more Minutes | 0 | 0.0% |
Commute Time by Sex in Teviston
The most common commute times in Teviston are 30 to 34 minutes (42 commuters, 43.3%) for males and 25 to 29 minutes (24 commuters, 35.8%) for females.
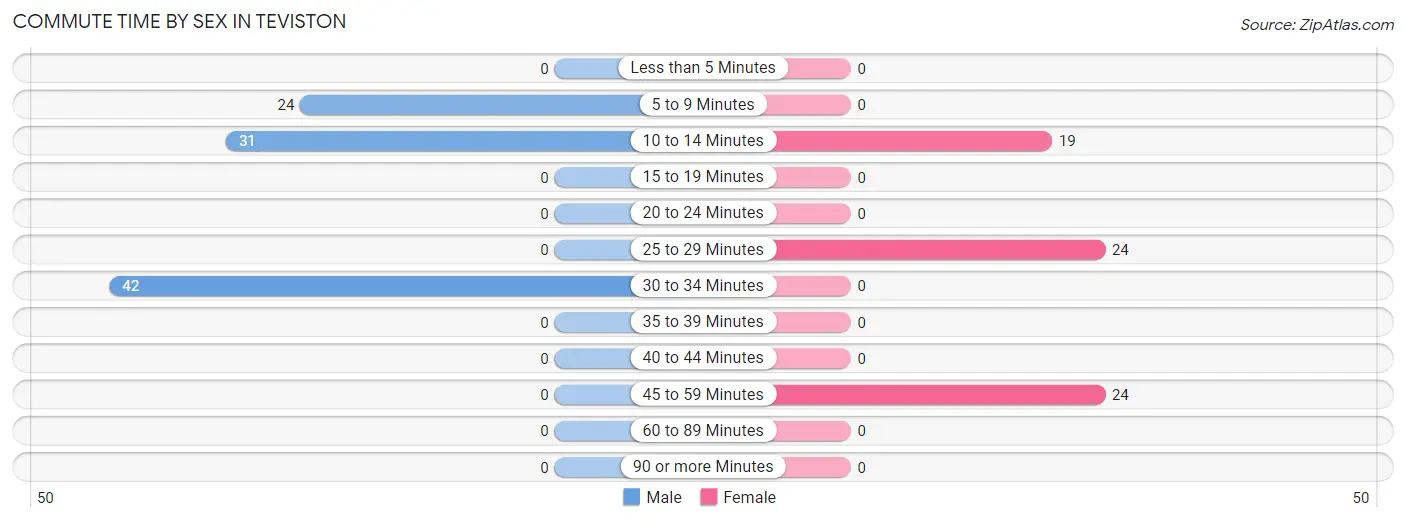
| Commute Time | Male | Female |
| Less than 5 Minutes | 0 (0.0%) | 0 (0.0%) |
| 5 to 9 Minutes | 24 (24.7%) | 0 (0.0%) |
| 10 to 14 Minutes | 31 (32.0%) | 19 (28.4%) |
| 15 to 19 Minutes | 0 (0.0%) | 0 (0.0%) |
| 20 to 24 Minutes | 0 (0.0%) | 0 (0.0%) |
| 25 to 29 Minutes | 0 (0.0%) | 24 (35.8%) |
| 30 to 34 Minutes | 42 (43.3%) | 0 (0.0%) |
| 35 to 39 Minutes | 0 (0.0%) | 0 (0.0%) |
| 40 to 44 Minutes | 0 (0.0%) | 0 (0.0%) |
| 45 to 59 Minutes | 0 (0.0%) | 24 (35.8%) |
| 60 to 89 Minutes | 0 (0.0%) | 0 (0.0%) |
| 90 or more Minutes | 0 (0.0%) | 0 (0.0%) |
Time of Departure to Work by Sex in Teviston
The most frequent times of departure to work in Teviston are 5:30 AM to 5:59 AM (42, 43.3%) for males and 5:30 AM to 5:59 AM (24, 35.8%) for females.
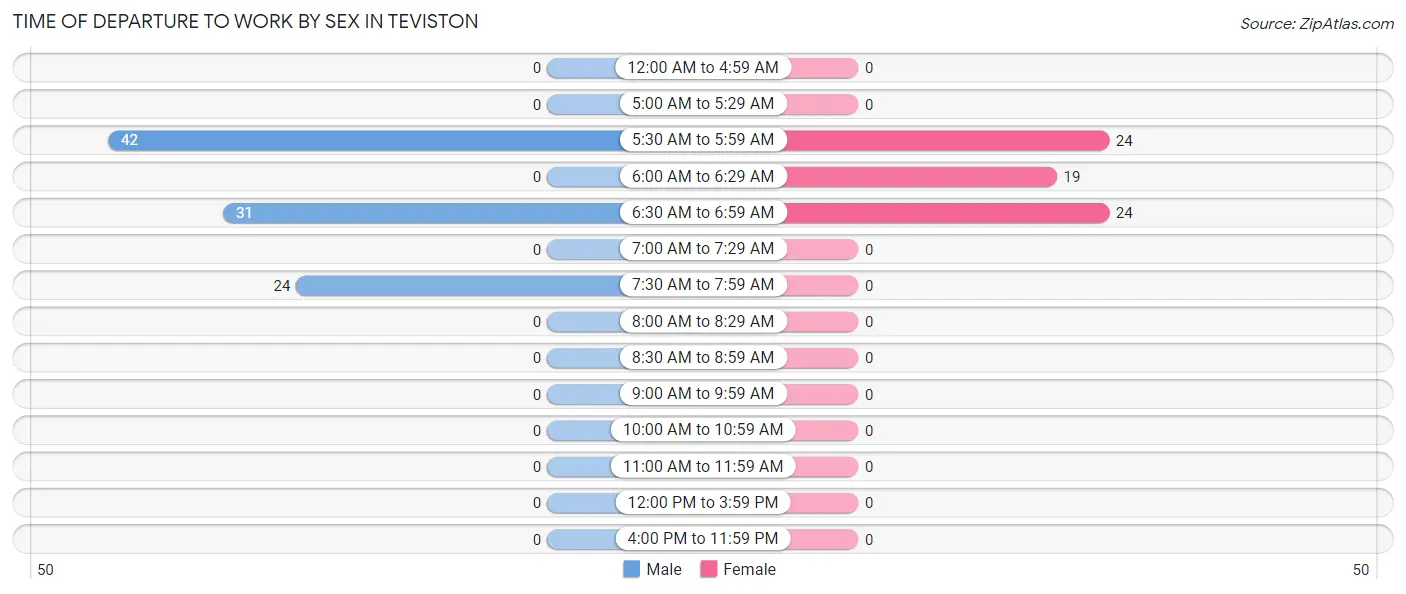
| Time of Departure | Male | Female |
| 12:00 AM to 4:59 AM | 0 (0.0%) | 0 (0.0%) |
| 5:00 AM to 5:29 AM | 0 (0.0%) | 0 (0.0%) |
| 5:30 AM to 5:59 AM | 42 (43.3%) | 24 (35.8%) |
| 6:00 AM to 6:29 AM | 0 (0.0%) | 19 (28.4%) |
| 6:30 AM to 6:59 AM | 31 (32.0%) | 24 (35.8%) |
| 7:00 AM to 7:29 AM | 0 (0.0%) | 0 (0.0%) |
| 7:30 AM to 7:59 AM | 24 (24.7%) | 0 (0.0%) |
| 8:00 AM to 8:29 AM | 0 (0.0%) | 0 (0.0%) |
| 8:30 AM to 8:59 AM | 0 (0.0%) | 0 (0.0%) |
| 9:00 AM to 9:59 AM | 0 (0.0%) | 0 (0.0%) |
| 10:00 AM to 10:59 AM | 0 (0.0%) | 0 (0.0%) |
| 11:00 AM to 11:59 AM | 0 (0.0%) | 0 (0.0%) |
| 12:00 PM to 3:59 PM | 0 (0.0%) | 0 (0.0%) |
| 4:00 PM to 11:59 PM | 0 (0.0%) | 0 (0.0%) |
| Total | 97 (100.0%) | 67 (100.0%) |
Housing Occupancy in Teviston
Occupancy by Ownership in Teviston
Of the total 258 dwellings in Teviston, owner-occupied units account for 92 (35.7%), while renter-occupied units make up 166 (64.3%).
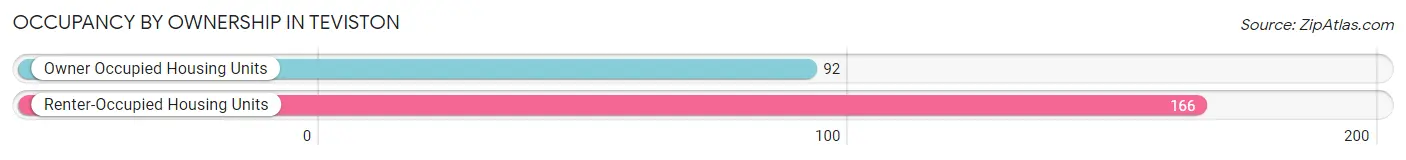
| Occupancy | # Housing Units | % Housing Units |
| Owner Occupied Housing Units | 92 | 35.7% |
| Renter-Occupied Housing Units | 166 | 64.3% |
| Total Occupied Housing Units | 258 | 100.0% |
Occupancy by Household Size in Teviston
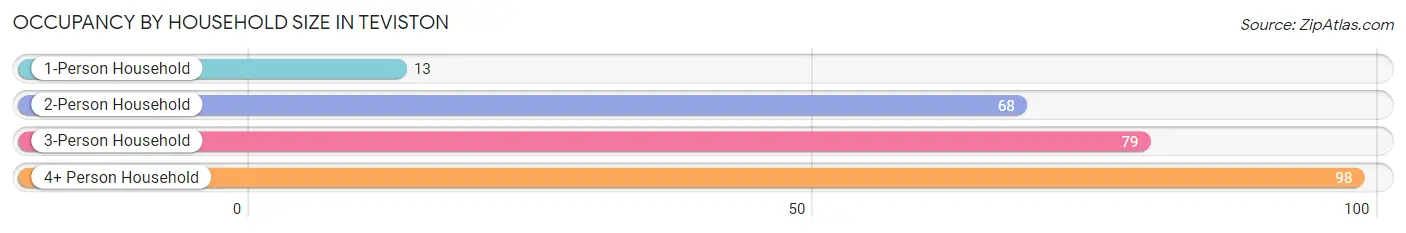
| Household Size | # Housing Units | % Housing Units |
| 1-Person Household | 13 | 5.0% |
| 2-Person Household | 68 | 26.4% |
| 3-Person Household | 79 | 30.6% |
| 4+ Person Household | 98 | 38.0% |
| Total Housing Units | 258 | 100.0% |
Occupancy by Ownership by Household Size in Teviston
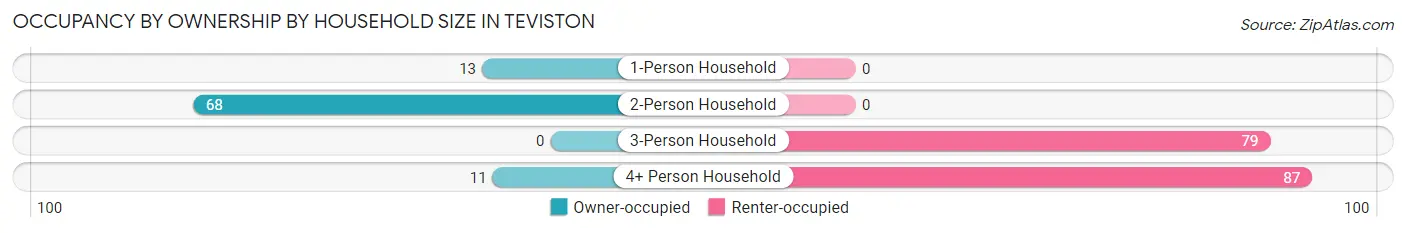
| Household Size | Owner-occupied | Renter-occupied |
| 1-Person Household | 13 (100.0%) | 0 (0.0%) |
| 2-Person Household | 68 (100.0%) | 0 (0.0%) |
| 3-Person Household | 0 (0.0%) | 79 (100.0%) |
| 4+ Person Household | 11 (11.2%) | 87 (88.8%) |
| Total Housing Units | 92 (35.7%) | 166 (64.3%) |
Occupancy by Educational Attainment in Teviston
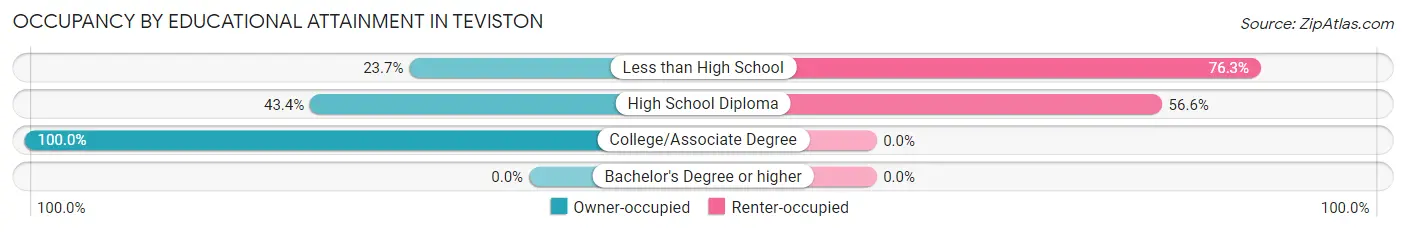
| Household Size | Owner-occupied | Renter-occupied |
| Less than High School | 33 (23.7%) | 106 (76.3%) |
| High School Diploma | 46 (43.4%) | 60 (56.6%) |
| College/Associate Degree | 13 (100.0%) | 0 (0.0%) |
| Bachelor's Degree or higher | 0 (0.0%) | 0 (0.0%) |
Occupancy by Age of Householder in Teviston
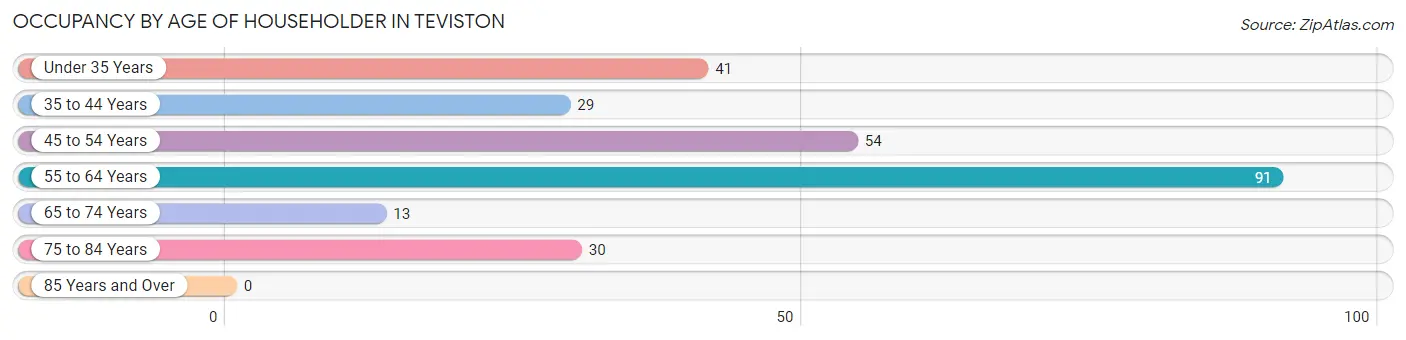
| Age Bracket | # Households | % Households |
| Under 35 Years | 41 | 15.9% |
| 35 to 44 Years | 29 | 11.2% |
| 45 to 54 Years | 54 | 20.9% |
| 55 to 64 Years | 91 | 35.3% |
| 65 to 74 Years | 13 | 5.0% |
| 75 to 84 Years | 30 | 11.6% |
| 85 Years and Over | 0 | 0.0% |
| Total | 258 | 100.0% |
Housing Finances in Teviston
Median Income by Occupancy in Teviston
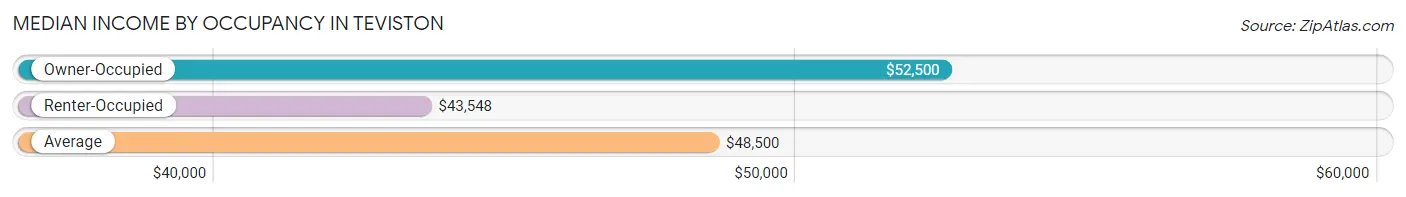
| Occupancy Type | # Households | Median Income |
| Owner-Occupied | 92 (35.7%) | $52,500 |
| Renter-Occupied | 166 (64.3%) | $43,548 |
| Average | 258 (100.0%) | $48,500 |
Occupancy by Householder Income Bracket in Teviston
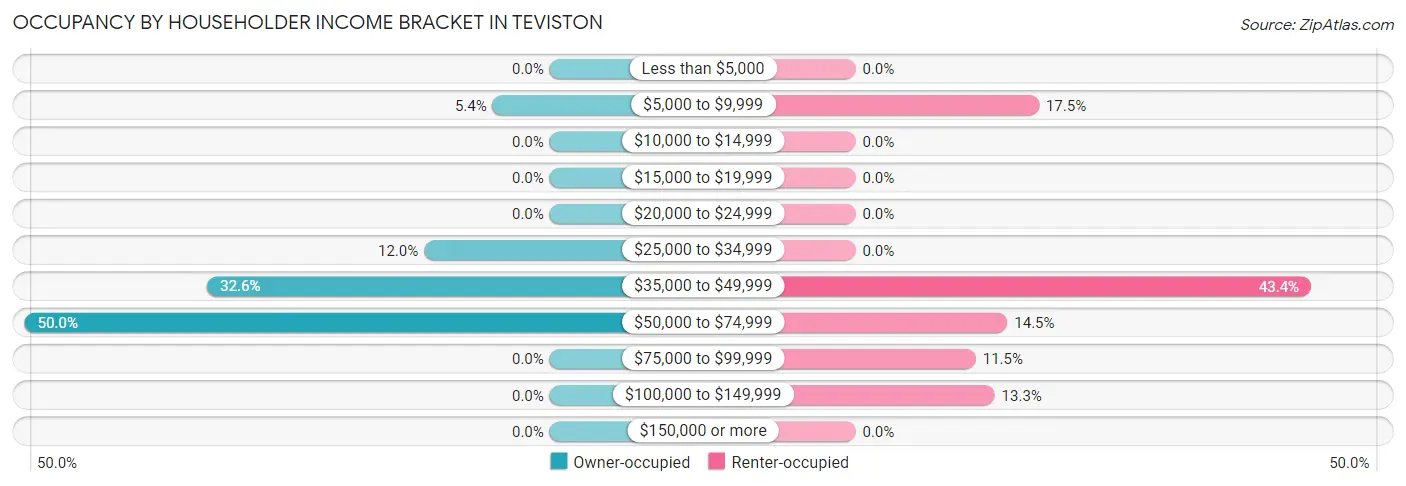
| Income Bracket | Owner-occupied | Renter-occupied |
| Less than $5,000 | 0 (0.0%) | 0 (0.0%) |
| $5,000 to $9,999 | 5 (5.4%) | 29 (17.5%) |
| $10,000 to $14,999 | 0 (0.0%) | 0 (0.0%) |
| $15,000 to $19,999 | 0 (0.0%) | 0 (0.0%) |
| $20,000 to $24,999 | 0 (0.0%) | 0 (0.0%) |
| $25,000 to $34,999 | 11 (12.0%) | 0 (0.0%) |
| $35,000 to $49,999 | 30 (32.6%) | 72 (43.4%) |
| $50,000 to $74,999 | 46 (50.0%) | 24 (14.5%) |
| $75,000 to $99,999 | 0 (0.0%) | 19 (11.5%) |
| $100,000 to $149,999 | 0 (0.0%) | 22 (13.3%) |
| $150,000 or more | 0 (0.0%) | 0 (0.0%) |
| Total | 92 (100.0%) | 166 (100.0%) |
Monthly Housing Cost Tiers in Teviston
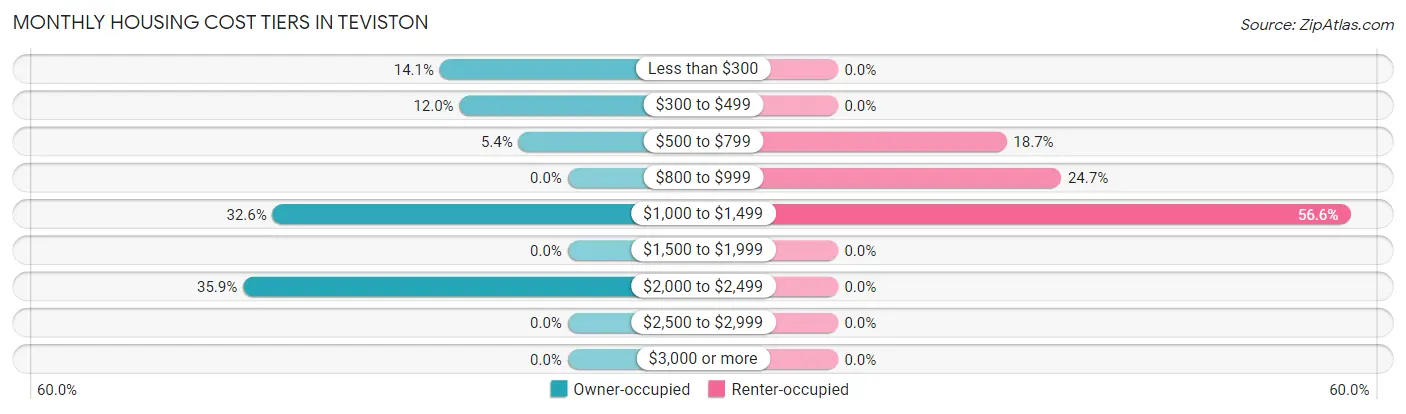
| Monthly Cost | Owner-occupied | Renter-occupied |
| Less than $300 | 13 (14.1%) | 0 (0.0%) |
| $300 to $499 | 11 (12.0%) | 0 (0.0%) |
| $500 to $799 | 5 (5.4%) | 31 (18.7%) |
| $800 to $999 | 0 (0.0%) | 41 (24.7%) |
| $1,000 to $1,499 | 30 (32.6%) | 94 (56.6%) |
| $1,500 to $1,999 | 0 (0.0%) | 0 (0.0%) |
| $2,000 to $2,499 | 33 (35.9%) | 0 (0.0%) |
| $2,500 to $2,999 | 0 (0.0%) | 0 (0.0%) |
| $3,000 or more | 0 (0.0%) | 0 (0.0%) |
| Total | 92 (100.0%) | 166 (100.0%) |
Physical Housing Characteristics in Teviston
Housing Structures in Teviston
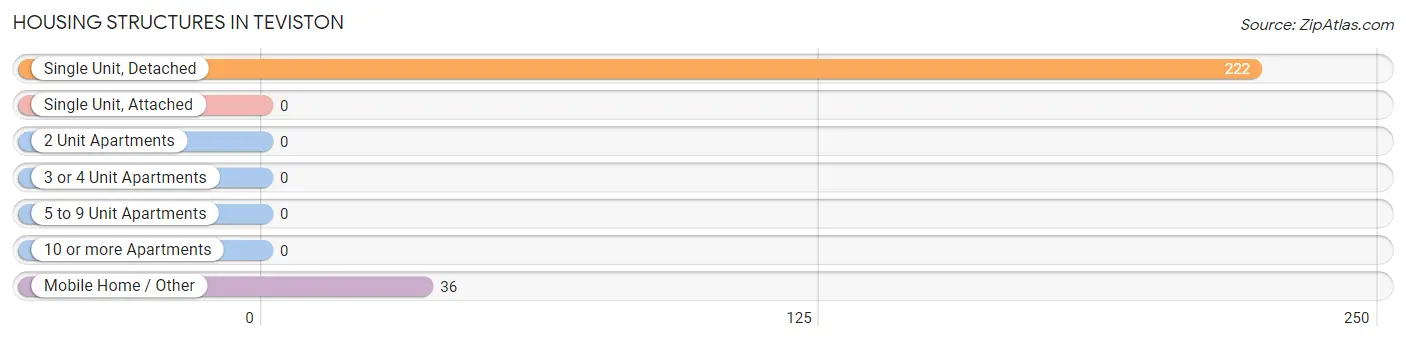
| Structure Type | # Housing Units | % Housing Units |
| Single Unit, Detached | 222 | 86.1% |
| Single Unit, Attached | 0 | 0.0% |
| 2 Unit Apartments | 0 | 0.0% |
| 3 or 4 Unit Apartments | 0 | 0.0% |
| 5 to 9 Unit Apartments | 0 | 0.0% |
| 10 or more Apartments | 0 | 0.0% |
| Mobile Home / Other | 36 | 14.0% |
| Total | 258 | 100.0% |
Housing Structures by Occupancy in Teviston
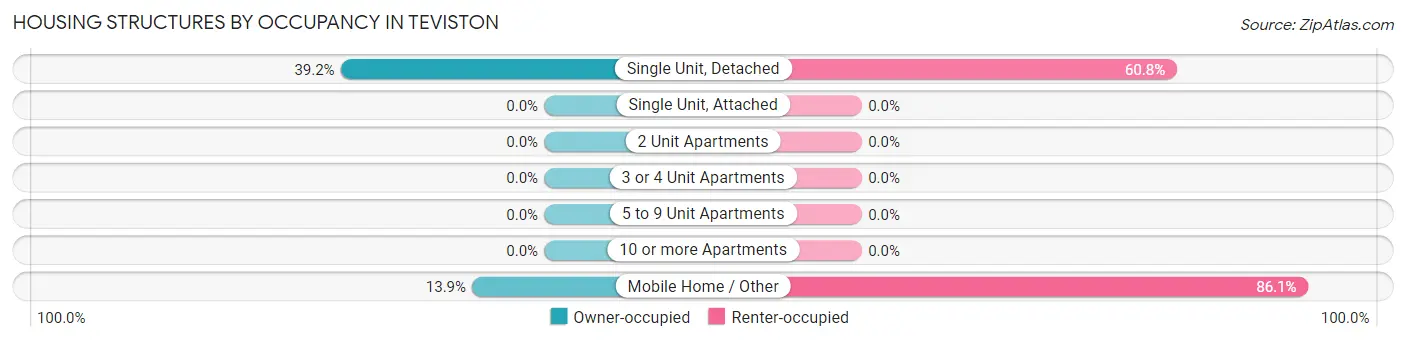
| Structure Type | Owner-occupied | Renter-occupied |
| Single Unit, Detached | 87 (39.2%) | 135 (60.8%) |
| Single Unit, Attached | 0 (0.0%) | 0 (0.0%) |
| 2 Unit Apartments | 0 (0.0%) | 0 (0.0%) |
| 3 or 4 Unit Apartments | 0 (0.0%) | 0 (0.0%) |
| 5 to 9 Unit Apartments | 0 (0.0%) | 0 (0.0%) |
| 10 or more Apartments | 0 (0.0%) | 0 (0.0%) |
| Mobile Home / Other | 5 (13.9%) | 31 (86.1%) |
| Total | 92 (35.7%) | 166 (64.3%) |
Housing Structures by Number of Rooms in Teviston
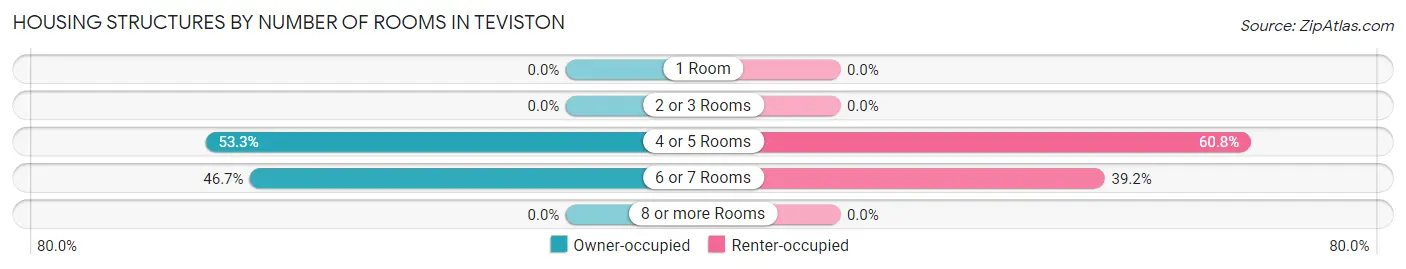
| Number of Rooms | Owner-occupied | Renter-occupied |
| 1 Room | 0 (0.0%) | 0 (0.0%) |
| 2 or 3 Rooms | 0 (0.0%) | 0 (0.0%) |
| 4 or 5 Rooms | 49 (53.3%) | 101 (60.8%) |
| 6 or 7 Rooms | 43 (46.7%) | 65 (39.2%) |
| 8 or more Rooms | 0 (0.0%) | 0 (0.0%) |
| Total | 92 (100.0%) | 166 (100.0%) |
Housing Structure by Heating Type in Teviston
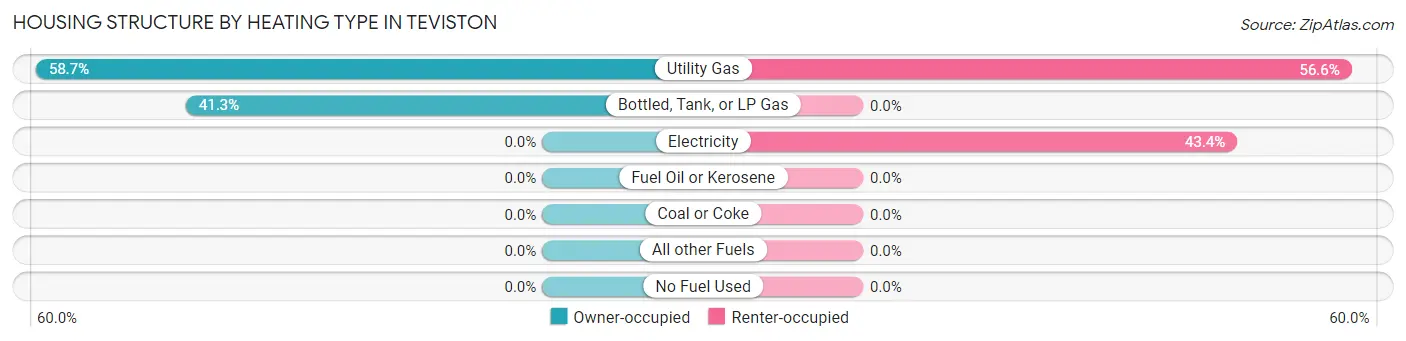
| Heating Type | Owner-occupied | Renter-occupied |
| Utility Gas | 54 (58.7%) | 94 (56.6%) |
| Bottled, Tank, or LP Gas | 38 (41.3%) | 0 (0.0%) |
| Electricity | 0 (0.0%) | 72 (43.4%) |
| Fuel Oil or Kerosene | 0 (0.0%) | 0 (0.0%) |
| Coal or Coke | 0 (0.0%) | 0 (0.0%) |
| All other Fuels | 0 (0.0%) | 0 (0.0%) |
| No Fuel Used | 0 (0.0%) | 0 (0.0%) |
| Total | 92 (100.0%) | 166 (100.0%) |
Household Vehicle Usage in Teviston
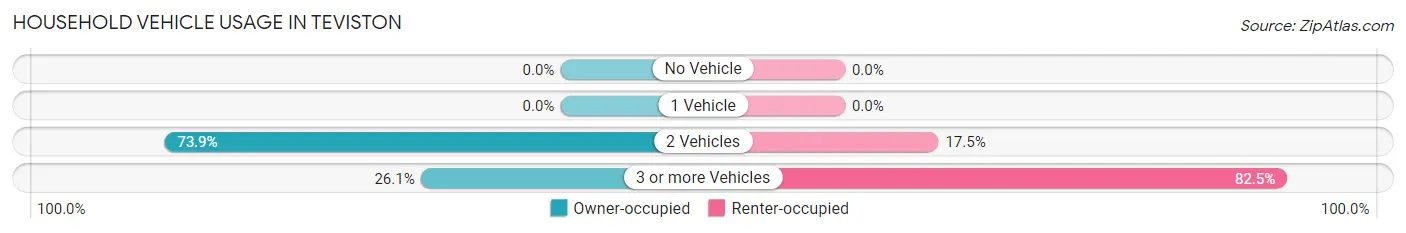
| Vehicles per Household | Owner-occupied | Renter-occupied |
| No Vehicle | 0 (0.0%) | 0 (0.0%) |
| 1 Vehicle | 0 (0.0%) | 0 (0.0%) |
| 2 Vehicles | 68 (73.9%) | 29 (17.5%) |
| 3 or more Vehicles | 24 (26.1%) | 137 (82.5%) |
| Total | 92 (100.0%) | 166 (100.0%) |
Real Estate & Mortgages in Teviston
Real Estate and Mortgage Overview in Teviston
| Characteristic | Without Mortgage | With Mortgage |
| Housing Units | 59 | 33 |
| Median Property Value | $504,200 | $0 |
| Median Household Income | $48,625 | $0 |
| Monthly Housing Costs | - | - |
| Real Estate Taxes | - | - |
Property Value by Mortgage Status in Teviston
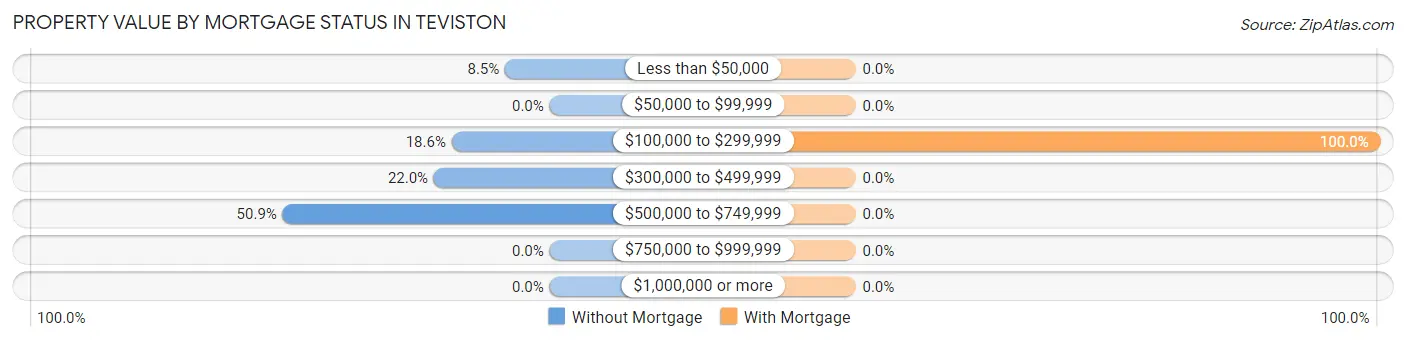
| Property Value | Without Mortgage | With Mortgage |
| Less than $50,000 | 5 (8.5%) | 0 (0.0%) |
| $50,000 to $99,999 | 0 (0.0%) | 0 (0.0%) |
| $100,000 to $299,999 | 11 (18.6%) | 33 (100.0%) |
| $300,000 to $499,999 | 13 (22.0%) | 0 (0.0%) |
| $500,000 to $749,999 | 30 (50.8%) | 0 (0.0%) |
| $750,000 to $999,999 | 0 (0.0%) | 0 (0.0%) |
| $1,000,000 or more | 0 (0.0%) | 0 (0.0%) |
| Total | 59 (100.0%) | 33 (100.0%) |
Household Income by Mortgage Status in Teviston
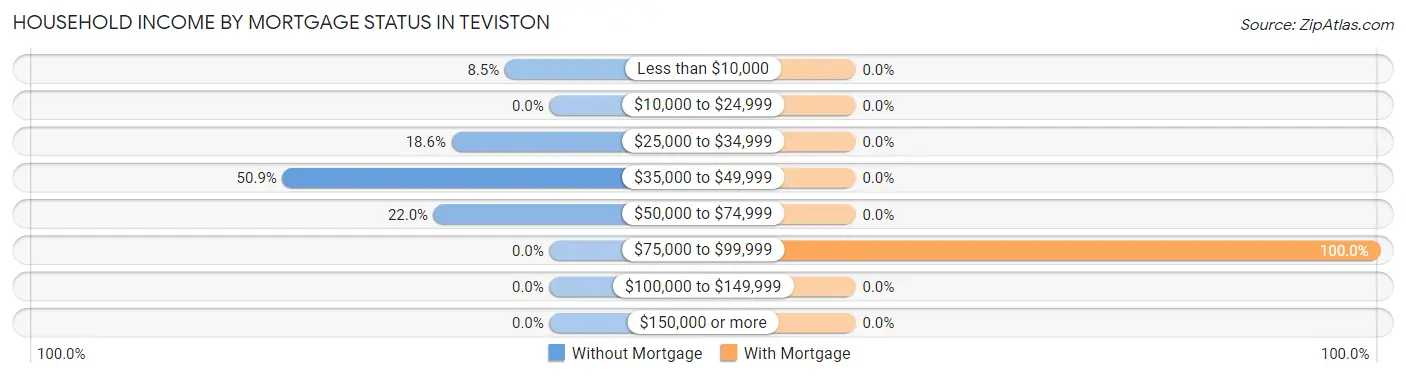
| Household Income | Without Mortgage | With Mortgage |
| Less than $10,000 | 5 (8.5%) | 0 (0.0%) |
| $10,000 to $24,999 | 0 (0.0%) | 0 (0.0%) |
| $25,000 to $34,999 | 11 (18.6%) | 0 (0.0%) |
| $35,000 to $49,999 | 30 (50.8%) | 0 (0.0%) |
| $50,000 to $74,999 | 13 (22.0%) | 0 (0.0%) |
| $75,000 to $99,999 | 0 (0.0%) | 33 (100.0%) |
| $100,000 to $149,999 | 0 (0.0%) | 0 (0.0%) |
| $150,000 or more | 0 (0.0%) | 0 (0.0%) |
| Total | 59 (100.0%) | 33 (100.0%) |
Property Value to Household Income Ratio in Teviston
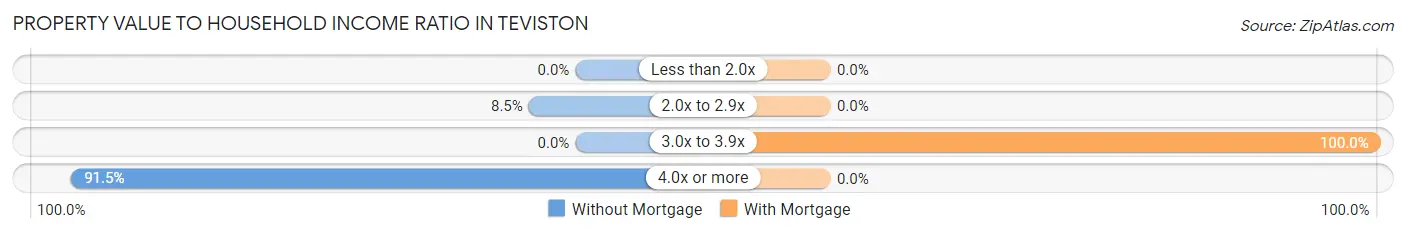
| Value-to-Income Ratio | Without Mortgage | With Mortgage |
| Less than 2.0x | 0 (0.0%) | 0 (0.0%) |
| 2.0x to 2.9x | 5 (8.5%) | 0 (0.0%) |
| 3.0x to 3.9x | 0 (0.0%) | 33 (100.0%) |
| 4.0x or more | 54 (91.5%) | 0 (0.0%) |
| Total | 59 (100.0%) | 33 (100.0%) |
Real Estate Taxes by Mortgage Status in Teviston
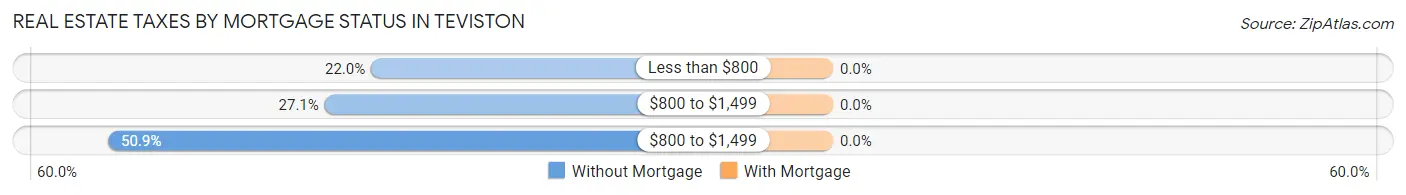
| Property Taxes | Without Mortgage | With Mortgage |
| Less than $800 | 13 (22.0%) | 0 (0.0%) |
| $800 to $1,499 | 16 (27.1%) | 0 (0.0%) |
| $800 to $1,499 | 30 (50.8%) | 0 (0.0%) |
| Total | 59 (100.0%) | 33 (100.0%) |
Health & Disability in Teviston
Health Insurance Coverage by Age in Teviston
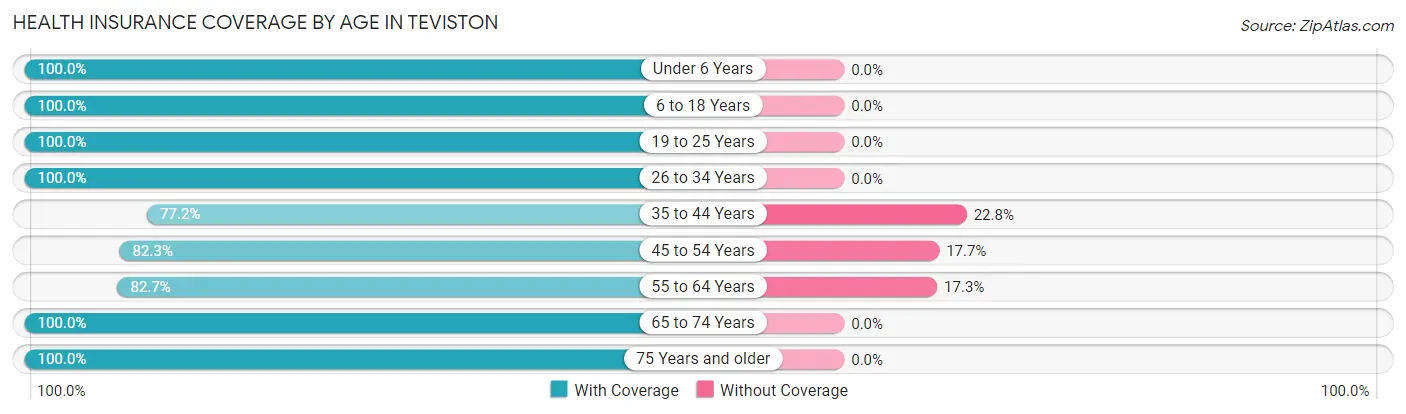
| Age Bracket | With Coverage | Without Coverage |
| Under 6 Years | 63 (100.0%) | 0 (0.0%) |
| 6 to 18 Years | 323 (100.0%) | 0 (0.0%) |
| 19 to 25 Years | 78 (100.0%) | 0 (0.0%) |
| 26 to 34 Years | 80 (100.0%) | 0 (0.0%) |
| 35 to 44 Years | 98 (77.2%) | 29 (22.8%) |
| 45 to 54 Years | 93 (82.3%) | 20 (17.7%) |
| 55 to 64 Years | 105 (82.7%) | 22 (17.3%) |
| 65 to 74 Years | 68 (100.0%) | 0 (0.0%) |
| 75 Years and older | 59 (100.0%) | 0 (0.0%) |
| Total | 967 (93.2%) | 71 (6.8%) |
Health Insurance Coverage by Citizenship Status in Teviston
| Citizenship Status | With Coverage | Without Coverage |
| Native Born | 63 (100.0%) | 0 (0.0%) |
| Foreign Born, Citizen | 323 (100.0%) | 0 (0.0%) |
| Foreign Born, not a Citizen | 78 (100.0%) | 0 (0.0%) |
Health Insurance Coverage by Household Income in Teviston
| Household Income | With Coverage | Without Coverage |
| Under $25,000 | 71 (71.0%) | 29 (29.0%) |
| $25,000 to $49,999 | 418 (100.0%) | 0 (0.0%) |
| $50,000 to $74,999 | 281 (100.0%) | 0 (0.0%) |
| $75,000 to $99,999 | 100 (100.0%) | 0 (0.0%) |
| $100,000 and over | 97 (69.8%) | 42 (30.2%) |
Public vs Private Health Insurance Coverage by Age in Teviston
| Age Bracket | Public Insurance | Private Insurance |
| Under 6 | 63 (100.0%) | 0 (0.0%) |
| 6 to 18 Years | 323 (100.0%) | 0 (0.0%) |
| 19 to 25 Years | 54 (69.2%) | 24 (30.8%) |
| 25 to 34 Years | 80 (100.0%) | 0 (0.0%) |
| 35 to 44 Years | 56 (44.1%) | 42 (33.1%) |
| 45 to 54 Years | 50 (44.3%) | 43 (38.1%) |
| 55 to 64 Years | 105 (82.7%) | 0 (0.0%) |
| 65 to 74 Years | 68 (100.0%) | 13 (19.1%) |
| 75 Years and over | 59 (100.0%) | 0 (0.0%) |
| Total | 858 (82.7%) | 122 (11.7%) |
Disability Status by Sex by Age in Teviston
| Age Bracket | Male | Female |
| Under 5 Years | 0 (0.0%) | 0 (0.0%) |
| 5 to 17 Years | 0 (0.0%) | 0 (0.0%) |
| 18 to 34 Years | 50 (35.2%) | 15 (18.8%) |
| 35 to 64 Years | 41 (21.3%) | 11 (6.3%) |
| 65 to 74 Years | 0 (0.0%) | 55 (100.0%) |
| 75 Years and over | 0 (0.0%) | 0 (0.0%) |
Disability Class by Sex by Age in Teviston
Disability Class: Hearing Difficulty
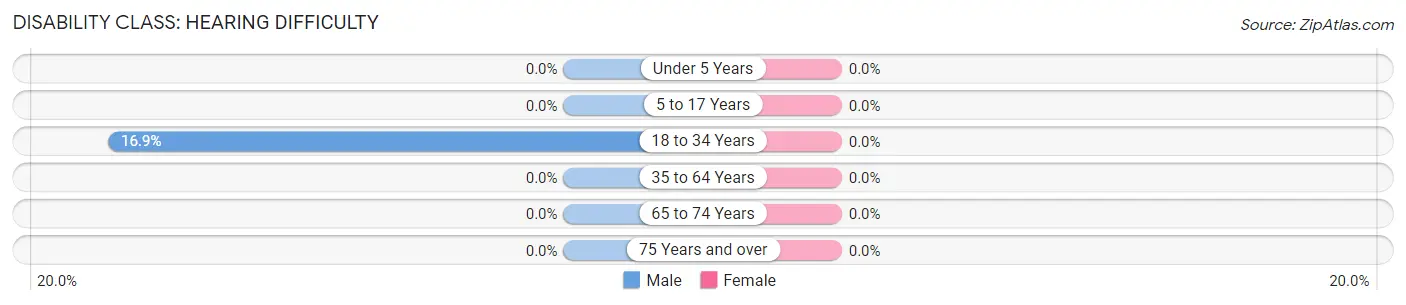
| Age Bracket | Male | Female |
| Under 5 Years | 0 (0.0%) | 0 (0.0%) |
| 5 to 17 Years | 0 (0.0%) | 0 (0.0%) |
| 18 to 34 Years | 24 (16.9%) | 0 (0.0%) |
| 35 to 64 Years | 0 (0.0%) | 0 (0.0%) |
| 65 to 74 Years | 0 (0.0%) | 0 (0.0%) |
| 75 Years and over | 0 (0.0%) | 0 (0.0%) |
Disability Class: Vision Difficulty
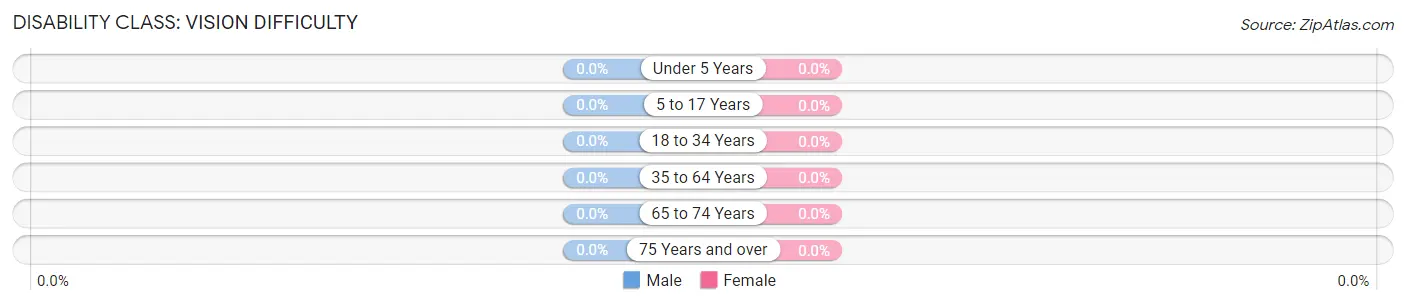
| Age Bracket | Male | Female |
| Under 5 Years | 0 (0.0%) | 0 (0.0%) |
| 5 to 17 Years | 0 (0.0%) | 0 (0.0%) |
| 18 to 34 Years | 0 (0.0%) | 0 (0.0%) |
| 35 to 64 Years | 0 (0.0%) | 0 (0.0%) |
| 65 to 74 Years | 0 (0.0%) | 0 (0.0%) |
| 75 Years and over | 0 (0.0%) | 0 (0.0%) |
Disability Class: Cognitive Difficulty

| Age Bracket | Male | Female |
| 5 to 17 Years | 0 (0.0%) | 0 (0.0%) |
| 18 to 34 Years | 0 (0.0%) | 0 (0.0%) |
| 35 to 64 Years | 0 (0.0%) | 0 (0.0%) |
| 65 to 74 Years | 0 (0.0%) | 55 (100.0%) |
| 75 Years and over | 0 (0.0%) | 0 (0.0%) |
Disability Class: Ambulatory Difficulty
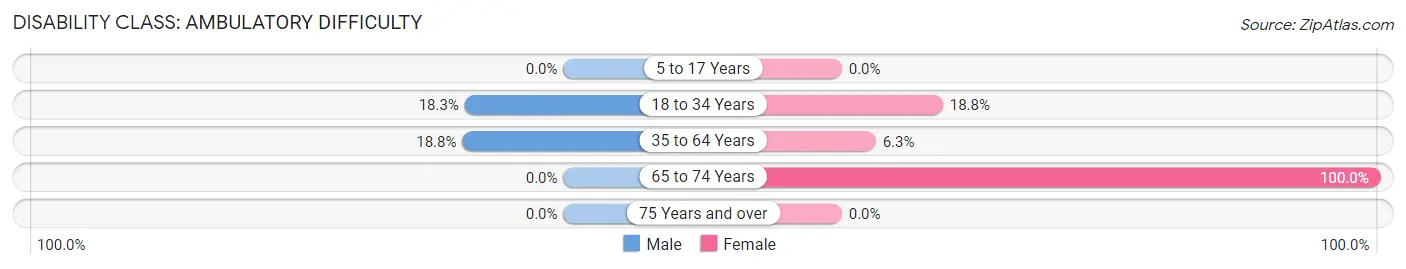
| Age Bracket | Male | Female |
| 5 to 17 Years | 0 (0.0%) | 0 (0.0%) |
| 18 to 34 Years | 26 (18.3%) | 15 (18.8%) |
| 35 to 64 Years | 36 (18.8%) | 11 (6.3%) |
| 65 to 74 Years | 0 (0.0%) | 55 (100.0%) |
| 75 Years and over | 0 (0.0%) | 0 (0.0%) |
Disability Class: Self-Care Difficulty
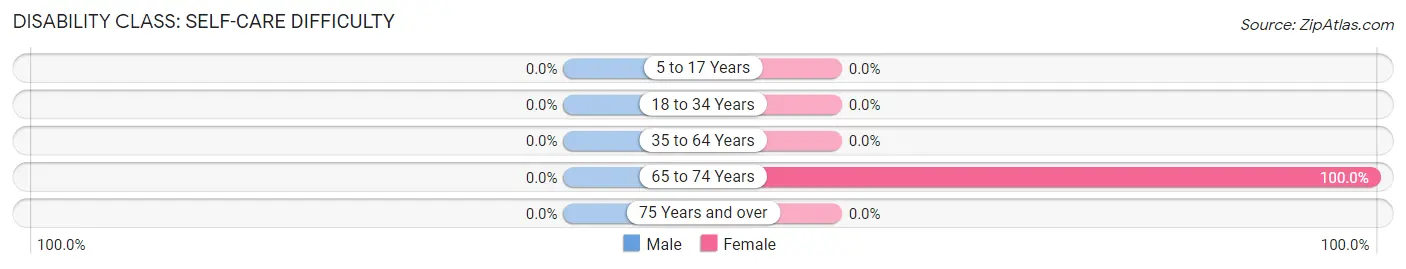
| Age Bracket | Male | Female |
| 5 to 17 Years | 0 (0.0%) | 0 (0.0%) |
| 18 to 34 Years | 0 (0.0%) | 0 (0.0%) |
| 35 to 64 Years | 0 (0.0%) | 0 (0.0%) |
| 65 to 74 Years | 0 (0.0%) | 55 (100.0%) |
| 75 Years and over | 0 (0.0%) | 0 (0.0%) |
Technology Access in Teviston
Computing Device Access in Teviston
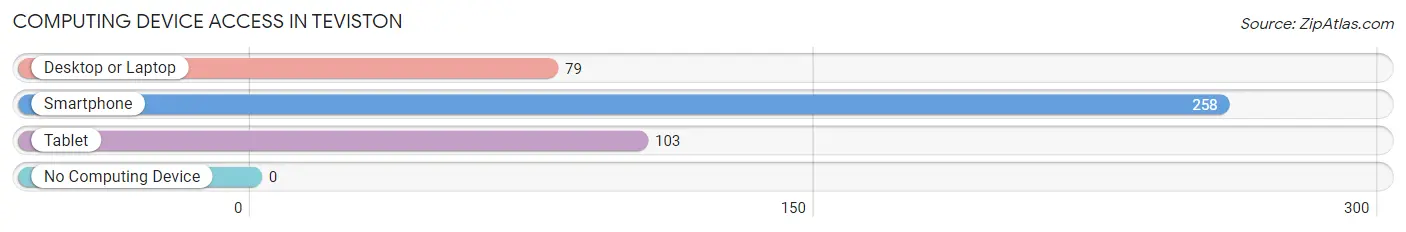
| Device Type | # Households | % Households |
| Desktop or Laptop | 79 | 30.6% |
| Smartphone | 258 | 100.0% |
| Tablet | 103 | 39.9% |
| No Computing Device | 0 | 0.0% |
| Total | 258 | 100.0% |
Internet Access in Teviston
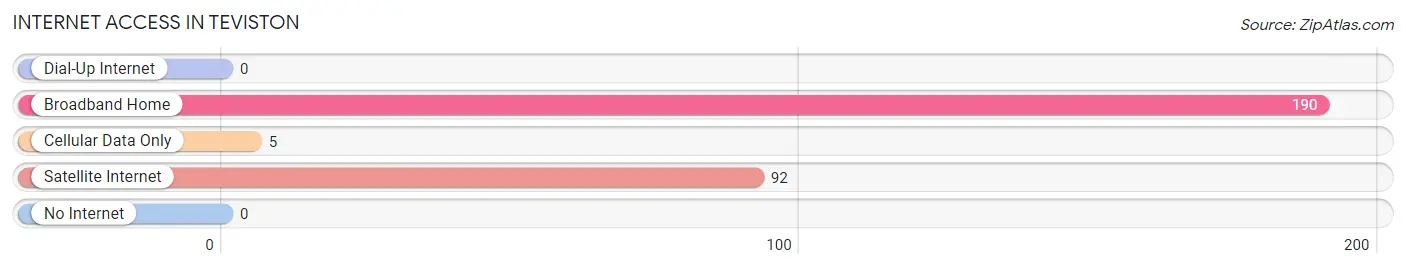
| Internet Type | # Households | % Households |
| Dial-Up Internet | 0 | 0.0% |
| Broadband Home | 190 | 73.6% |
| Cellular Data Only | 5 | 1.9% |
| Satellite Internet | 92 | 35.7% |
| No Internet | 0 | 0.0% |
| Total | 258 | 100.0% |
Teviston Summary
Teviston is a small unincorporated community located in Tulare County, California. It is situated in the San Joaquin Valley, approximately 8 miles south of Pixley and 8 miles north of Ducor. The population of Teviston was estimated to be around 1,000 in 2020.
History
Teviston was founded in the late 1800s by a group of settlers from the Midwest. The town was named after the Tevis family, who were among the first settlers. The Tevis family owned a large ranch in the area and the town was built around it.
The town grew slowly but steadily over the years, and by the early 1900s it had become a thriving agricultural community. The town was home to a variety of businesses, including a general store, a blacksmith shop, a hotel, and a saloon.
In the 1920s, Teviston experienced a period of rapid growth. The town was connected to the outside world by the Southern Pacific Railroad, and the population increased from around 500 to over 1,000.
Geography
Teviston is located in the San Joaquin Valley, which is part of the Central Valley of California. The town is situated at an elevation of approximately 200 feet above sea level. The climate in Teviston is semi-arid, with hot summers and mild winters.
The town is surrounded by agricultural land, and the main crops grown in the area are cotton, alfalfa, and grapes. The nearby towns of Pixley and Ducor are also agricultural communities.
Economy
Teviston’s economy is largely based on agriculture. The town is home to several farms and ranches, and the main crops grown in the area are cotton, alfalfa, and grapes. The town also has a few small businesses, including a general store, a gas station, and a restaurant.
Demographics
Teviston is a predominantly Hispanic community, with approximately 90% of the population identifying as Hispanic or Latino. The median household income in Teviston is around $30,000, and the poverty rate is around 20%. The town has a high rate of unemployment, with approximately 25% of the population unemployed.
Conclusion
Teviston is a small unincorporated community located in Tulare County, California. It was founded in the late 1800s by a group of settlers from the Midwest, and the town was named after the Tevis family. Teviston is situated in the San Joaquin Valley, and the town’s economy is largely based on agriculture. The population of Teviston is predominantly Hispanic, with approximately 90% of the population identifying as Hispanic or Latino. The median household income in Teviston is around $30,000, and the poverty rate is around 20%.
Common Questions
What is Per Capita Income in Teviston?
Per Capita income in Teviston is $15,160.
What is the Median Family Income in Teviston?
Median Family Income in Teviston is $47,958.
What is the Median Household income in Teviston?
Median Household Income in Teviston is $48,500.
What is Inequality or Gini Index in Teviston?
Inequality or Gini Index in Teviston is 0.30.
What is the Total Population of Teviston?
Total Population of Teviston is 1,038.
What is the Total Male Population of Teviston?
Total Male Population of Teviston is 520.
What is the Total Female Population of Teviston?
Total Female Population of Teviston is 518.
What is the Ratio of Males per 100 Females in Teviston?
There are 100.39 Males per 100 Females in Teviston.
What is the Ratio of Females per 100 Males in Teviston?
There are 99.62 Females per 100 Males in Teviston.
What is the Median Population Age in Teviston?
Median Population Age in Teviston is 29.8 Years.
What is the Average Family Size in Teviston
Average Family Size in Teviston is 4.2 People.
What is the Average Household Size in Teviston
Average Household Size in Teviston is 4.0 People.
How Large is the Labor Force in Teviston?
There are 319 People in the Labor Forcein in Teviston.
What is the Percentage of People in the Labor Force in Teviston?
40.5% of People are in the Labor Force in Teviston.
What is the Unemployment Rate in Teviston?
Unemployment Rate in Teviston is 32.9%.