Cities with the Highest Percentage of Families with Income Below $10,000 in Colorado
RELATED REPORTS & OPTIONS
Family Income | $0-10k
Colorado
Compare Cities
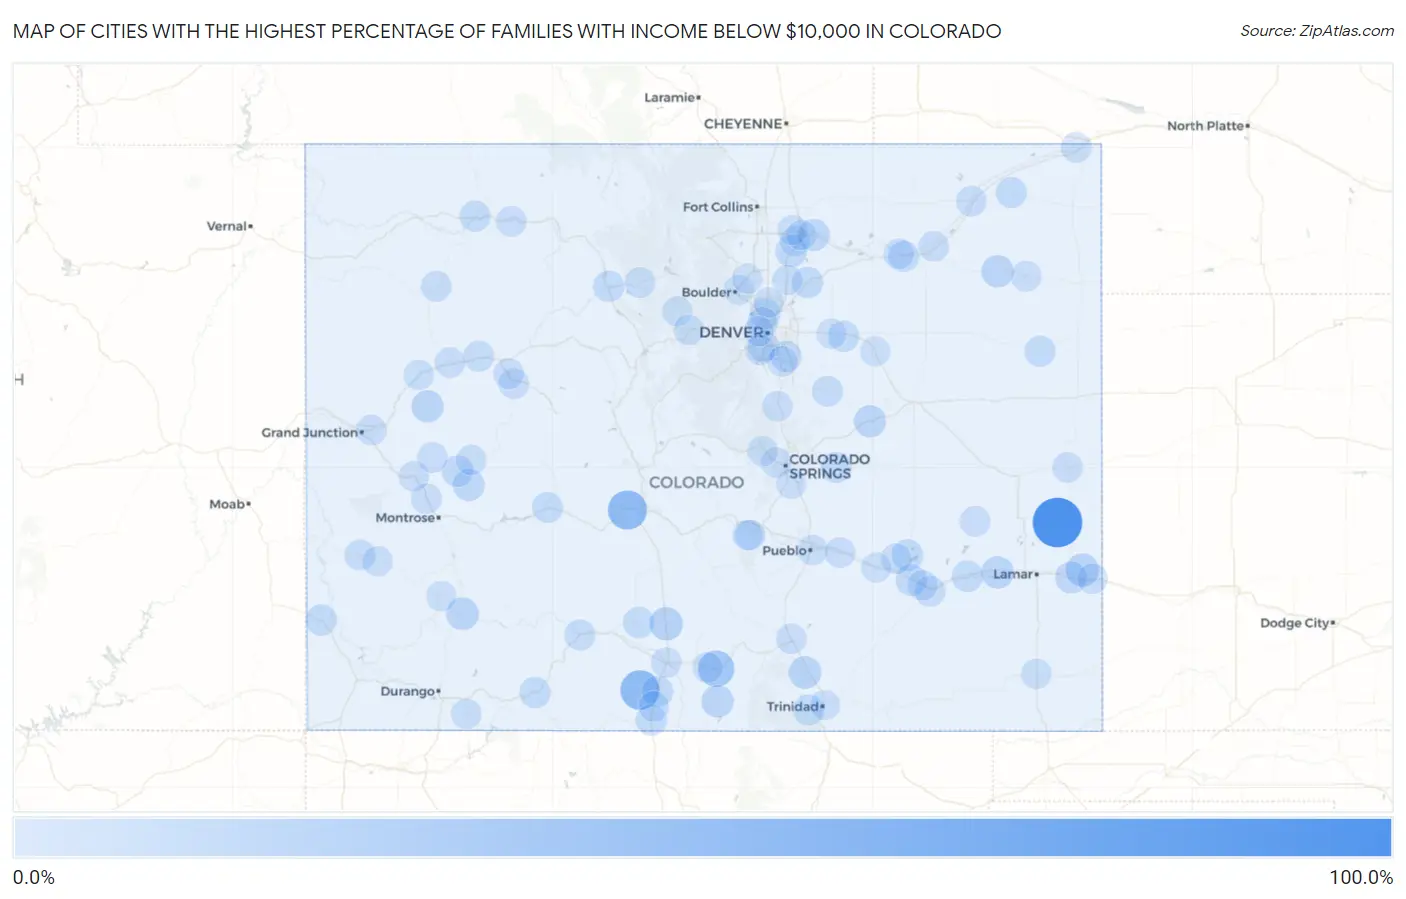
Map of Cities with the Highest Percentage of Families with Income Below $10,000 in Colorado
0.0%
100.0%
Cities with the Highest Percentage of Families with Income Below $10,000 in Colorado
| City | Families with Income < $10k | vs State | vs National | |
| 1. | Brandon | 100.0% | 2.2%(+97.8)#1 | 3.1%(+96.9)#32 |
| 2. | Capulin | 47.5% | 2.2%(+45.3)#2 | 3.1%(+44.4)#146 |
| 3. | Maysville | 47.0% | 2.2%(+44.8)#3 | 3.1%(+43.9)#150 |
| 4. | Fort Garland | 32.6% | 2.2%(+30.4)#4 | 3.1%(+29.5)#342 |
| 5. | Hooper | 18.2% | 2.2%(+16.0)#5 | 3.1%(+15.1)#1,083 |
| 6. | Hartman | 16.7% | 2.2%(+14.5)#6 | 3.1%(+13.6)#1,255 |
| 7. | Aguilar | 14.7% | 2.2%(+12.5)#7 | 3.1%(+11.6)#1,519 |
| 8. | Silverton | 14.5% | 2.2%(+12.3)#8 | 3.1%(+11.4)#1,553 |
| 9. | Hasty | 14.3% | 2.2%(+12.1)#9 | 3.1%(+11.2)#1,613 |
| 10. | Otis | 13.8% | 2.2%(+11.6)#10 | 3.1%(+10.7)#1,708 |
| 11. | San Luis | 13.0% | 2.2%(+10.8)#11 | 3.1%(+9.90)#1,880 |
| 12. | Collbran | 12.7% | 2.2%(+10.5)#12 | 3.1%(+9.60)#1,951 |
| 13. | Simla | 12.3% | 2.2%(+10.1)#13 | 3.1%(+9.20)#2,053 |
| 14. | Twin Lakes Cdp Lake County | 12.3% | 2.2%(+10.1)#14 | 3.1%(+9.20)#2,058 |
| 15. | Granada | 12.1% | 2.2%(+9.90)#15 | 3.1%(+9.00)#2,111 |
| 16. | Kersey | 11.4% | 2.2%(+9.20)#16 | 3.1%(+8.30)#2,323 |
| 17. | Crawford | 10.9% | 2.2%(+8.70)#17 | 3.1%(+7.80)#2,501 |
| 18. | Gilcrest | 10.6% | 2.2%(+8.40)#18 | 3.1%(+7.50)#2,602 |
| 19. | Ordway | 10.2% | 2.2%(+8.00)#19 | 3.1%(+7.10)#2,769 |
| 20. | Rocky Ford | 10.0% | 2.2%(+7.80)#20 | 3.1%(+6.90)#2,829 |
| 21. | Hotchkiss | 9.7% | 2.2%(+7.50)#21 | 3.1%(+6.60)#3,005 |
| 22. | La Jara | 9.3% | 2.2%(+7.10)#22 | 3.1%(+6.20)#3,201 |
| 23. | Hudson | 9.2% | 2.2%(+7.00)#23 | 3.1%(+6.10)#3,238 |
| 24. | Las Animas | 9.0% | 2.2%(+6.80)#24 | 3.1%(+5.90)#3,357 |
| 25. | Center | 8.8% | 2.2%(+6.60)#25 | 3.1%(+5.70)#3,452 |
| 26. | Pagosa Springs | 8.8% | 2.2%(+6.60)#26 | 3.1%(+5.70)#3,456 |
| 27. | Strasburg | 8.7% | 2.2%(+6.50)#27 | 3.1%(+5.60)#3,508 |
| 28. | Kremmling | 8.7% | 2.2%(+6.50)#28 | 3.1%(+5.60)#3,515 |
| 29. | Antonito | 8.3% | 2.2%(+6.10)#29 | 3.1%(+5.20)#3,731 |
| 30. | Dove Valley | 8.1% | 2.2%(+5.90)#30 | 3.1%(+5.00)#3,833 |
| 31. | Dove Creek | 8.1% | 2.2%(+5.90)#31 | 3.1%(+5.00)#3,855 |
| 32. | Kirk | 8.0% | 2.2%(+5.80)#32 | 3.1%(+4.90)#3,938 |
| 33. | Gunnison | 7.8% | 2.2%(+5.60)#33 | 3.1%(+4.70)#4,020 |
| 34. | Fleming | 7.7% | 2.2%(+5.50)#34 | 3.1%(+4.60)#4,122 |
| 35. | Cokedale | 7.7% | 2.2%(+5.50)#35 | 3.1%(+4.60)#4,138 |
| 36. | Fort Morgan | 7.6% | 2.2%(+5.40)#36 | 3.1%(+4.50)#4,158 |
| 37. | Craig | 7.5% | 2.2%(+5.30)#37 | 3.1%(+4.40)#4,219 |
| 38. | Federal Heights | 7.4% | 2.2%(+5.20)#38 | 3.1%(+4.30)#4,293 |
| 39. | Sheridan | 7.4% | 2.2%(+5.20)#39 | 3.1%(+4.30)#4,298 |
| 40. | Ellicott | 7.4% | 2.2%(+5.20)#40 | 3.1%(+4.30)#4,313 |
| 41. | South Fork | 7.2% | 2.2%(+5.00)#41 | 3.1%(+4.10)#4,497 |
| 42. | La Junta | 6.4% | 2.2%(+4.20)#42 | 3.1%(+3.30)#5,185 |
| 43. | New Castle | 6.4% | 2.2%(+4.20)#43 | 3.1%(+3.30)#5,195 |
| 44. | Kiowa | 6.3% | 2.2%(+4.10)#44 | 3.1%(+3.20)#5,324 |
| 45. | Meeker | 6.2% | 2.2%(+4.00)#45 | 3.1%(+3.10)#5,420 |
| 46. | Naturita | 6.2% | 2.2%(+4.00)#46 | 3.1%(+3.10)#5,461 |
| 47. | Hot Sulphur Springs | 5.8% | 2.2%(+3.60)#47 | 3.1%(+2.70)#5,915 |
| 48. | Sterling | 5.7% | 2.2%(+3.50)#48 | 3.1%(+2.60)#5,956 |
| 49. | Carbondale | 5.7% | 2.2%(+3.50)#49 | 3.1%(+2.60)#5,968 |
| 50. | Hayden | 5.7% | 2.2%(+3.50)#50 | 3.1%(+2.60)#5,991 |
| 51. | Olathe | 5.6% | 2.2%(+3.40)#51 | 3.1%(+2.50)#6,131 |
| 52. | Crowley | 5.6% | 2.2%(+3.40)#52 | 3.1%(+2.50)#6,189 |
| 53. | Haswell | 5.6% | 2.2%(+3.40)#53 | 3.1%(+2.50)#6,200 |
| 54. | Meridian | 5.5% | 2.2%(+3.30)#54 | 3.1%(+2.40)#6,264 |
| 55. | Julesburg | 5.5% | 2.2%(+3.30)#55 | 3.1%(+2.40)#6,285 |
| 56. | Log Lane Village | 5.5% | 2.2%(+3.30)#56 | 3.1%(+2.40)#6,295 |
| 57. | Rifle | 5.4% | 2.2%(+3.20)#57 | 3.1%(+2.30)#6,351 |
| 58. | Pueblo | 5.3% | 2.2%(+3.10)#58 | 3.1%(+2.20)#6,446 |
| 59. | Hillrose | 5.2% | 2.2%(+3.00)#59 | 3.1%(+2.10)#6,731 |
| 60. | Walsenburg | 5.1% | 2.2%(+2.90)#60 | 3.1%(+2.00)#6,772 |
| 61. | Clifton | 5.0% | 2.2%(+2.80)#61 | 3.1%(+1.90)#6,893 |
| 62. | Cattle Creek | 4.9% | 2.2%(+2.70)#62 | 3.1%(+1.80)#7,162 |
| 63. | Berkley | 4.8% | 2.2%(+2.60)#63 | 3.1%(+1.70)#7,225 |
| 64. | Swink | 4.8% | 2.2%(+2.60)#64 | 3.1%(+1.70)#7,293 |
| 65. | Avondale | 4.8% | 2.2%(+2.60)#65 | 3.1%(+1.70)#7,308 |
| 66. | Romeo | 4.8% | 2.2%(+2.60)#66 | 3.1%(+1.70)#7,311 |
| 67. | Larkspur | 4.8% | 2.2%(+2.60)#67 | 3.1%(+1.70)#7,322 |
| 68. | Delta | 4.7% | 2.2%(+2.50)#68 | 3.1%(+1.60)#7,376 |
| 69. | Manitou Springs | 4.7% | 2.2%(+2.50)#69 | 3.1%(+1.60)#7,398 |
| 70. | Cedaredge | 4.7% | 2.2%(+2.50)#70 | 3.1%(+1.60)#7,419 |
| 71. | Yuma | 4.6% | 2.2%(+2.40)#71 | 3.1%(+1.50)#7,551 |
| 72. | Parachute | 4.6% | 2.2%(+2.40)#72 | 3.1%(+1.50)#7,575 |
| 73. | Ignacio | 4.6% | 2.2%(+2.40)#73 | 3.1%(+1.50)#7,582 |
| 74. | Cheyenne Wells | 4.5% | 2.2%(+2.30)#74 | 3.1%(+1.40)#7,745 |
| 75. | Holly | 4.5% | 2.2%(+2.30)#75 | 3.1%(+1.40)#7,755 |
| 76. | Rockvale | 4.5% | 2.2%(+2.30)#76 | 3.1%(+1.40)#7,759 |
| 77. | Coal Creek | 4.5% | 2.2%(+2.30)#77 | 3.1%(+1.40)#7,771 |
| 78. | Alamosa | 4.4% | 2.2%(+2.20)#78 | 3.1%(+1.30)#7,846 |
| 79. | Fort Lupton | 4.4% | 2.2%(+2.20)#79 | 3.1%(+1.30)#7,853 |
| 80. | Paonia | 4.4% | 2.2%(+2.20)#80 | 3.1%(+1.30)#7,896 |
| 81. | Bow Mar | 4.4% | 2.2%(+2.20)#81 | 3.1%(+1.30)#7,911 |
| 82. | Empire | 4.4% | 2.2%(+2.20)#82 | 3.1%(+1.30)#7,939 |
| 83. | Springfield | 4.3% | 2.2%(+2.10)#83 | 3.1%(+1.20)#8,072 |
| 84. | Redvale | 4.3% | 2.2%(+2.10)#84 | 3.1%(+1.20)#8,125 |
| 85. | Blanca | 4.3% | 2.2%(+2.10)#85 | 3.1%(+1.20)#8,128 |
| 86. | Evans | 4.2% | 2.2%(+2.00)#86 | 3.1%(+1.10)#8,190 |
| 87. | Mountain Village | 4.1% | 2.2%(+1.90)#87 | 3.1%(+1.000)#8,449 |
| 88. | Winter Park | 4.0% | 2.2%(+1.80)#88 | 3.1%(+0.900)#8,674 |
| 89. | Green Mountain Falls | 4.0% | 2.2%(+1.80)#89 | 3.1%(+0.900)#8,693 |
| 90. | Boulder | 3.9% | 2.2%(+1.70)#90 | 3.1%(+0.800)#8,727 |
| 91. | Greeley | 3.8% | 2.2%(+1.60)#91 | 3.1%(+0.700)#8,920 |
| 92. | Fort Carson | 3.8% | 2.2%(+1.60)#92 | 3.1%(+0.700)#8,941 |
| 93. | Niwot | 3.8% | 2.2%(+1.60)#93 | 3.1%(+0.700)#8,993 |
| 94. | Bennett | 3.7% | 2.2%(+1.50)#94 | 3.1%(+0.600)#9,204 |
| 95. | Fowler | 3.7% | 2.2%(+1.50)#95 | 3.1%(+0.600)#9,249 |
| 96. | Garden City | 3.7% | 2.2%(+1.50)#96 | 3.1%(+0.600)#9,303 |
| 97. | Northglenn | 3.6% | 2.2%(+1.40)#97 | 3.1%(+0.500)#9,331 |
| 98. | Edgewater | 3.5% | 2.2%(+1.30)#98 | 3.1%(+0.400)#9,604 |
| 99. | Deer Trail | 3.5% | 2.2%(+1.30)#99 | 3.1%(+0.400)#9,689 |
| 100. | Trinidad | 3.4% | 2.2%(+1.20)#100 | 3.1%(+0.300)#9,788 |
Common Questions
What are the Top 10 Cities with the Highest Percentage of Families with Income Below $10,000 in Colorado?
Top 10 Cities with the Highest Percentage of Families with Income Below $10,000 in Colorado are:
What city has the Highest Percentage of Families with Income Below $10,000 in Colorado?
Brandon has the Highest Percentage of Families with Income Below $10,000 in Colorado with 100.0%.
What is the Percentage of Families with Income Below $10,000 in the State of Colorado?
Percentage of Families with Income Below $10,000 in Colorado is 2.2%.
What is the Percentage of Families with Income Below $10,000 in the United States?
Percentage of Families with Income Below $10,000 in the United States is 3.1%.